Corpus Christi Air Monitoring and Surveillance Camera Project Sixth Annual Report to the US District Court by
|
|
|
- Heather Fleming
- 5 years ago
- Views:
Transcription

1 Corpus Christi Air Monitoring and Sixth Annual Report to the US District Court by Center for Energy and Environmental Resources David T. Allen, Principal Investigator Vincent M. Torres, Project Manager Dave Sullivan, Quality Assurance Manager January 8, 2010
2 Today s Presentation Introductions Project Overview Project Budget Project Financial Status Temporal Trends & Other Data Analysis Interactions with the Community Statement by Representative of the Project s Voluntary Advisory Board Q & A 2
3 Project Overview Year 1 Hired contractors and began construction of 7 sites Established Voluntary Advisory Board Year 2 Completed construction of sites, acceptance testing of sites & began reporting data April 1, 2005 (collected data for 6 months of Year 2) through TCEQ & project websites Years 3 through 6 Continued collection & reporting of data; optimized operation of sites to maximize use of project funds Project remains on schedule & within budget 3
4 Air Monitoring Network Site Locations 4
5 Project Budget Of total project costs for first 6 years, only site construction (1.5 years) and 3.5 year of operations & maintenance (O&M) costs have been funded by this project Additional funds provided by a Supplemental Environmental Project (SEP) awarded by the TCEQ funded O&M costs for one year Beginning October 2, 2006, all O&M costs have been charged to this project. Total expenditures for the first 6 years of the project included only 3.5 years of O&M costs 5
6 Project Financial Status Expenditures Total for prior years $4,102, Current year (ending 9/30/09) $988, Total* to date (9/30/09) $5,091, * Initial budget estimated $2,300,000 for site construction & deployment and $2,664,600 for operations & maintenance after construction for approximately 3.5 years for a total initial estimate of $4,964,600; Actual costs were $5,091, Funds Remaining Initial deposit (10/2/03) $6,761, Less expenditures to date (9/30/09) ($5,091,808.40) Plus interest earned to date (9/30/09) $726, Project funds remaining** $2,396, **The remaining project funds plus future interest earned are estimated to allow the project to operate for two more years (total of 8 years compared to initial estimate of 7 years) to September 2011, assuming no extraordinary costs arise. 6
7 Temporal Trends & Other Data Analysis 7
8 Outline 1. Monitoring network background 2. TCEQ toxicological terminology 3. Summary of speciated hydrocarbons measured in residential areas 4. Trends in total non-methane hydrocarbon data 5. Trends in benzene measured in residential areas 6. Three case study analyses of pollution events 7. Update on canister sampling 8. Summary of sulfur compound measurements 9. Conclusions 8
9 1. Monitoring Network Background 9
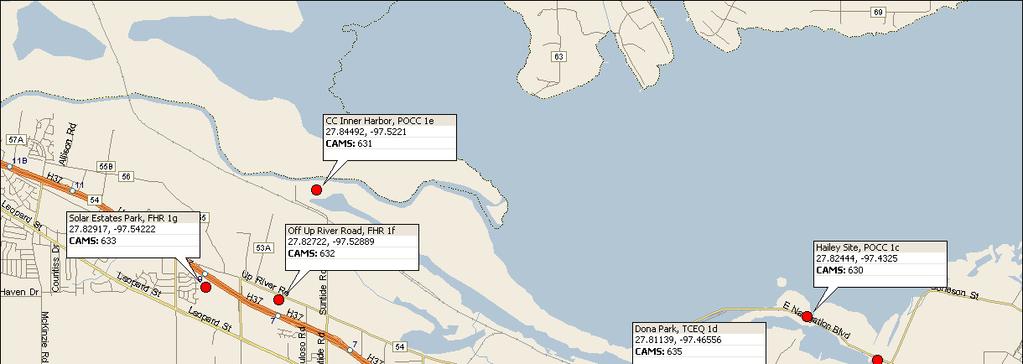
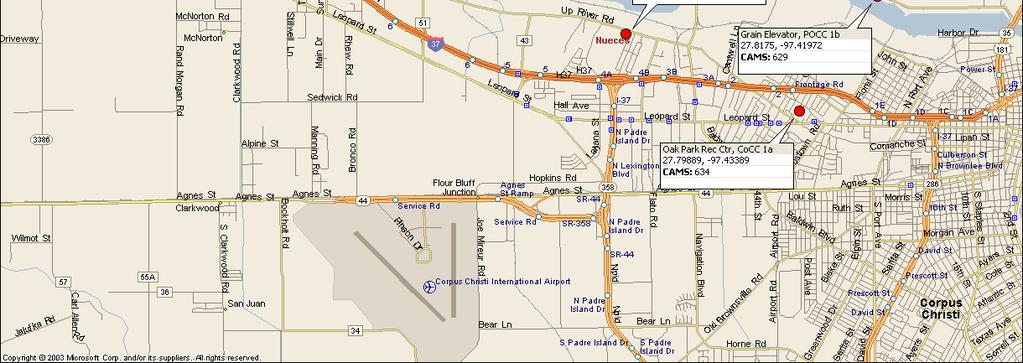
10 Air Monitoring Sites, Locations, & Instrumentation Monitoring Equipment TCEQ CAMS Description of Site Location TNMHC(T) & H2S & Nos. Auto GC Canister(C) SO2 Met StationCamera Oak Park Recreation Center 634 Yes T Yes 629 Grain Port of Corpus Christi T&C Yes Yes 630 J. I. Hailey Port of Corpus Christi T&C Yes Yes 635 TCEQ Monitoring Site Dona Park T&C Yes Yes Yes 631 Port of Corpus Christi on West End of CC Inner Harbor T&C Yes Yes 632 Off Up River Road on Flint Hills Resources Easement T&C Yes Yes 633 Solar Estates Park at end of Sunshine Road Yes T Yes Yes Yes 10
11 Air Monitoring Network Site Locations 11

12 White Point Javelina 12
13 13

14 Small Emission Sources Eastern Network 14

15 Small Emission Sources Western Network 15
16 Pollutant concentrations Explanation of monitoring terms Gravimetric vs volumetric; ppbc vs ppbv Auto-GC 40 min sample every hour for 47 hydrocarbon species C2-C11 Carcinogens, photochemical compounds Sited in neighborhoods at Solar Estates CAMS 633 & Oak Park CAMS 634. Total non-methane hydrocarbons (TNMHC) 5 min time resolution, unspeciated, aside from methane Operate at all 7 UT/CEER sites. Sustained level of 2000 ppbc used to trigger canister samples. Canister Stainless steel cans filled when sensor detects elevated TNMHC. 20 minute samples capture chemical make-up of air, some species. Operated at 5 of 7 UT/CEER sites. Elevated Concentrations Colloquial term for pollutant above ESL or ReV (e.g., benzene), above a state standard (e.g., H 2 S), above a triggering threshold (e.g., TNMHC), or statistically significantly higher than average (e.g., p<0.01). 16
17 2. TCEQ Toxicological Terminology 17
18 Explanation of monitoring terms Effects Screening Levels (ESLs) used to evaluate potential for effects to occur as a result of exposure to concentrations of constituents in the air. ESLs based on data concerning health effects, potential for odors to be a nuisance, effects on vegetation, & corrosive effects. not ambient air standards. If levels of a constituent do not exceed screening level, adverse health or welfare effects are not expected. If ambient levels of constituents in air exceed screening levels, it does not necessarily indicate a problem but rather triggers a review in more depth. (emphasis added) 18
19 Use of ESLs Air permit reviews involve evaluations of BACT & predicted concentrations from proposed new emissions. In review of proposed emissions, federal/state standards & chemicalspecific Effects Screening Levels (ESLs) are used. 19
20 Explanation of monitoring terms Reference Values (ReVs) - ReVs are healthbased toxicity values used in evaluation of ambient air monitoring data and in calculation of health-based ESLs and source media cleanup levels. Benzene ReV = 180 ppbv for 1-hour Benzene long-term ESL used for longterm exposure = 1.4 ppbv 20
21 Use of ReVs Reference Values (ReVs) are used to evaluate measured air toxics for potential to cause health/welfare effects, and to help TCEQ prioritize resources in permitting, compliance, enforcement. Generally, ESL = 0.3 * ReV 21
22 3. Summary of Hydrocarbon Species Measured in Residential Areas General downward trend over time All 2009 values below ESL or ReV 22
23 Solar Estates Auto-GC annual means Oct Oct Oct Oct Species -ppbv Sep 2006 Sep 2007 Sep 2008 Sep 2009 Ethane Ethylene Propane Propylene Isobutane n-butane t-2-butene Butene c-2-butene Isopentane n-pentane ,3-Butadiene t-2-pentene Pentene c-2-pentene n-hexane Benzene Cyclohexane Toluene Ethyl Benzene p-xylene + m-xylene o-xylene Isopropyl Benzene - Cumene ,3,5-Trimethylbenzene ,2,4-Trimethylbenzene n-decane ,2,3-Trimethylbenzene
24 Oak Park Auto-GC annual means Oct Oct Oct Oct Species -ppbv Sep 2006 Sep 2007 Sep 2008 Sep 2009 Ethane Ethylene Propane Propylene Isobutane n-butane t-2-butene Butene c-2-butene Isopentane n-pentane ,3-Butadiene t-2-pentene Pentene c-2-pentene n-hexane Benzene Cyclohexane Toluene Ethyl Benzene p-xylene + m-xylene o-xylene Isopropyl Benzene - Cumene ,3,5-Trimethylbenzene ,2,4-Trimethylbenzene n-decane ,2,3-Trimethylbenzene
25 4. Trends in Total Nonmethane Hydrocarbons Significant declines area-wide Especially noteworthy decline at one site 25
26 FHR CAMS 632 TNMHC Formerly measured the highest concentrations in the area Concentrations have dropped significantly Likely cause is reduced emissions from small nearby sources 26

27 CAMS 632 environs FHR C632 tanks 2 pump jacks 27

28 CAMS 632 environs Large tanks Small tanks 28

29 5-min TNMHC ppbc FHR C632 Sept 05 Aug 09 (omit 110 values not cropped at 10,000 ppbc) 29
30 FHR C632 TNMHC Sept. Aug. median, 75 th, 90 th, 95 th, 99th p-tiles 5-min data 30
31 TNMHC ppbc median & 75 th p-tile concentrations 2-deg. wind dir bins, by Sept Aug periods 31


32 CCG CAMS 629 JIH CAMS 630 WEH CAMS 631 Trends at other TNMHC sites ppbc units Sept.-Aug. years (State FY) 32


33 SOE CAMS 633 Oak CAMS 634 DPK CAMS 635 Trends at other TNMHC sites ppbc units Sept.-Aug. years (State FY) 33
34 5. Benzene Trends Seasonally-adjusted quarterly means show clear decline 34
35 Quarterly Benzene from Auto-GCs in Corpus Christi Q SOE Qtrly Mean ppbv 4Q 06 4Q OAK Qtrly Mean ppbv 1.20 R 2 R= = R 2 =0.06 R 2 = Q 4Q Q Q 05 4Q 06 4Q 4Q Mar- 05 Sep- 05 Mar- 06 Sep- 06 Mar- 07 Sep- 07 Mar- 08 Sep- 08 Mar- 09 Sep- 09 Mar Mar- 05 Sep- 05 Mar- 06 Sep- 06 Mar- 07 Sep- 07 Mar- 08 Sep- 08 Mar- 09 Sep- 09 Mar- 10 General downward trend, significant seasonality Slight up-tick at Oak Park in 4Q09 35
36 Seasonally-adjusted benzene trends SOE Qtrly Mean ppbv OAK Qtrly Mean ppbv y = -0.01x R 2 = y = -0.02x R 2 = After adjusting for seasonality, downward trend is more significant Trend suggests 0.01 ppb/qtr average decline at Solar Estates (0.04 ppb/yr) and 0.02 ppb/qtr average decline at Oak Park (0.08 ppb/yr) 36
37 6. Three Case Studies TNMHC at WEH 2/24/09 1,3-Butadiene at Solar Estates 9/26/09 White Point emissions study 37
38 Case Study 1: TNMHC at WEH 2/24/09 alert at WEH, 6:35 pm, 16 mph SE winds. TNMHC at 52,000 ppbc, one of the highest recorded values ever. FHR representative told TCEQ they had found a ¼ hole in a hose at the railcar loading rack where isobutane was being loaded. FHR estimated 12 pounds had leaked from 6 pm to 7:30 pm. 38
39 TNMHC data and wind direction 2/24/ , WDR deg TNMHC ppb-c 50,000 Wind Direction deg :30 CST :45 CST Note that some channeling of winds occurs at this site owing to nearby piles of dirt used in road construction. 40,000 30,000 20,000 10,000 TNHMC ppbc 0 0 2/24 0 2/24 4 2/24 8 2/ / / /25 0 2/25 4 2/25 8 2/25 12 Date, Hour 39
40 Canister contents: Isobutane Odor ESL 40

41 Surface back-trajectory from time of maximum TNMHC 41
42 Case Study 2: Solar Estates 1,3- Butadiene Unusually high values measured Sept. 27, 2009 Strong directionality present in data since 2005 No apparent health risk at Solar Estates; however, uncertainty exists regarding concentrations closer to the source. 42
43 1,3-Butadiene Made via processing petroleum. Colorless gas with mild gasoline-like odor. About 75% used to make synthetic rubber, widely used for tires. Also used to make plastics, acrylics. Small amounts are found in gasoline. 43

44 TCEQ Reference Value & ESL for 1,3 Butadiene a Values that may be used for evaluation of air monitoring data See HRVOC -- Effect on Ozone Formation -- 1,3-Butadiene ranks 3 rd or 4 th among 58 species we measure in terms of photochemical reactivity 44
45 1,3-Butadiene at Solar Estates No short-term value or long-term average is close to an ESL or ReV. However, data from Solar Estates suggests short & long-term concentrations may be higher at other locations in the area. Max values measured to date were taken on Sunday Sept. 27, 2009 at 5 and 7 CST (6 a.m. and 8 a.m. CDT) 45
46 1,3-Butadiene and Wind Direction by Hour (CST) nighttime 9/26 and morning 9/ ,3-Butadiene ppbv Midnight CST Wind direction Sept. 26 Sept
47 9/ ,3-Butadiene ppbv and Health Effects Screening Levels ,3-Butadiene ppbv Tox ESL Odor ESL 13but_ppbV Midnight CST Sept. 26 Sept
 No upsets reported in that area on 9/27 48")
48 Possible emission source Only one industrial facility upwind on 9/27 (Equistar on McKinzie Rd) No upsets reported in that area on 9/27 48
49 White icon = 0 ppbv Color-coded surface backtrajectories started each hour from Solar Estates, beginning 11:30 p.m. CST the night before. 49

50 White icon = 0 ppbv 50
51 White icon = 0 ppbv 51
52 White icon = 0 ppbv 52

53 White icon = 0 ppbv 53
54 Yellow icon = 2-6 ppbv 54
55 Red icon = 35 ppbv 55
56 Yellow icon = 2-6 ppbv 56
57 Red icon = 35 ppbv 57
58 White icon = 0 ppbv 58
59 Distributions of Wind Direction & Speed at Solar Estates Wdr bin deg Prevailing winds (Num obs) at Solar Estates (and in Corpus Christi overall) are south southeast. Westerly winds are least frequent. Coincidentally, SSE winds have highest mean & std dev (variability) for wind speed, and westerly winds have lowest speed and variability. Num obs Wsr mean mph Wsr std mph 0 3, , , , , , , , ,
60 Kernal-smoothed mean 1,3-butadiene (ppbc) by wind direction w & w/o speed-adjustment It is hard to predict what concentrations are, say, one mile north of the facility, which provides rationale for modeling Peak direction around degrees 60
61 Case Study 3: White Point Emissions Late-2007 began to receive more alerts under northerly winds at sites on north side of ship channel. Key wind directions and back-trajectory analyses showed the White Point peninsula on north side of Nueces Bay may be source area. TCEQ and RRC confirmed much oil & natural gas extraction work in progress. 61

62 Dona Park elevated concentrations direction cone ; top of figure is White Point area 62

63 Dona Park filtered TNMHC values: conc. >= 1000 ppbc wind direction between 340, 360 degrees C 4000 N M H C / 01/ / 01/ / 02/ / 01/ / 02/
64 JIH can triggered 12/10/09 6:43 p.m., White Point suspected upwind source propane isobutane 1-butene 1,3-butadiene butane trans-2-butene cis-2-butene 3-methyl-1-butene isopentane 1-pentene pentane isoprene trans-2-pentene cis-2-pentene 2-methyl-2-butene 2,2-dimethylbutane cyclopentene 4-methyl-1-pentene cyclopentane 2,3-dimethylbutane 2-methylpentane 3-methylpentane methyl-1-pentene + 1-hex hexane trans-2-hexene cis-2-hexene methylcyclopentane 2,4-dimethylpentane benzene cyclohexane 2-methylhexane 2,3-dimethylpentane 3-methylhexane 1,2-dichloropropane 2,2,4-trimethylpentane heptane methylcyclohexane 1,1,2-trichloroethane 2,3,4-trimethylpentane toluene 2-methylheptane 3-methylheptane 1,2-dibromomethane octane tetrachloroethylene chlorobenzene ethylbenzene m/p-xylene styrene o-xylene nonane isopropylbenzene n-propylbenzene m-ethyltoluene p-ethyltoluene 1,3,5-trimethybenzene o-ethyltoluene m-diethylbenzene p-diethylbenzene ethylene acetylene ethane propylene ppbc


65 Railroad Commission Web site confirms recent oil & gas work (see 65
66 7. Update on Canister Sampling Preliminary ensemble multivariate analysis 66
67 Benzene Values Count of cans Average benzene ppbv Max benzene ppbv TCEQ Reference value Site name CCG CAMS DPK CAMS FHR CAMS JIH CAMS WEH CAMS Odorous Values Site name Date-Time CST Species Value ppbv Odor ESL Health ESL WEH CAMS 631 2/24/ :47 Isobutane 7,123 2,040 8,000 JIH CAMS /9/2008 3:34 2-Methylpentane ,000 JIH CAMS /9/2008 3:34 Isoprene JIH CAMS /10/ :43 n-propylbenzene
68 Preliminary ensemble multivariate analysis Individual canister samples have been collected and used in case studies. Now a large enough number collected to look at the entire collection of data. Analysis to date uses 28 species with best quality data, 134 twenty-minute canister samples, 5 sites, Results only preliminary / exploratory. 68
69 Data suggest several factors: C4 C5 alkene factor butene & pentene isomers BTEX factor benzene, toluene, ethylbenzene, xylenes, TMBs Alkane factor (natural gas?) ethane, propane, butane-pentane-hexane isomers, heptane Heavy alkane factor heptane, octone, nonane Ring factor cyclopentane, benzene, cyclohexane C2 factor acetylene, ethylene 69
70 Next steps Combine factor scores with original data to discern which sites are affected by which factors? from those sites, what are typical upwind directions and source areas corresponding to specific factors? Ultimately we may compare the factors and upwind sources to reported emissions inventory => Bottom-up vs Top-down 70
71 8. Summary of SO 2 & H 2 S Monitoring No exceedances
72 SO 2 Concentration Summary Site name Summary Statistics * NAAQS CCG Annual Mean Highest Daily Mean JIH Annual Mean Highest Daily Mean WEH Annual Mean Highest Daily Mean Huisache Annual Mean Highest Daily Mean Dona Park Annual Mean Highest Daily Mean Solar Annual Mean Highest Daily Mean FHR Annual Mean Highest Daily Mean
73 9. Conclusions Auto-GCs: no values > ESL or ReV; values lower in most recent 2 years over first 2 years Benzene concentrations have downward trend ,3-Butadiene at Solar Estates bears watching TNMHC at FHR has declined significantly; declines also at other 6 sites Will continue to use directional information and speciated hydrocarbon data to identify specific source facilities that may be disproportionally emitting pollution. 73
74 Interactions with the Community Two New Supplemental Environmental Projects Sought Advisory Board input to prioritize funds Requested POCC Approval to Install Cameras Port Industries Technical Committee (April 16, 2009) Made Presentations on Project and Data Long Term Health Work Group (November 12, 2008) Coastal Bend Foundation (May 11, 2009) Air Quality Group (June 24, 2009) Provided Auto-GC Data and Trend Analysis Hillcrest Community Meeting (December 11, 2008) Meetings of the Volunteer Advisory Board 74
75 Statement by Representative of the Volunteer Advisory Board Ms. Gretchen Arnold 75
76 Contact Information for Project Personnel Principal Investigator - Dr. David T. Allen Phone: allen@che.utexas.edu Project Manager - Vincent M. Torres Phone: vmtorres@mail.utexas.edu Quality Assurance Officer Dr. David Sullivan Phone: 512/ sullivan231@mail.utexas.edu Contracts Manager - Maria Stanzione Phone: maria.stanzione@mail.utexas.edu Administrative Associate Terri Mulvey Phone: terri.mulvey@mail.utexas.edu Project Web Site: 76