Attachment 6 Hydrologic and Hydraulic Analysis
|
|
|
- Rudolph McCoy
- 5 years ago
- Views:
Transcription
1 Attachment 6 Hydrologic and Hydraulic Analysis
2 HYDROLOGIC AND HYDRAULIC ANALYSIS COMBINATION POND DAM VT Dam # City of Rutland, Vermont Prepared for: City of Rutland Prepared by: February 23, 2012 D&K #121240
3 HYDROLOGIC AND HYDRAULIC ANALYSIS TABLE OF CONTENTS COMINATION POND DAM VT Dam # City of Rutland, Vermont 1.0 INTRODUCTION Overview Design Storm HYROLOGIC ANALYSIS Hydrologic Methods Hydrologic Results EXISTING CONDITIONS HYDRAULIC ANALYSIS Hydraulic Methods Hydraulic Results ALTERNATIVES FOR ADDITIONAL HYDRAULIC CAPACITY Description of Alternatives Alt A: Relatively Large New Spillway plus Leveling of Dam Crest Alt B: Relatively Small New Spillway plus Overtopping Protection Hydraulic Results of Alternatives DISCUSSION AND RECOMMENDATIONS...9 ATTACHMENTS A. MAPPING AND PHOTOGRAPHS Photographs Watershed Topographic Map Watershed Orthophoto Map Existing Conditions Basemap B. H&H INPUT DOCUMENTATION Rainfall Depth Summary Table and Supporting Documentation NRCS Soils Report Hydrologic Soil Group Summary Tables C. H&H RESULTS DOCUMENTATION HydroCad Model Output (Existing Q2 PMF) Comparison of Computed Inflow to Regional Flow Data H&H Analysis for Combination Pond Dam 1 DuBois & King, Inc City of Rutland, Vermont February 23, 2012
4 1.0 INTRODUCTION 1.1 Overview This report summarizes a hydrologic and hydraulic (H&H) evaluation of the existing Combination Pond Dam (VTDEC Dam #173.03) located in the City of Rutland, Rutland County, Vermont. This evaluation was conducted in support of an Alternatives Evaluation for the dam to improve downstream water quality and reduce the risk of dam failure and the associated downstream damages. While removal of the dam is among the alternatives being evaluated, all other alternatives entail keeping the dam and making other changes to improve downstream water quality. If the dam is to remain, upgrades to bring it into compliance with current safety standards including an increase in hydraulic capacity given the dam s history of overtopping will likely be required. This H&H report focusses on the hydraulic capacity issue. Other deficiencies with the dam are addressed in the Alternatives Evaluation. Combination Pond Dam was originally constructed sometime prior to It was previously known as Healy Pond. The dam is presently owned by Charter Hills, Inc, and is used for recreational purposes. By deed, many of the parcels on either side of the dam have rights to use the parcel with the dam for recreation. The existing dam is an earthen embankment approximately 120 feet long and 14 feet high. The side slopes on the upstream and downstream slopes are approximately 2H:1V. Sharon Drive runs across the top of the dam. The spillway consists of a 4 x 4 concrete riser that discharges to a 36 corrugated metal outlet pipe. There is a second riser measuring 7 x 4 approximately 1 higher than the primary spillway that also connects to the same 36 outlet pipe. Photographs of the dam and an existing condition site plan are included in Attachment A. 1.2 Design Storm Vermont s dam statutes and regulations do not define specific spillway design floods (SDF) for jurisdictional dams. The policy of the DEC s Dam Safety program, as documented in the State s Dam Order application (the permit needed to alter or construct a dam), is that the SDF should be consistent with guidelines established by Federal agencies including the Corps of Engineers, Natural Resources Conservation Service, and the Bureau of Reclamation. Typically in Vermont, the Corps of Engineer s guidelines are employed. These guidelines provide a range of applicable design storms for a dam based on the size of the impoundment and the downstream Hazard Classification. H&H Analysis for Combination Pond Dam 2 DuBois & King, Inc City of Rutland, Vermont February 23, 2012
5 In addition to Corps guidelines, the State s Dam Order application specifies the following minimum hydraulic design standards for all jurisdictional dams: The SDF shall not be less than the routed 100-year inflow. Freeboard shall not be less than 1.5 feet from the routed 100-year water surface elevation to the top of dam. Freeboard shall not be less than 3.0 feet from the principal spillway crest (usually the normal water level) to the top of dam. The Dam Safety program currently classifies Combination Pond Dam as a Low Hazard structure. By Corps guidelines, the potential water storage at the top of the dam (20 ac-ft) puts it in the Small Size (50-1,000 ac-ft of storage) category by default, though it is actually smaller than the lower threshold. For a Low Hazard, Small Size structure, the Corps guidelines recommend that the SDF be the 50 to 100-year frequency storm. In the latest State inspection report (2007), the State suggested that the presence of houses downstream might warrant a change in hazard classification. If it were to be reclassified to Significant Hazard, Corps guidelines recommend that the SDF be the 100-year to ½ Probable Maximum Flood (PMF) event. The PMF is defined as the flood resulting from the most severe combination of critical meteorological and hydrologic conditions that are reasonably possible at a specific location. The ½ and ¼ PMF storms are simply smaller fractions of the full PMF storm. For comparison, a ½ PMF is typically on the order of 3 5 times larger than the 100-year flood event, and the full PMF is typically 5 10 times larger. Designing a dam to safely pass the ½ PMF or full PMF requires either a relatively large spillway or a relatively large amount of available storage below the top of the dam. 2.0 HYROLOGIC ANALYSIS 2.1 Hydrologic Methods D&K prepared a rainfall-runoff model for contributing watershed using the HydroCad computer program. The model was used to calculate the volume and timing of flows into the reservoir during the 2, 10, 25, 50, and 100-year storm events as well as the ¼, ½, and full Probable Maximum Flood (PMF) events. It was then used to evaluate the hydraulic capacity of the existing dam and its performance during the various flood events. The HydroCad program uses the SCS (now NRCS) unit hydrograph method to compute stormwater runoff from a watershed. The method determines runoff discharge rates for a given drainage area over a specified duration of time. The parameters required for this method include the drainage areas, rainfall depth, times of concentration, curve numbers, and dimensions of structures such as dams. The major inputs are summarized below. Additional details are included with the attached HydroCad input and output files (Attachment C). H&H Analysis for Combination Pond Dam 3 DuBois & King, Inc City of Rutland, Vermont February 23, 2012
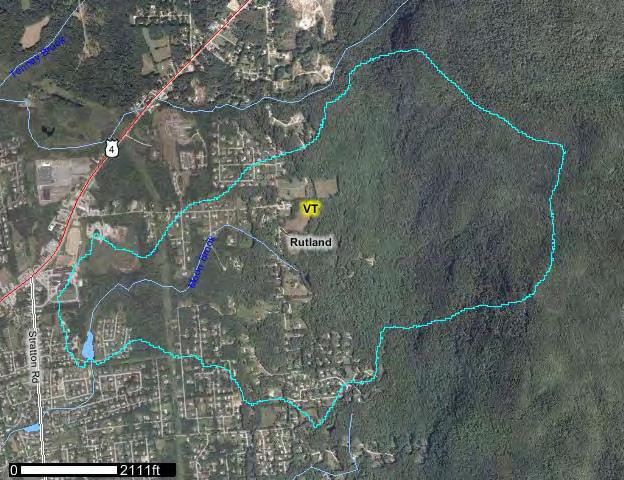
6 Drainage Areas. The watershed area was delineated using the USGS online StreamStats program. The drainage area at the dam is 1.64 square miles (1051 acres). The watershed was modeled as one subbasin. A map showing the watershed is included in Attachment A. Times of Concentration. The time of concentration for the watershed was determined by summing the travel time for sheet flow, shallow concentrated flow, and channel flow along the flow path from the most hydrological distant point within the watershed. Data about the flow path such as slope, flow length, and surface roughness was developed using the USGS online StreamStats program. A map showing the times of concentration flow path is included in Attachment A. Rainfall. Rainfall values used for the 2-year through the 100-year storms were obtained from the Northeast Regional Climate Center Atlas of Precipitation Extremes for Northeastern United States and Southeastern Canada. The 100-year total 24-hour precipitation for the watershed is 6.05 inches. The NRCS Type II rainfall distribution was used for the 2-year to 100-year, 24-hour storms. For the ¼, ½, and full Probable Maximum Precipitation (PMP) storms, a center-weighted 24-hour storm distribution based on precipitation values obtained from the National Oceanic and Atmospheric Administration (NOAA) Hydrometeorological Reports No. 51 and No. 52 was used. The full PMP 24-hour precipitation for the contributing watershed is 24 inches, the ½ PMP 24-hour precipitation is 14 inches, and the ¼ PMP 24-hour precipitation is 7 inches. Precipitation documentation is included in Attachment B. Land Cover, Soils, and Curve Numbers. The curve numbers were determined using standard NRCS reference values based on land cover, hydrologic soil group, and professional judgment. Land cover was based on observations during a Summer 2011 site visit and interpretation of the 2009 aerial photography (National Agricultural Imagery Program). Approximately 60% of the watershed is forested, and the remaining 40% is predominantly residential and commercial or institutional development with the associated buildings and roads. Less than 1% is open water. An orthophoto map of the project area is included in Attachment A. The hydrologic soil groups (HSG) for each subwatershed were based on NRCS digital maps. Approximately 17% of the watershed is comprised of relatively well-drained HSG A soils, 11% is B soils, 58% is C soils, and the remaining 14% is D soils and water. A map of the hydrologic soil groups in the watershed is included in Attachment A. Dam and Pond Dimensions. D&K conducted a limited survey of the dam in June. An Existing Conditions Plan was developed from this survey and is included in Attachment A. The stage-surface area data at the dam was based on the field survey. H&H Analysis for Combination Pond Dam 4 DuBois & King, Inc City of Rutland, Vermont February 23, 2012
7 2.2 Hydrologic Results The results of the hydrologic analysis are summarized in Table 1. The results are presented for the 100-year rainfall event, the ¼ PMF event, the ½ PMF event, and the full PMF. Note that the model was run assuming antecedent moisture condition level 2, which is standard for determining spillway capacity. Detailed HydroCad input and output are included in Attachment C. Table 1. Summary of Computed Inflow Event 24-hour Rainfall Depth (in) Peak Inflow to Reservoir (cfs) Unit Discharge (cfs/sq mi) 2-year year year year year ¼ PMF ½ PMF Full PMF The calculated 100-year peak runoff was compared to 100-year flow at 138 stream gages in Vermont and surrounding states as reported by the USGS. The ½ and full PMF were compared to PMFs previously computed by the U.S. Army Corps of Engineers for flood control dams in the region that they operate. A graph of the results is included in Attachment C. The predicted 100-year runoff is above the best-fit line through the data. This is to be expected given the steep slopes in the contributing watershed and the prevalence of soils with relatively slow infiltration rates (72% C and D type soils). The fact that the computed value is significantly above the best-fit line indicates that the results are likely conservative. The computed PMF is in line with PMFs for Corps dams in the region. 3.0 EXISTING CONDITIONS HYDRAULIC ANALYSIS 3.1 Hydraulic Methods The computed inflows were routed through the existing spillway using HydroCad. The existing primary spillway was modeled as a horizontal orifice with flow treated as weir flow at low heads. The outlet pipe was modeled as a 36 CMP. The concrete and masonry portion near the upstream end of the pipe was neglected, and treated simply as an extension of the CMP. The secondary drop-inlet was also modeled as a horizontal orifice, though the computed outflow was reduced by 50% to account for blockage caused by the grating over the opening. The crest of the principle spillway was set at elevation feet, which corresponds to the normal summer pool elevation. Based on D&K s field survey, the top of the dam was set 2.5 higher at elevation H&H Analysis for Combination Pond Dam 5 DuBois & King, Inc City of Rutland, Vermont February 23, 2012
8 3.2 Hydraulic Results The results of the hydraulic analysis are summarized in Tables. Table 2. Hydraulic Results Storm Event Top of Dam Elev. (ft) Normal Pool Elev. (ft) Inflow (cfs) Outflow (cfs) Peak WSEL (ft) Freeboard (ft) Primary drop inlet (4 x4 ) at elevation 647.2, second drop inlet (7 x4 ) at elevation , both connecting to one 36 CMP. Top of dam treated as broad crested weir. Q Q Q Q Q ¼ PMF ½ PMF Full PMF Under current existing conditions, only the 2-year and 10-year design storms pass through the spillways without overtopping the dam. The 2-year event passes with water rising to within 1.7 feet of the top of dam (i.e., the road). The 10-year event rises to the road but does not overtop. Above the 10-year event, the dam is overtopped. The 100-year design storm event overtops with a depth of 1.1 feet. During the ¼ PMF and ½ PMF (possible design storms were the Vermont DEC to reclassify the dam to Significant Hazard), the dam dam overtops by 1.4 feet and 2.6 feet, respectively. During the 2-year storm event there is relatively little reduction of the peak inflow, meaning the reservoir does little to reduce peak flows downstream. The inflow is reduced 5% from 39 cfs to 37 cfs, which is an insignificant and likely imperceptible difference. During the 10-year storm event, flows are reduced 23% from 133 cfs to 102 cfs. Once the dam overtops, there is almost no attenuation of peak flows; what comes in goes immediately out. While the 23% reduction in peak flow (inflow vs. outflow) during the 10-year storm may seem significant on the surface, the flood attenuating value of the pond should not be overstated. During Tropical Storm Irene, the dam overtopped by roughly a foot (suggesting approximately the 100-year flood event) and there was no meaningful reduction in flows. Yet the City reports that downstream flooding was limited to low-lying areas rather than road crossings. This suggests that at the 100-year flood level the channel capacity is exceeded only in limited locations, and it further suggests that during lesser events (e.g, the 10-year), the channel would likely have adequate capacity. Thus, the 23% reduction in peak flow provided during the 10- year event is of little value because indications are that the downstream system can already accommodate the 10-year event and probably and somewhat larger flows; such a reduction in flow rates would only be of value from a flood reduction standpoint if it occurred during the larger events when downstream flooding is an issue, and Combination Pond is simply too small to provide the storage necessary to provide flow reduction during those larger events.. H&H Analysis for Combination Pond Dam 6 DuBois & King, Inc City of Rutland, Vermont February 23, 2012
9 4.0 ALTERNATIVES FOR ADDITIONAL HYDRAULIC CAPACITY There are a number of measures both physical and administrative to address a dam that can not pass as much water as regulatory standards require. A brief description of nine measures is attached. If Combination Pond is to remain in place and be brought up to current State standards, the three measures below, alone or in combination with each other, have the most potential. 1. Larger Spillway (bigger pipes equals more water). The existing pipes are limiting outflow. Given that they are approaching or are beyond their reliable service life, and thus replacement is a matter of time, it makes sense to replace them with larger components. 2. Raise Dam (higher crest means more storage volume before it overtops). While raising a dam crest means more potential storage and thus greater potential impacts downstream in the event of a breach, relatively minor raising can be a cost-effective way to increase storage capacity. 3. Armor Embankment for Overtopping (essentially, make the top of dam a new spillway). For reservoirs like combination pond where the volume of storm inflow during major events dwarfs the available storage volume, designing a dam to safely overtop is often much more practical and cost-effective than trying to capture and pass all the water through a spillway. With armoring, in effect, the dam crest itself becomes a new auxiliary spillway. 4.1 Description of Alternatives Two alternatives (A and B), which are combinations of the measures above, were identified and evaluated Alt A: Relatively Large New Spillway plus Leveling of Dam Crest The intent of Alternative A is to provide enough hydraulic capacity for the 100-year storm plus one foot of vertical freeboard as a safety factor. This would meet the hydraulic capacity requirements for the dam with its current classification as a Low Hazard structure. Under this alternative, the existing riser structure, secondary drop inlet, and the entire outlet barrel would be removed and replaced. A single 8 x 8 concrete riser would replace the two existing inlets, and a new 6 -wide x 5-tall concrete box culvert would replace the existing 36 CMP culvert. The dam crest would be raised 1.3 from to Alt B: Relatively Small New Spillway plus Overtopping Protection The intent of Alternative B is to improve the existing hydraulic capacity from the 10-year to the 25-year event, and then protect the dam so that it remains stable when overtopped by storms up H&H Analysis for Combination Pond Dam 7 DuBois & King, Inc City of Rutland, Vermont February 23, 2012
10 to at least the ¼ PMP. This would meet the hydraulic capacity requirements for the dam should the State reclassify it to a Significant Hazard structure. Under this alternative, the existing riser structure, secondary drop inlet, and the entire outlet barrel would be removed and replaced, but the replacement components would not be as large (and thus would not pass as much water) as under Alternative A. Specifically, a single 72 diameter concrete riser would replace the two existing inlets, and a new 42 diameter concrete culvert would replace the existing 36 CMP culvert. The crest of the dam would not be raised, but the downstream embankment would be armored to prevent erosion when the dam overtops. 4.2 Hydraulic Results of Alternatives Table 3. Alternative A Hydraulic Results Storm Event Top of Dam Elev. (ft) Normal Pool Elev. (ft) Inflow (cfs) Outflow (cfs) Peak WSEL (ft) Freeboard (ft) Single drop inlet (8 x8 ) at elevation 647.2, connecting to one 6 x5 concrete box culvert. Top of dam raised 1.3 to Q Q Q Q Q ¼ PMF ½ PMF Full PMF The relatively large new spillway components of Alternative A, coupled with a 1.8 raising of the dam, provide enough capacity to pass the 100-year storm event with 1.5 feet of vertical freeboard. This would meet the hydraulic capacity standards with the dam s current Low Hazard classification. A flow somewhere between the Q100 and the ¼ PMF would reach the top of the dam and begin overtopping. The major benefit of this alternative is that the frequency of dam overtopping the single greatest cause of earthen dam failure is greatly reduced. Since the 100-year storm passes with room to spare, the annual probability of the dam overtopping in any given year is less than 1%. That is a dramatic improvement over existing conditions where the probability is approximately 10%. The major drawback is that if the State reclassifies the dam as a Significant Hazard structure, the design storm will likely increase from the 100-year event to the ¼ PMF event, and this alternative can t meet pass the ¼ PMF. Another drawback is that the larger spillway components of this approach are relatively expensive. And a final drawback is that raising the dam by 1.3 feet means that more water can be stored and there is theoretically greater potential for downstream damages in the event of a dam breach. H&H Analysis for Combination Pond Dam 8 DuBois & King, Inc City of Rutland, Vermont February 23, 2012
11 Table 4. Alternative B Hydraulic Results Storm Event Top of Dam Elev. (ft) Normal Pool Elev. (ft) Inflow (cfs) Outflow (cfs) Peak WSEL (ft) Freeboard (ft) Single drop inlet (6 diam) at elevation 647.2, connecting to one 42 diameter culvert. Top of dam leveled at elevation 650. Crest treated as broad crested weir. Downstream face armored for overtopping protection. Q Q Q Q Q ¼ PMF ½ PMF Full PMF The new spillway components of Alternative B are smaller than Alternative A (though still larger than existing), and that is reflected in the results. This alternative passes the 25-year event without overtopping (compared to the 10-year under existing conditions and the 100-year under the previous Alternative). However, the overtopping protection on the downstream embankment means that the dam could safely pass the 100-year and even the ¼ PMF. The major benefits of this alternative is that the annual risk of dam overtopping is reduced from about 10% to about 4%, and the armoring on the downstream side means that the dam is stable when overtopped for even for very significant storm events including the ¼ PMF. If the State reclassifies the dam to a Significant Hazard structure, this alternative would meet the hydraulic capacity requirement. Another benefit is that the spillway components are relatively inexpensive and easy to construct. A significant drawback is that the potential for overtopping, while much reduced, is still relatively high. With flows above the 25-year (4% annual probability) event causing overtopping, there s a 33% chance the dam will overtop at least once every ten years. 5.0 DISCUSSION AND RECOMMENDATIONS The dam is currently classified as a Low Hazard dam, and as such the applicable hydraulic design standard is safe passage of the 100-year storm with at least one foot of additional vertical freeboard between the computed water surface elevation and the top of the dam. Were the dam to be reclassified to Significant Hazard, the design storm would increase to the ¼ PMF. No detailed analysis has been conducted of potential downstream impacts following a catastrophic breach of the dam, but a screening level review of downstream development and experience with breach analyses for similar dams, it is likely that such an evaluation would show enough houses and road crossings at risk of damage that a reclassification to Significant Hazard would be warranted. H&H Analysis for Combination Pond Dam 9 DuBois & King, Inc City of Rutland, Vermont February 23, 2012
12 The existing dam overtops during storms greater than the 10-year event. During the 100- year storm, the dam would overtop by 1.1 feet, falling well short of the current standard of a foot of vertical freeboard between the computed water surface and the top of dam. Erosion during overtopping of a dam is the single greatest cause of failure for earthen dams. The pond lacks the storage volume to provide any meaningful reduction in peak flows (inflow vs. outflow), and thus even removing the dam completely would have almost no perceptible impact on flows at downstream locations. A combination of a new larger spillway (8 x8 riser leading to a 6 x5 box culvert outlet pipe) plus raising the dam by 1.3 the components of Alternative A would allow the 100-year storm to pass with 1.5 feet of freeboard, thereby meeting current State requirements. Passing the ¼ PMF or larger storm events through a closed outlet system is not practical; excessively large components and significant raising of the dam would be necessary. Thus for safe passage of flows greater than the 100-year event, modestly upsizing the existing spillway and protecting the downstream slope so that it is stable when overtopped Alternative B -- is a more practical approach. If the dam is to remain and is to be brought into compliance with current hydraulic capacity standards, we would recommend implementing the components of Alternative B. H&H Analysis for Combination Pond Dam 10 DuBois & King, Inc City of Rutland, Vermont February 23, 2012
13 Combination Pond Dam Photos. June 13, Looking upstream at the dam s downstream embankment including outlet of primary spillway and outlet of storm drain pipe. 2. Looking in downstream direction across the pond with inlet stream/head of impouindment on photo right.
14 3. Looking at primary riser with woody debris in trash rack, from edge of water on right side of dam. Dam crest is out of photo on photo right. 4. On left abutment looking across the top of dam. Pond is just visible in photo right.
15 5. Looking up the barrel of the primary spillway.
16 ENGINEERING PLANNING MANAGEMENT DEVELOPMENT 28 NORTH MAIN ST. RANDOLPH, VT TEL: (802) FAX: (802) WILLISTON, VT SPRINGFIELD, VT BEDFORD, NH Copyright 2011 Dubois & King Inc. PROFESSIONAL SEAL NOT FOR CONSTRUCTION PRELIMINARY PLANS CITY OF RUTLAND RUTLAND, VERMONT COMBINATION POND SHEET TITLE ALTERNATIVE #1 DO NOTHING (EXISTING CONDITIONS) DRAWN BY DATE ZDC FEB CHECKED BY D&K PROJECT # MTM L1 PROJ. ENG. D&K ARCHIVE # MTM XXXXXX SHEET NUMBER EX1 SHEET 1 OF 9
17 Extreme Precipitation Tables: N, W 1 of 1 10/25/2011 1:34 PM Northeast Regional Climate Center Data represents point estimates calculated from partial duration series. All precipitation amounts are displayed in inches. Smoothing Yes State Vermont Location near 49 Town Line Rd, Mendon, VT 05701, USA Longitude degrees West Latitude degrees North Elevation 912 feet Date/Time Tue, 25 Oct :34: Extreme Precipitation Estimates 5min 10min 15min 30min 60min 120min 1hr 2hr 3hr 6hr 12hr 24hr 48hr 1day 2day 4day 7day 10day 1yr yr yr yr 2yr yr yr yr 5yr yr yr yr 10yr yr yr yr 25yr yr yr yr 50yr yr yr yr 100yr yr yr yr 200yr yr yr yr 500yr yr yr yr Lower Confidence Limits 5min 10min 15min 30min 60min 120min 1hr 2hr 3hr 6hr 12hr 24hr 48hr 1day 2day 4day 7day 10day 1yr yr yr yr 2yr yr yr yr 5yr yr yr yr 10yr yr yr yr 25yr yr yr yr 50yr yr yr yr 100yr yr yr yr 200yr yr yr yr 500yr yr yr yr Upper Confidence Limits 5min 10min 15min 30min 60min 120min 1hr 2hr 3hr 6hr 12hr 24hr 48hr 1day 2day 4day 7day 10day 1yr yr yr yr 2yr yr yr yr 5yr yr yr yr 10yr yr yr yr 25yr yr yr yr 50yr yr yr yr 100yr yr yr yr 200yr yr yr yr 500yr yr yr yr
18
19
20
21
22
23

24 Custom Soil Resource Report Map Hydrologic Soil Group (Combo Pond) 43 38' 0'' 43 36' 25'' ' 41'' 72 57' 38'' Tenney Brook Patricia Ln Hillside Rd Wendy Ln Laverne Dr Woodstock Ave Harrington Ave Billings Ave Green Knolls Ln Stratton Rd Altrui Pl Victor Pl Nicole Pl 30B 30B Sharon Dr C 39B 95 Moonbrook Dr 4 30B Charter Hill Dr W Catherine Dr Giorgetti Blvd Killington Ave B 31B 15A 96 66B Irving Hts Rachel Dr Upland Dr Prior Dr 14B 67B Bos Pl 31C Grandview Ter Gables Pl 14A 30B Gleason Rd 66B Ridge Ter Post Rd Moon Brook North End Dr 30C 30B 14B 15A 31C Susan Ln David Rd 31C 67B 31D Deborah Dr Map Scale: 1:20,800 if printed on A size (8.5" x 11") sheet. Ruth Ave Bellevue Ln Lynette Dr 31B Connor Dr Karen Dr 30B East Ridge Ter Heather Ln Victoria Dr 86 67B Ilsa Ln 14A 31B 66B 30B Cannon Dr Town Line Rd 15A 30C 67C 31B 30C 18B 18B B 30B 18D 18D 30C Meters ,000 1,500 18C 15A Notch Rd C Birch Rd 66B 14B North Rd South Rd 0 1,000 2,000 4,000 6, C 67C 13E 14B Feet 66B 124C 14A 13B 13E 58C 57B 124D Mountain Rd 56B 58D Mendon View Dr D 130D 130E E E D 129F C 124D 124D D 128E ' 23'' ' 26'' ' 56'' 43 36' 22''
25
26
27
28
29
30
31
32
33
34
35 Combo Pond Soils 13B Hinckley A % 13E Hinckley A % 14A Sudbury B % 14B Sudbury B % 15A Walpole C % 18B Windsor A % 18C Windsor A % 18D Windsor A % 23 Adrian D % 24 Pinnebog D % 30B Paxton C % 30C Paxton C % 31B Paxton C % 31C Paxton C % 31D Paxton C % 39B Galway- C % 56B Colton- A % 56C Colton- A % 57B Duxbury- B % 58C Colton- A % 58D Colton- A % 66B Georgia C % 67B Georgia C % 67C Georgia C % 86 Linwood D % 95 Udorthent % 96 Udipsamm % 124C Sunapee B % 124D Sunapee B % 128C Rawsonvill C % 128D Rawsonvill C % 128E Rawsonvill C % 129F Killington- D % 130D Tunbridge- C % 130E Tunbridge- C % 131E Lyman- D % W Water W % Totals for Area of Interest 1, %
36 Resulting Total Soil Class Acres % of Total "Other" distrbuted by weight (ac) with "Other" added in (ac) % A % % B % % C % % D % % W % % Total % % Other Grand Total
37 ComboPond_cjk Prepared by Dubois & King, Inc. HydroCAD 9.10 s/n HydroCAD Software Solutions LLC Type II 24-hr 2-yr Rainfall=2.49" Printed 12/18/2011 Page 1 Summary for Subcatchment 3S: Drainage Area MTM EDITS Runoff = hrs, Volume= af, Depth= 0.27" Runoff by SCS TR-20 method, UH=SCS, Time Span= hrs, dt= 0.05 hrs Type II 24-hr 2-yr Rainfall=2.49" Area (ac) CN Description Water Surface, HSG C * /2 acre lots, 25% imp, HSG C /2 acre lots, 25% imp, HSG B /2 acre lots, 25% imp, HSG B /2 acre lots, 25% imp, HSG D /2 acre lots, 25% imp, HSG D /2 acre lots, 25% imp, HSG D Woods/grass comb., Good, HSG B Woods, Good, HSG B Woods, Good, HSG B Woods/grass comb., Good, HSG A * Woods, Good, HSG C Woods, Good, HSG D 1, Weighted Average % Pervious Area % Impervious Area Tc Length Slope Velocity Capacity Description (min) (feet) (ft/ft) (ft/sec) (cfs) Sheet Flow, Woods: Dense underbrush n= P2= 2.49" Shallow Concentrated Flow, Forest w/heavy Litter Kv= 2.5 fps , Channel Flow, Area= 6.3 sf Perim= 9.4' r= 0.67' n= , Channel Flow, Area= 13.7 sf Perim= 15.5' r= 0.88' n= ,162 Total Summary for Pond 2P: ComboPond Inflow Area = 1, ac, 10.27% Impervious, Inflow Depth = 0.27" for 2-yr event Inflow = hrs, Volume= af Outflow = hrs, Volume= af, Atten= 5%, Lag= 34.9 min Primary = hrs, Volume= af Secondary = hrs, Volume= af Routing by Stor-Ind method, Time Span= hrs, dt= 0.05 hrs Starting Elev= ' Surf.Area= 105,368 sf Storage= 460,310 cf Peak Elev= hrs Surf.Area= 121,796 sf Storage= 550,101 cf (89,791 cf above start) Flood Elev= ' Surf.Area= 178,281 sf Storage= 806,486 cf (346,176 cf above start) Plug-Flow detention time= min calculated for af (55% of inflow)
38 ComboPond_cjk Prepared by Dubois & King, Inc. HydroCAD 9.10 s/n HydroCAD Software Solutions LLC Type II 24-hr 2-yr Rainfall=2.49" Printed 12/18/2011 Page 2 Center-of-Mass det. time= 50.1 min ( 1, ,121.5 ) Volume Invert Avail.Storage Storage Description # ' 1,957,676 cf Custom Stage Data (Prismatic)Listed below (Recalc) Elevation Surf.Area Inc.Store Cum.Store (feet) (sq-ft) (cubic-feet) (cubic-feet) , ,689 29,579 29, ,120 68,809 98, , , , , , , , , , , , , , ,042 1,324, , ,174 1,957,676 Device Routing Invert Outlet Devices #1 Primary ' 36.0" Round Culvert L= 80.0' CMP, square edge headwall, Ke= Inlet / Outlet Invert= ' / ' S= '/' Cc= n= Corrugated metal #2 Device ' 48.0" x 48.0" Horiz. Orifice/Grate C= Limited to weir flow at low heads #3 Device ' 48.0" x 94.0" Horiz. Orifice/Grate X 0.50 C= Limited to weir flow at low heads #4 Secondary ' BCWeir - Top of Dam, Cv= 2.10 (C= 2.63) Head (feet) Width (feet) Primary OutFlow Max= hrs HW=647.99' (Free Discharge) 1=Culvert (Passes cfs of cfs potential flow) 2=Orifice/Grate (Weir Controls fps) 3=Orifice/Grate ( Controls 0.00 cfs) Secondary OutFlow Max= hrs HW=647.20' (Free Discharge) 4=BCWeir - Top of Dam ( Controls 0.00 cfs)
39 ComboPond_cjk Prepared by Dubois & King, Inc. HydroCAD 9.10 s/n HydroCAD Software Solutions LLC Type II 24-hr 10-yr Rainfall=3.58" Printed 12/18/2011 Page 3 Summary for Subcatchment 3S: Drainage Area MTM EDITS Runoff = hrs, Volume= af, Depth= 0.75" Runoff by SCS TR-20 method, UH=SCS, Time Span= hrs, dt= 0.05 hrs Type II 24-hr 10-yr Rainfall=3.58" Area (ac) CN Description Water Surface, HSG C * /2 acre lots, 25% imp, HSG C /2 acre lots, 25% imp, HSG B /2 acre lots, 25% imp, HSG B /2 acre lots, 25% imp, HSG D /2 acre lots, 25% imp, HSG D /2 acre lots, 25% imp, HSG D Woods/grass comb., Good, HSG B Woods, Good, HSG B Woods, Good, HSG B Woods/grass comb., Good, HSG A * Woods, Good, HSG C Woods, Good, HSG D 1, Weighted Average % Pervious Area % Impervious Area Tc Length Slope Velocity Capacity Description (min) (feet) (ft/ft) (ft/sec) (cfs) Sheet Flow, Woods: Dense underbrush n= P2= 2.49" Shallow Concentrated Flow, Forest w/heavy Litter Kv= 2.5 fps , Channel Flow, Area= 6.3 sf Perim= 9.4' r= 0.67' n= , Channel Flow, Area= 13.7 sf Perim= 15.5' r= 0.88' n= ,162 Total Summary for Pond 2P: ComboPond Inflow Area = 1, ac, 10.27% Impervious, Inflow Depth = 0.75" for 10-yr event Inflow = hrs, Volume= af Outflow = hrs, Volume= af, Atten= 23%, Lag= 75.8 min Primary = hrs, Volume= af Secondary = hrs, Volume= af Routing by Stor-Ind method, Time Span= hrs, dt= 0.05 hrs Starting Elev= ' Surf.Area= 105,368 sf Storage= 460,310 cf Peak Elev= hrs Surf.Area= 177,213 sf Storage= 800,752 cf (340,442 cf above start) Flood Elev= ' Surf.Area= 178,281 sf Storage= 806,486 cf (346,176 cf above start) Plug-Flow detention time= min calculated for af (84% of inflow)
40 ComboPond_cjk Prepared by Dubois & King, Inc. HydroCAD 9.10 s/n HydroCAD Software Solutions LLC Type II 24-hr 10-yr Rainfall=3.58" Printed 12/18/2011 Page 4 Center-of-Mass det. time= 44.5 min ( 1, ,076.1 ) Volume Invert Avail.Storage Storage Description # ' 1,957,676 cf Custom Stage Data (Prismatic)Listed below (Recalc) Elevation Surf.Area Inc.Store Cum.Store (feet) (sq-ft) (cubic-feet) (cubic-feet) , ,689 29,579 29, ,120 68,809 98, , , , , , , , , , , , , , ,042 1,324, , ,174 1,957,676 Device Routing Invert Outlet Devices #1 Primary ' 36.0" Round Culvert L= 80.0' CMP, square edge headwall, Ke= Inlet / Outlet Invert= ' / ' S= '/' Cc= n= Corrugated metal #2 Device ' 48.0" x 48.0" Horiz. Orifice/Grate C= Limited to weir flow at low heads #3 Device ' 48.0" x 94.0" Horiz. Orifice/Grate X 0.50 C= Limited to weir flow at low heads #4 Secondary ' BCWeir - Top of Dam, Cv= 2.10 (C= 2.63) Head (feet) Width (feet) Primary OutFlow Max= hrs HW=649.67' (Free Discharge) 1=Culvert (Barrel Controls fps) 2=Orifice/Grate (Passes < cfs potential flow) 3=Orifice/Grate (Passes < cfs potential flow) Secondary OutFlow Max= hrs HW=647.20' (Free Discharge) 4=BCWeir - Top of Dam ( Controls 0.00 cfs)
41 ComboPond_cjk Prepared by Dubois & King, Inc. HydroCAD 9.10 s/n HydroCAD Software Solutions LLC Type II 24-hr 25-yr Rainfall=4.41" Printed 12/18/2011 Page 5 Summary for Subcatchment 3S: Drainage Area MTM EDITS Runoff = hrs, Volume= af, Depth= 1.21" Runoff by SCS TR-20 method, UH=SCS, Time Span= hrs, dt= 0.05 hrs Type II 24-hr 25-yr Rainfall=4.41" Area (ac) CN Description Water Surface, HSG C * /2 acre lots, 25% imp, HSG C /2 acre lots, 25% imp, HSG B /2 acre lots, 25% imp, HSG B /2 acre lots, 25% imp, HSG D /2 acre lots, 25% imp, HSG D /2 acre lots, 25% imp, HSG D Woods/grass comb., Good, HSG B Woods, Good, HSG B Woods, Good, HSG B Woods/grass comb., Good, HSG A * Woods, Good, HSG C Woods, Good, HSG D 1, Weighted Average % Pervious Area % Impervious Area Tc Length Slope Velocity Capacity Description (min) (feet) (ft/ft) (ft/sec) (cfs) Sheet Flow, Woods: Dense underbrush n= P2= 2.49" Shallow Concentrated Flow, Forest w/heavy Litter Kv= 2.5 fps , Channel Flow, Area= 6.3 sf Perim= 9.4' r= 0.67' n= , Channel Flow, Area= 13.7 sf Perim= 15.5' r= 0.88' n= ,162 Total Summary for Pond 2P: ComboPond Inflow Area = 1, ac, 10.27% Impervious, Inflow Depth = 1.21" for 25-yr event Inflow = hrs, Volume= af Outflow = hrs, Volume= af, Atten= 2%, Lag= 21.0 min Primary = hrs, Volume= af Secondary = hrs, Volume= af Routing by Stor-Ind method, Time Span= hrs, dt= 0.05 hrs Starting Elev= ' Surf.Area= 105,368 sf Storage= 460,310 cf Peak Elev= hrs Surf.Area= 202,699 sf Storage= 926,833 cf (466,523 cf above start) Flood Elev= ' Surf.Area= 178,281 sf Storage= 806,486 cf (346,176 cf above start) Plug-Flow detention time= min calculated for af (90% of inflow)
42 ComboPond_cjk Prepared by Dubois & King, Inc. HydroCAD 9.10 s/n HydroCAD Software Solutions LLC Type II 24-hr 25-yr Rainfall=4.41" Printed 12/18/2011 Page 6 Center-of-Mass det. time= 42.9 min ( 1, ,059.0 ) Volume Invert Avail.Storage Storage Description # ' 1,957,676 cf Custom Stage Data (Prismatic)Listed below (Recalc) Elevation Surf.Area Inc.Store Cum.Store (feet) (sq-ft) (cubic-feet) (cubic-feet) , ,689 29,579 29, ,120 68,809 98, , , , , , , , , , , , , , ,042 1,324, , ,174 1,957,676 Device Routing Invert Outlet Devices #1 Primary ' 36.0" Round Culvert L= 80.0' CMP, square edge headwall, Ke= Inlet / Outlet Invert= ' / ' S= '/' Cc= n= Corrugated metal #2 Device ' 48.0" x 48.0" Horiz. Orifice/Grate C= Limited to weir flow at low heads #3 Device ' 48.0" x 94.0" Horiz. Orifice/Grate X 0.50 C= Limited to weir flow at low heads #4 Secondary ' BCWeir - Top of Dam, Cv= 2.10 (C= 2.63) Head (feet) Width (feet) Primary OutFlow Max= hrs HW=650.33' (Free Discharge) 1=Culvert (Barrel Controls fps) 2=Orifice/Grate (Passes < cfs potential flow) 3=Orifice/Grate (Passes < cfs potential flow) Secondary OutFlow Max= hrs HW=650.33' (Free Discharge) 4=BCWeir - Top of Dam (Weir Controls fps)
43 ComboPond_cjk Prepared by Dubois & King, Inc. HydroCAD 9.10 s/n HydroCAD Software Solutions LLC Type II 24-hr 50-yr Rainfall=5.17" Printed 12/18/2011 Page 7 Summary for Subcatchment 3S: Drainage Area MTM EDITS Runoff = hrs, Volume= af, Depth= 1.69" Runoff by SCS TR-20 method, UH=SCS, Time Span= hrs, dt= 0.05 hrs Type II 24-hr 50-yr Rainfall=5.17" Area (ac) CN Description Water Surface, HSG C * /2 acre lots, 25% imp, HSG C /2 acre lots, 25% imp, HSG B /2 acre lots, 25% imp, HSG B /2 acre lots, 25% imp, HSG D /2 acre lots, 25% imp, HSG D /2 acre lots, 25% imp, HSG D Woods/grass comb., Good, HSG B Woods, Good, HSG B Woods, Good, HSG B Woods/grass comb., Good, HSG A * Woods, Good, HSG C Woods, Good, HSG D 1, Weighted Average % Pervious Area % Impervious Area Tc Length Slope Velocity Capacity Description (min) (feet) (ft/ft) (ft/sec) (cfs) Sheet Flow, Woods: Dense underbrush n= P2= 2.49" Shallow Concentrated Flow, Forest w/heavy Litter Kv= 2.5 fps , Channel Flow, Area= 6.3 sf Perim= 9.4' r= 0.67' n= , Channel Flow, Area= 13.7 sf Perim= 15.5' r= 0.88' n= ,162 Total Summary for Pond 2P: ComboPond Inflow Area = 1, ac, 10.27% Impervious, Inflow Depth = 1.69" for 50-yr event Inflow = hrs, Volume= af Outflow = hrs, Volume= af, Atten= 1%, Lag= 9.4 min Primary = hrs, Volume= af Secondary = hrs, Volume= af Routing by Stor-Ind method, Time Span= hrs, dt= 0.05 hrs Starting Elev= ' Surf.Area= 105,368 sf Storage= 460,310 cf Peak Elev= hrs Surf.Area= 213,028 sf Storage= 976,410 cf (516,100 cf above start) Flood Elev= ' Surf.Area= 178,281 sf Storage= 806,486 cf (346,176 cf above start) Plug-Flow detention time= 98.1 min calculated for af (93% of inflow)
44 ComboPond_cjk Prepared by Dubois & King, Inc. HydroCAD 9.10 s/n HydroCAD Software Solutions LLC Type II 24-hr 50-yr Rainfall=5.17" Printed 12/18/2011 Page 8 Center-of-Mass det. time= 37.9 min ( 1, ,048.3 ) Volume Invert Avail.Storage Storage Description # ' 1,957,676 cf Custom Stage Data (Prismatic)Listed below (Recalc) Elevation Surf.Area Inc.Store Cum.Store (feet) (sq-ft) (cubic-feet) (cubic-feet) , ,689 29,579 29, ,120 68,809 98, , , , , , , , , , , , , , ,042 1,324, , ,174 1,957,676 Device Routing Invert Outlet Devices #1 Primary ' 36.0" Round Culvert L= 80.0' CMP, square edge headwall, Ke= Inlet / Outlet Invert= ' / ' S= '/' Cc= n= Corrugated metal #2 Device ' 48.0" x 48.0" Horiz. Orifice/Grate C= Limited to weir flow at low heads #3 Device ' 48.0" x 94.0" Horiz. Orifice/Grate X 0.50 C= Limited to weir flow at low heads #4 Secondary ' BCWeir - Top of Dam, Cv= 2.10 (C= 2.63) Head (feet) Width (feet) Primary OutFlow Max= hrs HW=650.57' (Free Discharge) 1=Culvert (Barrel Controls fps) 2=Orifice/Grate (Passes < cfs potential flow) 3=Orifice/Grate (Passes < cfs potential flow) Secondary OutFlow Max= hrs HW=650.57' (Free Discharge) 4=BCWeir - Top of Dam (Weir Controls fps)
45 ComboPond_cjk Type II 24-hr 100.yr Rainfall=6.05" Prepared by Dubois & King, Inc. Printed 12/18/2011 HydroCAD 9.10 s/n HydroCAD Software Solutions LLC Page 9 Summary for Subcatchment 3S: Drainage Area MTM EDITS Runoff = hrs, Volume= af, Depth= 2.30" Runoff by SCS TR-20 method, UH=SCS, Time Span= hrs, dt= 0.05 hrs Type II 24-hr 100.yr Rainfall=6.05" Area (ac) CN Description Water Surface, HSG C * /2 acre lots, 25% imp, HSG C /2 acre lots, 25% imp, HSG B /2 acre lots, 25% imp, HSG B /2 acre lots, 25% imp, HSG D /2 acre lots, 25% imp, HSG D /2 acre lots, 25% imp, HSG D Woods/grass comb., Good, HSG B Woods, Good, HSG B Woods, Good, HSG B Woods/grass comb., Good, HSG A * Woods, Good, HSG C Woods, Good, HSG D 1, Weighted Average % Pervious Area % Impervious Area Tc Length Slope Velocity Capacity Description (min) (feet) (ft/ft) (ft/sec) (cfs) Sheet Flow, Woods: Dense underbrush n= P2= 2.49" Shallow Concentrated Flow, Forest w/heavy Litter Kv= 2.5 fps , Channel Flow, Area= 6.3 sf Perim= 9.4' r= 0.67' n= , Channel Flow, Area= 13.7 sf Perim= 15.5' r= 0.88' n= ,162 Total Summary for Pond 2P: ComboPond Inflow Area = 1, ac, 10.27% Impervious, Inflow Depth = 2.30" for 100.yr event Inflow = hrs, Volume= af Outflow = hrs, Volume= af, Atten= 0%, Lag= 5.5 min Primary = hrs, Volume= af Secondary = hrs, Volume= af Routing by Stor-Ind method, Time Span= hrs, dt= 0.05 hrs Starting Elev= ' Surf.Area= 105,368 sf Storage= 460,310 cf Peak Elev= hrs Surf.Area= 223,132 sf Storage= 1,027,294 cf (566,984 cf above start) Flood Elev= ' Surf.Area= 178,281 sf Storage= 806,486 cf (346,176 cf above start) Plug-Flow detention time= 78.6 min calculated for af (95% of inflow)
46 ComboPond_cjk Type II 24-hr 100.yr Rainfall=6.05" Prepared by Dubois & King, Inc. Printed 12/18/2011 HydroCAD 9.10 s/n HydroCAD Software Solutions LLC Page 10 Center-of-Mass det. time= 33.4 min ( 1, ,039.0 ) Volume Invert Avail.Storage Storage Description # ' 1,957,676 cf Custom Stage Data (Prismatic)Listed below (Recalc) Elevation Surf.Area Inc.Store Cum.Store (feet) (sq-ft) (cubic-feet) (cubic-feet) , ,689 29,579 29, ,120 68,809 98, , , , , , , , , , , , , , ,042 1,324, , ,174 1,957,676 Device Routing Invert Outlet Devices #1 Primary ' 36.0" Round Culvert L= 80.0' CMP, square edge headwall, Ke= Inlet / Outlet Invert= ' / ' S= '/' Cc= n= Corrugated metal #2 Device ' 48.0" x 48.0" Horiz. Orifice/Grate C= Limited to weir flow at low heads #3 Device ' 48.0" x 94.0" Horiz. Orifice/Grate X 0.50 C= Limited to weir flow at low heads #4 Secondary ' BCWeir - Top of Dam, Cv= 2.10 (C= 2.63) Head (feet) Width (feet) Primary OutFlow Max= hrs HW=650.81' (Free Discharge) 1=Culvert (Barrel Controls fps) 2=Orifice/Grate (Passes < cfs potential flow) 3=Orifice/Grate (Passes < cfs potential flow) Secondary OutFlow Max= hrs HW=650.81' (Free Discharge) 4=BCWeir - Top of Dam (Weir Controls fps)
47 ComboPond_cjk D&K M-VT PMP 24-hr 1/4 PMP Rainfall=7.00" Prepared by Dubois & King, Inc. Printed 2/23/2012 HydroCAD s/n HydroCAD Software Solutions LLC Page 13 Summary for Subcatchment 3S: Drainage Area MTM EDITS 1. Shallow conc and channel lengths increased 25%, and slopes adjusted correspondingly. 2. CNs for C soils shifted 1/2 way to B values. Runoff = hrs, Volume= af, Depth= 3.00" Runoff by SCS TR-20 method, UH=SCS, Time Span= hrs, dt= 0.05 hrs D&K M-VT PMP 24-hr 1/4 PMP Rainfall=7.00" Area (ac) CN Description Water Surface, HSG C * /2 acre lots, 25% imp, HSG C /2 acre lots, 25% imp, HSG B /2 acre lots, 25% imp, HSG B /2 acre lots, 25% imp, HSG D /2 acre lots, 25% imp, HSG D /2 acre lots, 25% imp, HSG D Woods/grass comb., Good, HSG B Woods, Good, HSG B Woods, Good, HSG B Woods/grass comb., Good, HSG A * Woods, Good, HSG C Woods, Good, HSG D 1, Weighted Average % Pervious Area % Impervious Area Tc Length Slope Velocity Capacity Description (min) (feet) (ft/ft) (ft/sec) (cfs) Sheet Flow, Woods: Dense underbrush n= P2= 2.49" Shallow Concentrated Flow, Forest w/heavy Litter Kv= 2.5 fps , Channel Flow, Area= 6.3 sf Perim= 9.4' r= 0.67' n= , Channel Flow, Area= 13.7 sf Perim= 15.5' r= 0.88' n= ,162 Total
48 ComboPond_cjk D&K M-VT PMP 24-hr 1/4 PMP Rainfall=7.00" Prepared by Dubois & King, Inc. Printed 2/23/2012 HydroCAD s/n HydroCAD Software Solutions LLC Page 14 Summary for Pond 2P: ComboPond Existing Inflow Area = 1, ac, 10.27% Impervious, Inflow Depth = 3.00" for 1/4 PMP event Inflow = hrs, Volume= af Outflow = hrs, Volume= af, Atten= 0%, Lag= 2.8 min Primary = hrs, Volume= af Secondary = hrs, Volume= af Routing by Stor-Ind method, Time Span= hrs, dt= 0.05 hrs Starting Elev= ' Surf.Area= 105,368 sf Storage= 460,310 cf Peak Elev= hrs Surf.Area= 235,795 sf Storage= 1,094,387 cf (634,077 cf above start) Flood Elev= ' Surf.Area= 178,281 sf Storage= 806,486 cf (346,176 cf above start) Plug-Flow detention time= 60.9 min calculated for af (96% of inflow) Center-of-Mass det. time= 27.2 min ( 1, ,023.1 ) Volume Invert Avail.Storage Storage Description # ' 1,957,676 cf Custom Stage Data (Prismatic)Listed below (Recalc) Elevation Surf.Area Inc.Store Cum.Store (feet) (sq-ft) (cubic-feet) (cubic-feet) , ,689 29,579 29, ,120 68,809 98, , , , , , , , , , , , , , ,042 1,324, , ,174 1,957,676 Device Routing Invert Outlet Devices #1 Primary ' 36.0" Round Culvert L= 80.0' CMP, square edge headwall, Ke= Inlet / Outlet Invert= ' / ' S= '/' Cc= n= Corrugated metal, Flow Area= 7.07 sf #2 Device ' 48.0" x 48.0" Horiz. Orifice/Grate C= Limited to weir flow at low heads #3 Device ' 36.0" x 84.0" Horiz. Orifice/Grate X 0.50 C= Limited to weir flow at low heads #4 Secondary ' BCWeir - Top of Dam, Cv= 2.10 (C= 2.63) Head (feet) Width (feet) Primary OutFlow Max= hrs HW=651.10' (Free Discharge) 1=Culvert (Barrel Controls fps) 2=Orifice/Grate (Passes < cfs potential flow) 3=Orifice/Grate (Passes < cfs potential flow) Secondary OutFlow Max= hrs HW=651.10' (Free Discharge) 4=BCWeir - Top of Dam (Weir Controls fps)
49 ComboPond_cjk D&K M-VT PMP 24-hr 1/2 PMP Rainfall=14.00" Prepared by Dubois & King, Inc. Printed 2/23/2012 HydroCAD s/n HydroCAD Software Solutions LLC Page 11 Summary for Subcatchment 3S: Drainage Area MTM EDITS 1. Shallow conc and channel lengths increased 25%, and slopes adjusted correspondingly. 2. CNs for C soils shifted 1/2 way to B values. Runoff = 2, hrs, Volume= af, Depth= 8.96" Runoff by SCS TR-20 method, UH=SCS, Time Span= hrs, dt= 0.05 hrs D&K M-VT PMP 24-hr 1/2 PMP Rainfall=14.00" Area (ac) CN Description Water Surface, HSG C * /2 acre lots, 25% imp, HSG C /2 acre lots, 25% imp, HSG B /2 acre lots, 25% imp, HSG B /2 acre lots, 25% imp, HSG D /2 acre lots, 25% imp, HSG D /2 acre lots, 25% imp, HSG D Woods/grass comb., Good, HSG B Woods, Good, HSG B Woods, Good, HSG B Woods/grass comb., Good, HSG A * Woods, Good, HSG C Woods, Good, HSG D 1, Weighted Average % Pervious Area % Impervious Area Tc Length Slope Velocity Capacity Description (min) (feet) (ft/ft) (ft/sec) (cfs) Sheet Flow, Woods: Dense underbrush n= P2= 2.49" Shallow Concentrated Flow, Forest w/heavy Litter Kv= 2.5 fps , Channel Flow, Area= 6.3 sf Perim= 9.4' r= 0.67' n= , Channel Flow, Area= 13.7 sf Perim= 15.5' r= 0.88' n= ,162 Total
50 ComboPond_cjk D&K M-VT PMP 24-hr 1/2 PMP Rainfall=14.00" Prepared by Dubois & King, Inc. Printed 2/23/2012 HydroCAD s/n HydroCAD Software Solutions LLC Page 12 Summary for Pond 2P: ComboPond Existing Inflow Area = 1, ac, 10.27% Impervious, Inflow Depth = 8.96" for 1/2 PMP event Inflow = 2, hrs, Volume= af Outflow = 2, hrs, Volume= af, Atten= 0%, Lag= 4.0 min Primary = hrs, Volume= af Secondary = 2, hrs, Volume= af Routing by Stor-Ind method, Time Span= hrs, dt= 0.05 hrs Starting Elev= ' Surf.Area= 105,368 sf Storage= 460,310 cf Peak Elev= hrs Surf.Area= 285,649 sf Storage= 1,397,122 cf (936,812 cf above start) Flood Elev= ' Surf.Area= 178,281 sf Storage= 806,486 cf (346,176 cf above start) Plug-Flow detention time= 28.8 min calculated for af (99% of inflow) Center-of-Mass det. time= 15.3 min ( 1, ) Volume Invert Avail.Storage Storage Description # ' 1,957,676 cf Custom Stage Data (Prismatic)Listed below (Recalc) Elevation Surf.Area Inc.Store Cum.Store (feet) (sq-ft) (cubic-feet) (cubic-feet) , ,689 29,579 29, ,120 68,809 98, , , , , , , , , , , , , , ,042 1,324, , ,174 1,957,676 Device Routing Invert Outlet Devices #1 Primary ' 36.0" Round Culvert L= 80.0' CMP, square edge headwall, Ke= Inlet / Outlet Invert= ' / ' S= '/' Cc= n= Corrugated metal, Flow Area= 7.07 sf #2 Device ' 48.0" x 48.0" Horiz. Orifice/Grate C= Limited to weir flow at low heads #3 Device ' 36.0" x 84.0" Horiz. Orifice/Grate X 0.50 C= Limited to weir flow at low heads #4 Secondary ' BCWeir - Top of Dam, Cv= 2.10 (C= 2.63) Head (feet) Width (feet) Primary OutFlow Max= hrs HW=652.26' (Free Discharge) 1=Culvert (Barrel Controls fps) 2=Orifice/Grate (Passes < cfs potential flow) 3=Orifice/Grate (Passes < cfs potential flow) Secondary OutFlow Max=2, hrs HW=652.26' (Free Discharge) 4=BCWeir - Top of Dam (Weir Controls 2, fps)
51 ComboPond_cjk D&K M-VT PMP 24-hr Full PMP Rainfall=28.00" Prepared by Dubois & King, Inc. Printed 2/23/2012 HydroCAD s/n HydroCAD Software Solutions LLC Page 15 Summary for Subcatchment 3S: Drainage Area MTM EDITS 1. Shallow conc and channel lengths increased 25%, and slopes adjusted correspondingly. 2. CNs for C soils shifted 1/2 way to B values. Runoff = 5, hrs, Volume= 1, af, Depth=22.22" Runoff by SCS TR-20 method, UH=SCS, Time Span= hrs, dt= 0.05 hrs D&K M-VT PMP 24-hr Full PMP Rainfall=28.00" Area (ac) CN Description Water Surface, HSG C * /2 acre lots, 25% imp, HSG C /2 acre lots, 25% imp, HSG B /2 acre lots, 25% imp, HSG B /2 acre lots, 25% imp, HSG D /2 acre lots, 25% imp, HSG D /2 acre lots, 25% imp, HSG D Woods/grass comb., Good, HSG B Woods, Good, HSG B Woods, Good, HSG B Woods/grass comb., Good, HSG A * Woods, Good, HSG C Woods, Good, HSG D 1, Weighted Average % Pervious Area % Impervious Area Tc Length Slope Velocity Capacity Description (min) (feet) (ft/ft) (ft/sec) (cfs) Sheet Flow, Woods: Dense underbrush n= P2= 2.49" Shallow Concentrated Flow, Forest w/heavy Litter Kv= 2.5 fps , Channel Flow, Area= 6.3 sf Perim= 9.4' r= 0.67' n= , Channel Flow, Area= 13.7 sf Perim= 15.5' r= 0.88' n= ,162 Total
52 ComboPond_cjk D&K M-VT PMP 24-hr Full PMP Rainfall=28.00" Prepared by Dubois & King, Inc. Printed 2/23/2012 HydroCAD s/n HydroCAD Software Solutions LLC Page 16 Summary for Pond 2P: ComboPond Existing Inflow Area = 1, ac, 10.27% Impervious, Inflow Depth = 22.22" for Full PMP event Inflow = 5, hrs, Volume= 1, af Outflow = 5, hrs, Volume= 1, af, Atten= 0%, Lag= 1.2 min Primary = hrs, Volume= af Secondary = 5, hrs, Volume= 1, af Routing by Stor-Ind method, Time Span= hrs, dt= 0.05 hrs Starting Elev= ' Surf.Area= 105,368 sf Storage= 460,310 cf Peak Elev= hrs Surf.Area= 346,938 sf Storage= 1,861,335 cf (1,401,025 cf above start) Flood Elev= ' Surf.Area= 178,281 sf Storage= 806,486 cf (346,176 cf above start) Plug-Flow detention time= 16.4 min calculated for 1, af (99% of inflow) Center-of-Mass det. time= 9.4 min ( ) Volume Invert Avail.Storage Storage Description # ' 1,957,676 cf Custom Stage Data (Prismatic)Listed below (Recalc) Elevation Surf.Area Inc.Store Cum.Store (feet) (sq-ft) (cubic-feet) (cubic-feet) , ,689 29,579 29, ,120 68,809 98, , , , , , , , , , , , , , ,042 1,324, , ,174 1,957,676 Device Routing Invert Outlet Devices #1 Primary ' 36.0" Round Culvert L= 80.0' CMP, square edge headwall, Ke= Inlet / Outlet Invert= ' / ' S= '/' Cc= n= Corrugated metal, Flow Area= 7.07 sf #2 Device ' 48.0" x 48.0" Horiz. Orifice/Grate C= Limited to weir flow at low heads #3 Device ' 36.0" x 84.0" Horiz. Orifice/Grate X 0.50 C= Limited to weir flow at low heads #4 Secondary ' BCWeir - Top of Dam, Cv= 2.10 (C= 2.63) Head (feet) Width (feet) Primary OutFlow Max= hrs HW=653.73' (Free Discharge) 1=Culvert (Barrel Controls fps) 2=Orifice/Grate (Passes < cfs potential flow) 3=Orifice/Grate (Passes < cfs potential flow) Secondary OutFlow Max=5, hrs HW=653.73' (Free Discharge) 4=BCWeir - Top of Dam (Weir Controls 5, fps)
 USGS Calculated 100-year Discharge at 138 USGS Stations (Flow-Frequency Characteristics of Vermont Streams:Water-Resources Investigations Report 02-4238)")
53 Combination Pond Dam Computed Peak Flows in the Northeast Vermont-Western New Hampshire- Northwestern Mass.- Eastern New York Peak Flow (cfs/ mi 2 ) Drainage Area (square miles) USGS Calculated 100-year Discharge at 138 USGS Stations (Flow-Frequency Characteristics of Vermont Streams:Water-Resources Investigations Report ) Probable Maximum Flood ( PMF) for Corps of Engineers Facilities in the Northeast 1/2 PMF COE Facilities Combo Pond, Drainage Area = 1.6 square miles, Q100 = 472 cfs Combo Pond, 1/2 PMF = 2116 cfs Combo Pond, Full PMF = 5199 cfs