Anjali Parasnis TERI 2009
|
|
|
- Jesse Butler
- 5 years ago
- Views:
Transcription


1 Anjali Parasnis TERI 2009

2 1. India's overall energy scenario 2. Present status of RE in India 3. Relevance of RE in India why RE 4. RE and climate change 5. Global developments in RE
3
4 C o a l 52% R ES 34% 23% 10,897 MW 29% 10% 1,141 2,944 MW 78% 71% 90% D ie se l 1% Nu cle a r 3% G a s 10% 39,222 MW 7,231 12,000 MW RE S G as Nuc lear Dies el Coal Total installed capacity as on is 150,000.4 MW Other RE Wind Hydro
5 Consumption Primary commercial energy consumption in India Petroleum MMT Natural Gas BCM Coal MMT Year Lignite MMT Electricity (Incl. Non-utilities) Bn.KWH
6 Coal Major energy source. Biomass Primary source of cooking energy in > 80% rural households. Electricity All India average shortage ~ 11.6 % Peak Load supply shortage ~ 15 % Base Load supply shortage ~ 9 % Energy security concern Around 75 % of the petroleum supply is imported Even coal is being imported
7 Poor electrification status 78 million households (44%) in the country do not have access to electricity 1,25,000 villages are un-electrified Electricity supply situation is generally poor in even electrified villages


8 Setting up solar lantern charging stations in villages and distributing charged lanterns to households at a nominal fee Providing lanterns to facilitate and advance ongoing activities such as education, health, livelihoods Identifying and training entrepreneurs to operate the charging stations and provide repair & maintenance services Facilitating creation of energy enterprises on supply and demand side German Day 2009 New Delhi
9 Net Imports Qty.(Tonnes) Value (Rs Crores) Year

10

11 Source: UN Common database, 2005

12 Installed Capacity (MW) % GDP growth 8% GDP growth Source: Planning Commission, 2005

13 T P E S (m to e) % G DP grow th 8% G DP grow th Source: Planning Commission,2005
14
15
16

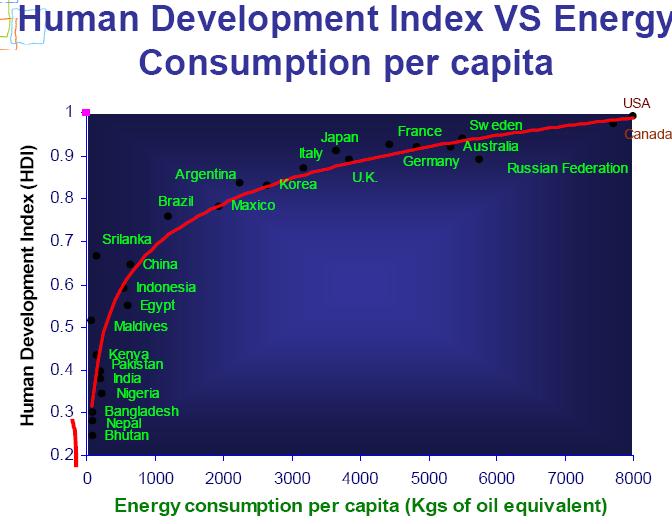
17 India s energy demand is growing, will grow and must grow It has been estimated that by 2031, India s energy needs would be about seven times that of 2001 levels Conventional energy resources will last us so long as they are available an unsustainable choice Need to efficiently and economically meet the energy needs of all the citizens, particularly the rural poor, urgently.
18 The country is already facing constraints in indigenous availability of conventional energy resources be it coal, gas or oil. Government s endeavour for electricity for all by 2012 Per capita electricity consumption: 630 kwh/year To be increased to 1000 kwh/year by 2012.
19 Energy independence At the national level At the village level Energy independence is not only about the risks of fuel supply disruption Energy independence also pertains to fuel price volatility The real risk of volatile energy prices - unpredictable & cause economic activity to decline.
20 Even at village level, use of locally available resources is preferable than using fuels transported from the farflung areas. Renewables are more appropriate as RE resources are diffused and decentralized.
21 Captive power generation Currently 30,000 MW using fossil fuels Industries looking at wind, biomass for captive power generation. Thermal energy Hot air for drying Spices, fish, tea leaves, tobacco, etc. Hot water Leather, dairies, textile, chemicals, etc. Co-generation 15,000 MW potential Sugar, breweries, caustic soda, rice mills, poultry, etc.
22 Sources/Systems Power from Renewables Grid-interactive renewable power Wind Power 45,195 Small Hydro Power (up to 25 MW) 15,000 Cogeneration-bagasse 5,000 Total (in MW) 84,776 Decentralized Energy Systems Family Type Biogas Plant Solar Photovoltaic Programme Solar water Heating Systems Estimated potential 120 lakh 20 MW/Sq.km. 140 million sq.m. collector area
23 Grid-connected Electricity Distributed generation of electricity and heat Rural Industrial, Institutional, commercial and community Sustainable buildings Bio-fuels for transportation
24 Source Potential (MW) Installed Capacity (MW) (March 31, 2008) Wind 45, Biomass power and bagasse co-generation Small Hydro (up to 25 MW) 19, , Solar 2.12 Waste to energy Source: MNRE, 2008
25 S m all H yd ro C o g en erati o n b ag asse 8 % W aste % S o lar P o w er % B io m ass 5 % 17 % W in d 70 % B iom as s W ind S m all Hy dro Cogeneration bagas s e W as te S olar P ower (as on March 31, 2009)
26 Major Government programme targeted at provision of electricity to all by Around 10,000 villages through off-grid RE Solar PV Biomass gasification Small hydro


27 Source Biomass/non- bagasse cogen Biomass gasifier Energy from waste Solar PV Power Plants and Street Lights Capacity 95 MW 99 MW equivalent 26 MW equivalent 7.72 MWp Remote village electrification 3985 villages & 1142 hamlets


28 System Family type biogas plants Solar water heating systems Solar cookers SPV systems Numbers/capacity 4 million 2.30 million sq.m. collector area 0.63 million 110 MWp

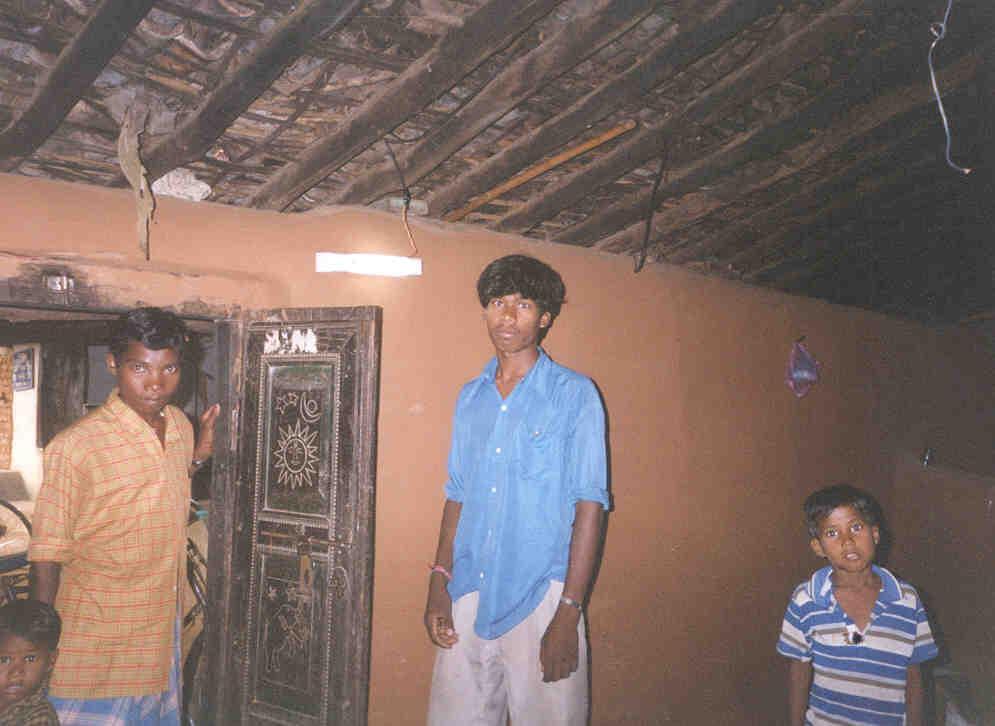
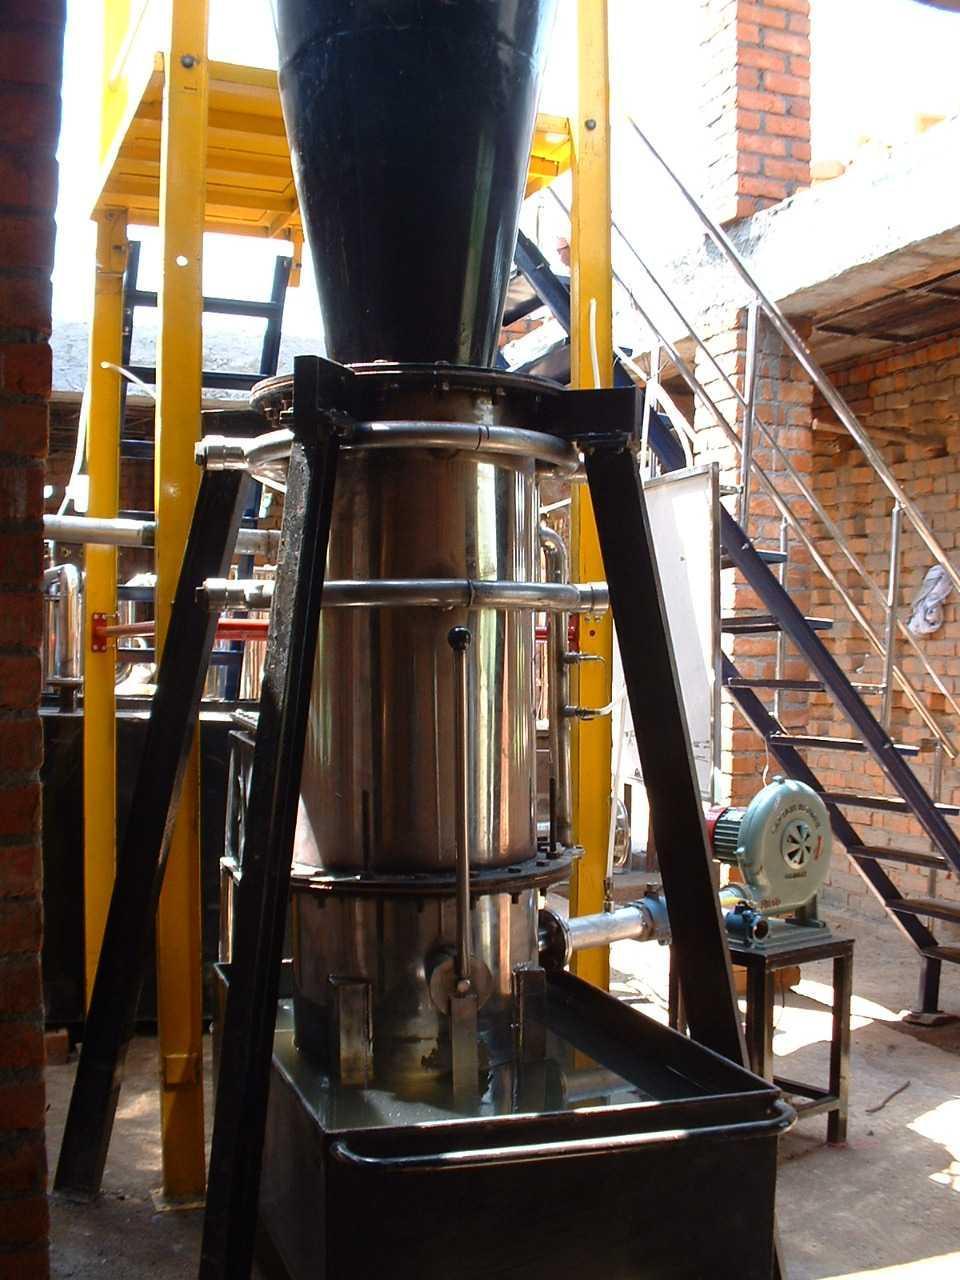
29 Biomass gasifier based electrification of Jemara village, Chhattisgarh
30
31 Solar City Energy efficiency Renewable energy Solar Water Heaters Solar PV Waste to energy/biomass energy Green buildings Indigenous rating system GRIHA Earth air tunnel, solar passive concepts, building integrated SPV, water conservation, waste minimization etc.
 Social benefits Employment in rural areas Modern energy services to rural population Potential to green waste")
32 Large biomass resource base > 600 million tonnes Modern biomass energy technologies Liquid fuels (ethanol, bio-diesel) Gaseous fuels (producer gas, bio gas) Electricity (small-scale using gasification, large-scale using steam route) Social benefits Employment in rural areas Modern energy services to rural population Potential to green waste lands

33

34 Combustion of fossil fuels results in: Global emissions Local emissions These emissions impact the physical and human environment Emissions of GHG are responsible for climate change Emissions like SOx, NOx, and particulate matter are detrimental to human health

35 Scenario BAU Energy efficient (in bil. tonnes)
 Coral bleaching")

36 Climate change impacts that are likely to affect India (some of which we are already seeing) Coral bleaching and extinction of entire coral ecosystems Extreme weather events Retreating Himalayan glaciers affecting rivers


37 Increase in intensity of draughts and precipitation thus affecting food security and water security Increase in frequency of hot days and multiple-day heatwaves; increase in deaths Sea-level rise affecting human and animal habitat New pressures on economic growth, illiteracy and poverty levels
38 All countries taking bold action in promoting and installing RE systems EU: target of 20% energy from renewables by 2020 Australia: target of 20% energy (GWh of electricity) from renewables by 2020 China: 15% RE in energy mix by 2020, 30% or more by 2050 USA: in the process of finalising a 20% target to be achieved by RE (15%) & EE (5%) India needs to be ambitious in setting a target (in terms of GWh, not GW)


39 Most investments are taking place in Wind, Solar and Biofuels India has good resource potential in all three and can develop these fully There is also a need to give other renewables a push ocean energy
40 India s fossil fuel import dependency would reach around 80% by India has abundant renewable energy resources that can contribute towards reduction in dependency on imported fossil fuels. Renewables assume special significance in India considering its geographic diversity, size and distribution of population.
41 India has to chart out a course of action that meets its growing energy needs in a sustainable and environmentally benign fashion. This calls for a paradigm shift From supply domination to an integrated approach A judicious mix of improvements in operational and end-use efficiencies and renewable energy technologies.