Practical Methods for Incorporating Climate Change Uncertainty in Watershed Management Decision-Making
|
|
|
- Marvin Farmer
- 5 years ago
- Views:
Transcription


1 Practical Methods for Incorporating Climate Change Uncertainty in Watershed Management Decision-Making Jason T. Smith, PE, CPESC Study Manager/Civil Engineer St. Paul District Planning Division November 6, 2014 US Army Corps of Engineers
2 Purpose Provide practical and technically sound examples of how some water resource practitioners are accounting for climate change in water management decision making.
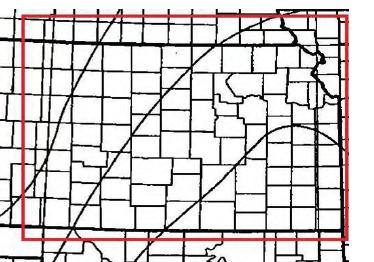
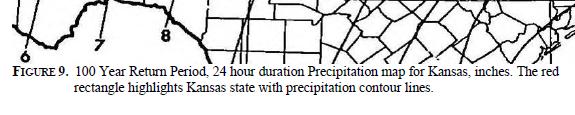
3 Example 1: Variation on Traditional CN Method EPA Kansas River Study: Shift rainfall contours to bracket likely change in precipitation Run new precipitation probabilities in hydrologic model. Ref: Yuan, Y. Qaiser, K. Floodplain Modeling in the Kansas River Basin Using Hydrologic Engineering Center Models. EPA/600/R-11/116 October 2011

4 BUILDING STRONG
5 Example 2: Downscaled Regional Climate Models (Bias Corrected) Iowa-Cedar Watershed - Large Watershed (12,600 sqmi) application using SWAT hydrologic model REF: U of IA NSF Pilot: People, Water, and Climate: Adaptation and Resilience in Agricultural Watersheds
6 IPCC A2 Emissions Scenario Source: narccap.ucar.edu

7 Climate Models: GCM RCM General Circulation Model Regional Climate Model GCM provides boundary conditions NARCCAP provides 11 combos Source: climate4impact.edu

8 Credit Graphic to Lance Le University of Iowa Bias correction from GCM-RCM to climate stations
9 Preliminary Results: Credit Graphic to Lance Le University of Iowa : Monthly averaged streamflow near Wapello Winter Spring Summer Autumn
10 Preliminary Results: Credit Graphic to Lance Le University of Iowa : Streamflow Distributions near Wapello
11 Preliminary Results: Credit Graphic to Lance Le University of Iowa Projected (April-August) Nitrate Loading Distributions at Wapello

12 Preliminary Results: Credit Graphic to Lance Le University of Iowa Mann-Whitney U test p-values Monthly streamflows by season
13 Example 3: Downscaled Regional Climate Models (Counterfactual Adjustment) Indian Creek, Iowa - Smaller Watershed (HUC-10) application using HEC-HMS model REF: IA Cedar Watershed Responses to Climate Change Pilot (Army Corps of Engineers )
14 Moderately Frequent Event Same Precipitation, Different Land Use (26-28 August 2009) 30, % Impervious Watershed 25,000 Flow (cfs) 20,000 15,000 Future Build Out (2020) Current Land Use Historical Land Use (1980) 10,000 5, /26/09 0:00 8/27/09 0:00 8/28/09 0:00 8/29/09 0:00 8/30/09 0:00 8/31/09 0:00 9/1/09 0:00 9/2/09 0:00 Unofficial model results for illustrative purposes only 9/3/09 0:00
15 Annual Precipitation COOP Station (Cedar Rapids No 1) Variability in 30- year sample Annual Precipitation (in) CV (unitless) Total Precipitation Average of 30- year sample Year Total CV 30-Year Average
16 BUILDING STRONG
17 Moderately Frequent Event Different Land Use, Different Precipitation (26-28 August 2009) Flow (cfs) 30,000 25,000 20,000 15,000 10, % impervious watershed, current 25-year storm 2020 land use with potential future 25-year storm Current land use with potential future 25-year storm 2020 land use with current 25-year storm Current land use with current 25-year storm 5, /26/09 0:00 8/27/09 0:00 8/28/09 0:00 8/29/09 0:00 8/30/09 0:00 8/31/09 0:00 9/1/09 0:00 9/2/09 0:00 Unofficial model results for illustrative purposes only 9/3/09 0:00

18 2009 Flood Climate Change Scenario CRCM-CGCM3
19 Remember: Probability Only Half of Risk Formula Risk = Probability * Consequence Probability = how often does it occur Consequence = what do you have to lose A little more uncertainty in probability may not change decision based on level of willingness to bear consequence.


20 Acceptable Future Landuse Plan in Indian Creek? Land Use Proportion for Floodplain Area of Indian Creek Watershed Wetland 7% Water 0.01% Developed 22% Proposed Future Land Use for Floodplain Area of Indian Creek Watershed Wetland 3% Water 0.01% Row Crops 37% Pasture/Hay 11% Forest/Shrubland 15% Row Crops 39% Developed 40% Grassland/ Herbaceous 8% Forest/Shrubland 12% Pasture/Hay 2% Grassland/ Herbaceous 4%

21 Urban Risk Informed Decision Making Is this development acceptable, currently? Future? Who bears the cost associated with this decision? Probability is full of Uncertainty Are stakeholders willing to realize the potential consequence?
22 Conclusions Climate change evaluations can be simple or very complex. When looking at uncertainty of climate change don t lose track of the consequence part of the risk equation Climate Change adds uncertainty but decisions have always been made with limited certainty don t let climate modeling uncertainty paralyze decision-making. 22


23 Questions??? Jason T. Smith, P.E.,CPESC Study Manager / Civil Engineer Jason.T.Smith2@usace.army.mil (309)
24 Parking Lot

25 Credit Graphic to Lance Le University of Iowa Baseline 1: USDA


26 Credit Graphic to Lance Le University of Iowa NLCD: Baseline 2 - National Land Cover Dataset

27 Credit Graphic to Lance Le University of Iowa AGRP: Agricultural Row Crop Production Scenario


28 Credit Graphic to Lance Le University of Iowa WATQ: Perennial Grass Production - Water Quality and Reduced Flooding Scenario


29 Credit Graphic to Lance Le University of Iowa BIOD: Mixed Vegetation Biodiversity Scenario

30 Potential Future Landuse Indian Creek

31 Landuse Change Indian Creek