The Drought of the Century to the Flood of the Century
|
|
|
- Victor Nash
- 5 years ago
- Views:
Transcription
1 The Drought of the Century to the Flood of the Century Julia J. Hunt, P.E., TRA Jerry Cotter, P.E., USACE
2 Trinity River Authority Mission Our mission is to promote conservation, reclamation, protection, and development of the natural resources of the river basin for the benefit of the public.

3 Trinity River Authority

4 TRA Northern Region Operations


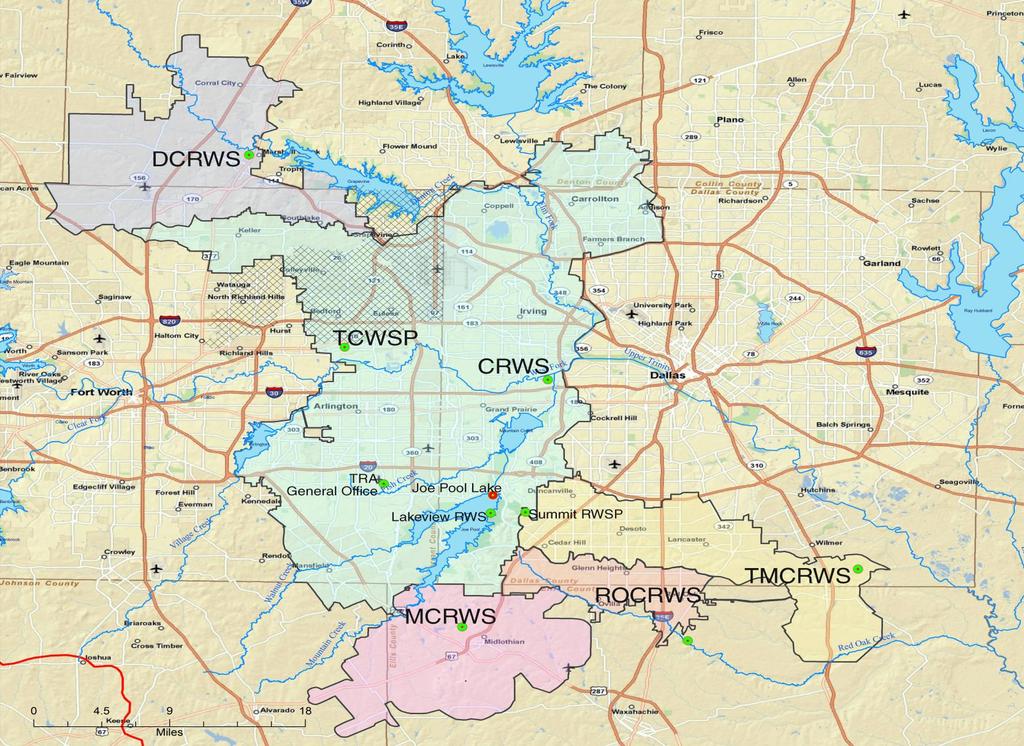
5 Central Regional Wastewater System Service Area Trinity River Basin 114 Lake Lewisville Grapevine Lake 121 Carrollton Contracting Parties Irving Grand Prairie Farmers Branch Dallas Carrollton Arlington Bedford Euless D/FW Airport Mansfield Grapevine Colleyville N. Richland Hills Hurst Coppell Fort Worth Keller Duncanville Cedar Hill Southlake Addison Fort Worth Lake Arlington Keller N. Richland Hills Colleyville Bear Creek Interceptor System Southlake West Fork Interceptor System Bedford Euless Fort Worth Jefferson Tunnel Interceptor System 20 Arlington Mansfield Grapevine D/FW Airport Coppell Dallas Grand Prairie North Lake Irving Elm Fork Interceptor System CRWS Treatment Plant Mountain Creek Lake Mountain Creek Interceptor System Joe Pool Lake Cedar Hill Farmers Branch Dallas Dallas 30 Addison
 1942 Last Cooper (Jim Chapman Reservoir) 1991 8.")
6 Statewide Reservoir Development Background Multi-purpose Flood control, water supply, hydropower, environmental, recreation, navigation Critical to the early development of Texas Significant federal economic contribution Planned/constructed dams 111/32 1 st - Marshall Ford Dam (Lake Travis) 1942 Last Cooper (Jim Chapman Reservoir) M ac-ft conservation storage 20% - 25% surface water supply 15.9 M ac-ft flood storage in 31 federal dams Costs (2013) Construction - $8.2 billion Benefits - $76 billion (flood only) B/C ratio 9.3 Annual recreation visits 22 M San Jacinto
7 Real-Time Operations and FRM Local, state and federal partnership Takes an army Dam safety community Increasing risk = increased staffing levels (SIGNIFICANT!) EM community State and local Real-time operations USGS - sensors, NWS-RFC river forecasts Levees - City of Dallas, TRWD TRA Treatment facilities FRM Local, state and FEMA NCTCOG, Steering Committee, FMTF CDC Program

8 What Do You See? Flood control system $70+ billion benefits $2-3 billion benefits per year Water supply system 6.8 million served Cost = $2.5 billion
9 RESERVOIR ALLOCATIONS Top of Dam Maximum Design Surface Top of Flood Control 15.9 million ac-ft $2-3 billion/yr damages prevented, $76 billion total Freeboard Surcharge Top of Conservation West Fork Trinity TRWD and Whitney 50% Water Supply, Municipal Agricultural Industrial Hydropower Fish & Wildlife, Recreation 8.8 million ac-ft 5.8 ac-ft water supply 20-25% surface water supply Spillway Crest Spillway Crest Top of Inactive Pool Perched Reserve Power Pool SWF locations Sedimentation Pool Low Flow Streambed

10 Plans of Regulation Peak flow vs. volume Follow published plans of regulation for each project Store flood producing runoff to protect downstream areas Uncontrolled areas Project Safety can we store it? Surcharge releases? Forecasts - reservoir managers, surcharge releases Evacuate flood water to prepare for subsequent flooding events Coordinate with other dam operators Retain full conservation pools and additional supplies on a temporary basis to support drought (deviation) Controls
11 May June 2015 Event Ended 2014 in significant drought Whitney (48%C) and TRWD W. Fork Trinity projects well below conservation rainfall across entire upper Trinity River rainfall on Brazos Basin (Waco, Whitney, Aquilla) Sequential events with little opportunity to make releases Few significant single events (Exceptions - Blanco, Clear Creek, West Fork Trinity)
12 Rainfall (inches) Rainfall Frequency Data in Texas is limited to TP 40 and 49 (1960s era analysis) which only analyzed precipitation out to a 10-Day Duration NOAA Atlas 14 update for Texas is in progress. Hendrix, OK is northwest of Lewisville Dam provides a reasonable estimate of what the NOAA Atlas 14 update may look like in North Texas Rainfall Depths NOAA Atlas 14 Rainfall Frequency Estimates Upper Bound of 90% ConfidenceInterval for 1/1000 AEP Curve AEP 1/1000 1/500 1/200 1/100 1/50 1/25 1/10 1/5 1/ Duration (days)

13 Total Rainfall for May-June 2015

14 May 1-5 Ray Roberts I=0.88 in Lewisville I=0.65 in 98 C Lavon I=0.44 in Grapevine I=0.70 in 93 C 15 F 7 F Benbrook I=0.41 in 83 C Joe Pool I=0.35 in 10 F *Pool percent taken on the last day


15 Storm Event May Ray Roberts I=4.36 in C=14.69 in Lewisville I=3.57 in C=11.26 in Grapevine I=3.74 in C=11.18 in 44 F 93 F 74 F Lavon I=3.61 in C=9.62 in 57 F Benbrook I=2.01 in C=7.03 in 11 F Joe Pool I =4.24 in C =8.31 in 51 F *Pool percent taken on the last day


16 Storm Event May Ray Roberts I=4.84 in C=24.27 in Lewisville I=4.38 in C=19.79 in 100 Lavon I=3.12 in C=17.78 in Grapevine I=4.33 in C=18.88 in Benbrook I=3.79 in C=14.26 in 40 F Joe Pool I=6.52 in C=20.08 in 100 *Pool percent taken on the last day
 stored in the 6 projects Ray Roberts I=4.78 in C=29.")

17 Tropical Storm Bill June Million (ac-ft) stored in the 6 projects Ray Roberts I=4.78 in C=29.45 in Lewisville I=4.70 in C=24.86 in Grapevine I=6.46 in C=25.76 in Lavon I=5.07 in C=22.93 in 100 Benbrook I=5.16 in C=19.43 in 100 Joe Pool I=3.03 in C=23.11 in 100 RSR & LOL 70k-80k cfs 10yr 20 yr event *Pool percent taken on the last day
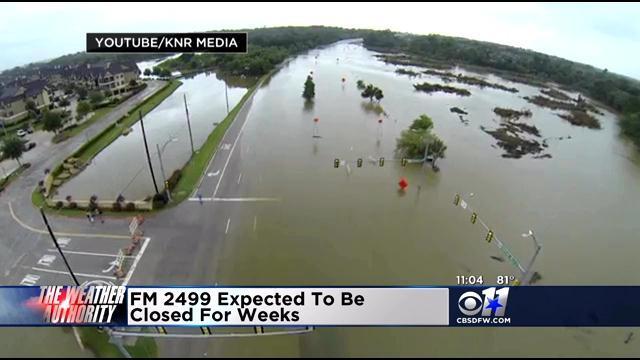
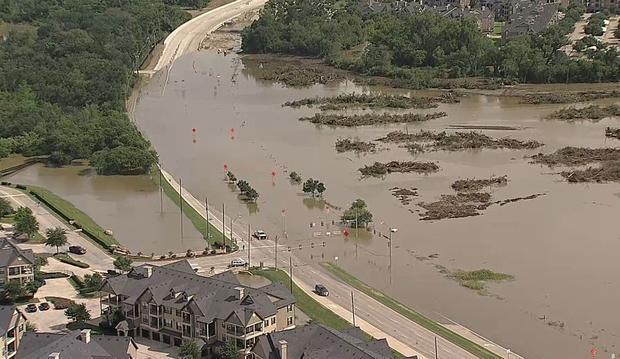

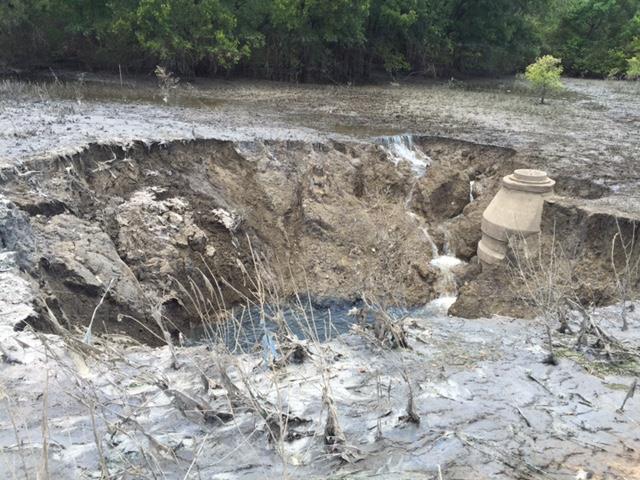
18 Interactions With Infrastructure
19 Damages Prevented Red River Basin Neches River Basin Trinity River Basin Brazos River Basin Guadalupe River Basin Colorado River Basin Total $5.2 million $99.7 million $6.7 billion $173.5 million $59.9 million $23.7 million $7.1 billion
20 CRWS Operational Issues Due to Flooding OSSB was utilized extensively in April, May, and June Influent pumps ran 100% of time during May and June Flows didn t return to normal after rains ended High inorganic loading- biological processes were at risk
21 MGD CRWS Operational Issues Due to Flooding Avg. Flow 2014 Avg. Flow Hr. Peak FY 2015
22 USACE Products Provided to TRA Timing products how long before reservoir releases adjustments propagate through the system Inundation products how much do flows need to be decreased to allow TRA personnel to access the mains (GIS shape files)

23 Using GIS to identify flow

24 Using GIS to identify flow
25 USACE & TRA Collaboration TRA determined what flow reduction would allow access to the pipeline July 17 th TRA and USACE met to discuss options July 20 th TRA submits letter to USACE requesting a 48 hour reduction in discharge July 20 th -23 rd Continue planning for Operation Elm Fork

26 Operation Elm Fork Planning Emergency operations center/staffing Identified resources Field investigation GIS support Office support Supply support/runners
27 Operation Elm Fork Developed supply lists Research safety topics Identified contracted services that were needed (standby) Prepared Maps


28 Inspection Packets
29 Inspection Packets

30 Inspection Packets
31 TRA & USACE Collaboration July 22nd confirmation from the USACE that flows would be reduced beginning July 24 July 26 th CRWS experienced lower influent flows July 27th Operation Elm Fork 8 field teams Walked entire Elm Fork interceptor miles

32
33 OEF-1
34 OEF-2


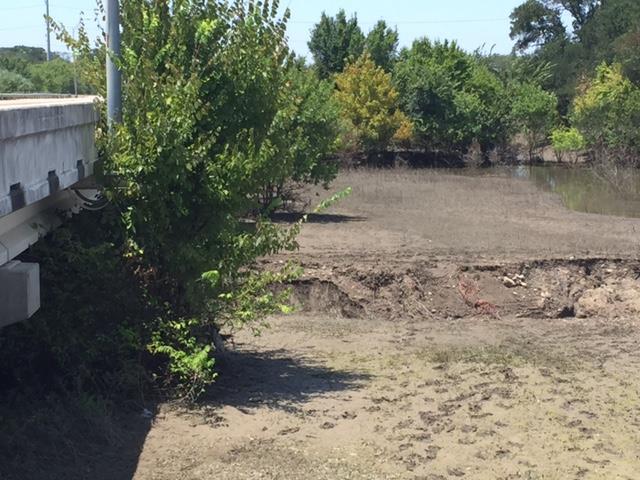
35 Findings from Operation Elm Fork
36 Operation Elm Fork July 28 th - completed temporary repairs July 29 th - USACE increased discharge July 31 st - river level increases to prereduction level Influent flows still down at CRWS
37 Lessons Learned Collaboration Met commitments Improved communications All infrastructure interacts together We have to work together

38 BUILDING STRONG

39 BUILDING STRONG
40 Questions? WEB Sites


41 Lift Station #1 May 24, 2015 and June 1, 2015 Discharge for LS # RCP collapsed Replaced 940 with 60 RCP By-pass pumping, pavement repair Will be abandoned as part of EF-2A project


42 South Fork Fish Creek Interceptor June 14, RCP collapsed South Fork Fish Creek Interceptor By-pass pumping

43 Central Regional Wastewater System Flood related Emergency Repairs