Wanaque Reservoir TMDL and Cumulative WLAs/LA for the Passaic River Watershed
|
|
|
- Job Arnold
- 5 years ago
- Views:
Transcription
1 Wanaque Reservoir TMDL and Cumulative WLAs/LA for the Passaic River Watershed Presented by NJ Department of Environmental Protection Division of Watershed Management Marco Al-Ebus August 4, 2005
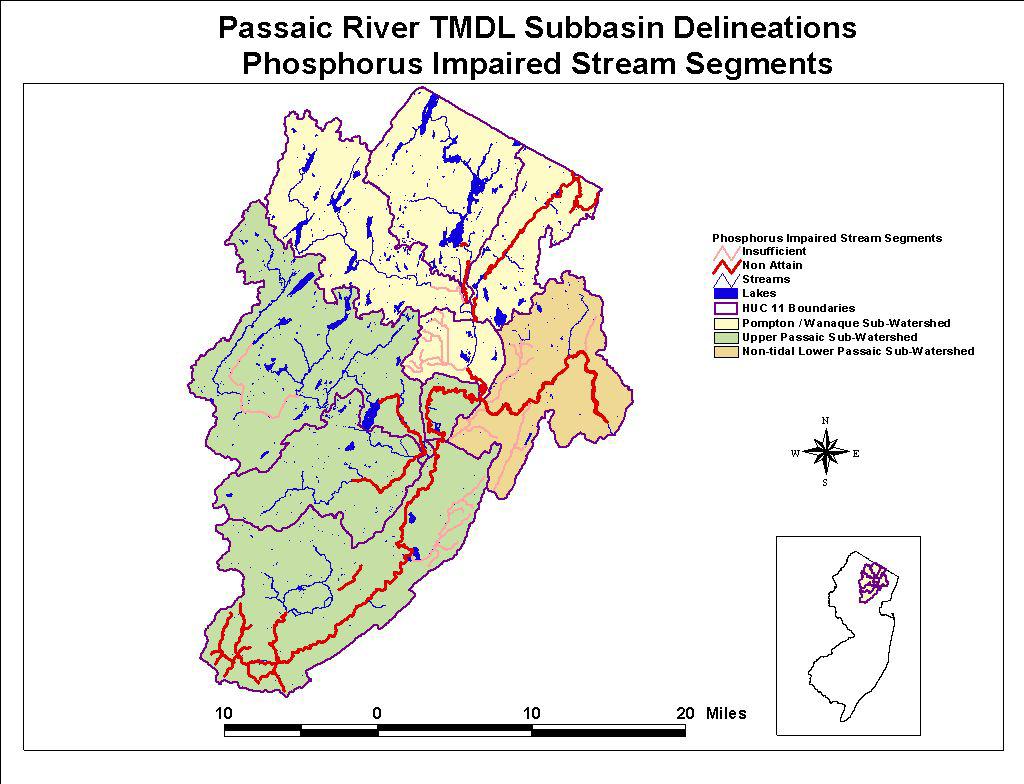
2 The Problem Most of the major waterways within the Passaic River Basin are impaired for total phosphorus- 303d List Phosphorus concentrations in the Wanaque Reservoir exceed the phosphorus Lake Criterion
3 WANAQUE RIVER RAMAPO RI VER PEQUAN NOCK RIVER Non-Tidal Passaic River Basin ROCKAWAY RIVER % % % % % POM PTON RI VER % DUNDEE DAM % WHIPPANY RIVER % PASSAIC RIVER % % % GREAT BROOK BLACK BROOK DEAD RIVER
4 Phosphorus Criteria Streams: TP 0.1 mg/l unless it can be demonstrated that TP is not a limiting nutrient and TP will not otherwise render the waters unsuitable for designated uses Except where watershed or site-specific specific criteria are developed
5 Existing freshwater lake criteria (N.J.A.C. 7:9B-1.14(c)5.i). For FW2 freshwater lakes: Phosphorus as total P shall not exceed 0.05 (mg/l) in any lake, pond or reservoir, or in a tributary at the point where it enters such h bodies or water, except where watershed or site-specific specific criteria are developed pursuant to N.J.A.C. 7:9B-1.5(g)3. 1.5(g)3. N.J.A.C. 7:9B-1.5(g)3 states that. The Department may establish watershed or site-specific specific water quality criteria for nutrients in lakes, ponds, reservoirs or streams, in addition to or in place of the criteria in N.J.A.C. 7:9B-1.14, when necessary to protect existing or designated uses. Such criteria shall become part of these Water Quality Standards.
6 Are the Designated Uses Rendered Unsuitable Due to Phosphorus Dissolved oxygen Does diurnal DO violate criteria? Are algal densities excessive? Phytoplankton concentration- 24 µg/l chl-a a seasonal mean OR 32 µg/l chl-a a 2-week 2 mean Periphyton density- 150 mg/m² chl-a a seasonal mean OR 200 mg/m² chl-a a single event
7 Eutrophication in Streams and Lakes Acceleration of natural aging process excessive loading of silt, organic matter, and nutrients, causing high biological production and decreased basin volume Symptoms of eutrophication (primary impacts) oxygen super-saturation saturation during the day oxygen depletion during night high sedimentation (filling in) rate Large ph swing algae and aquatic plants are the catalysts secondary biological impacts loss of biodiversity structural changes to communities
8 Phase 1 The Plan TP reductions needed to satisfy water quality concerns in the Wanaque reservoir? LA/WLAs based on Reservoir Endpoint Phase 2 TMDL to address all nutrient-related related water quality impairments in non-tidal Passaic river basin LA/WLA as applicable
9 Phase 2 TMDL Phase 2 will: Employ a dynamic model Identify other critical locations Include non-tidal Passaic and tributaries downstream of confluence Establish TMDLs for in-stream impairments May modify WLAs and LAs set in Phase 1 Provide the tool to assess proposed trades
10 100% 90% 80% 70% 60% 50% Simulated Baseline Total Phosphorus Concentrations (surface) 10-Year ( ) Cumulative Distribution 89.3% 81.4% 56% Raymond Dam West Brook Erskine 40% 30% 20% 10% 0% (mg/l)

11
12
13 90 PASSAIC RIVER AT TWO BRIDGES Flow vs. Chl-a concentration Chl-a (ug/l) Flow (cfs)
14 Passaic River at Little Falls summer Flow (cfs) Chl-a (ug/l) /1/1995 5/21/1995 6/10/1995 6/30/1995 7/20/1995 8/9/1995 8/29/1995 9/18/ /8/ /28/
15 Potential Water Quality Drivers Water Supply Concerns: Reservoir Algae blooms (taste and order) Potable water treatment (cost) In-stream & lake eutrophication Algae (floating and attached) Rooted plants (macrophytes) Dissolved oxygen (DO) ph Downstream considerations NY/NJ Harbor Nutrient TMDL
16 Wanaque Reservoir Selected Candidate Endpoints Endpoint Existing criterion Existing criterion met on seasonal basis Selected Existing Criterion Existing criterion is achievable and will restore Reservoir to mesotrophic condition Alternate criterion would, at best, achieve marginally mesotrophic/eutrophic condition Alternate criterion not necessary to protect existing or designated uses.
17
18 Phase 1 Approach Re-verify an existing Reservoir Water Quality Model LA-WATERS Refine & expand an existing Mass- Balance Model for the Passaic River and its tributaries Link the Reservoir and River Models to determine Reservoir loading capacity & distribute load to sources
19 Passaic Watershed Monksville Reservoir WMA3 Wanaque Reservoir # NY # # NJ # Pompton Lakes WMA6 Two Bridges WMA4


20 Wanaque Reservoir Ringwood Creek Monksville Reservoir Erskine West Brook Wanaque Reservoir Raymond Dam Dam 4
21 Tributary Watershed NY NJ
22 Reservoir Source Assessment Tributary Watershed- Wanaque Relatively undeveloped Minimal point source impact within NJ High quality water Intake Watersheds Passaic, Pompton, Ramapo Significant point-source contributions Water quality compromised
23 DISTRIBUTION OF MUNICIPAL DISCHARGERS Current Discharge Flows (mgd)
24 CUMULATIVE PS LOADINGS AT INTAKES LOCATION Pompton Lakes Intake FLOW [mgd] Mean (Design) TP LOADINGS [lbs/day] Mean (Design) Ramapo River* 6.0 (6.6) 76.1 (83.7) Two Bridges Intake Pompton River Passaic River Two Bridges Intake Totals: (16.6) 45.2 (67.2) 57.6 (83.8) (309) 1,020.0 (1516.5) 1,241.1 (1825.5) * 5.9 mgd of the mean flow (and 76.0 lbs/day of loadings) originates from New York
25 CUMULATIVE NPS LOADINGS AT INTAKES LOCATION Pompton Lakes Intake Ramapo River MEAN TP LOADINGS (lbs/day) 100 Two Bridges Intake Pompton River Passaic River Two Bridges Intake Totals:

26 TWO BRIDGES INTAKE PUMPAGE
27 TWO BRIDGES INTAKE PUMPAGE All Flow Conditions 400 Total Diversion (cfs) USGS Flow s (cfs)
28 TWO BRIDGES INTAKE PUMPAGE Frequency Assessment - All Flow Conditions Cumulative Frequency Difference: Stream Flow minus Diversion Flow (cfs)
29 DO VARIATION: PASSAIC RIVER BELOW TWO BRIDGES Conc. (mg/l) Observed Daily Maximum and Minimum Concentrations /1/1989 1/1/1992 1/1/1995 1/1/1998 1/1/2001 1/1/2004 DO Max DO Min DO Variaion (mg/l) Observed Daily Difference between Maximum and Minimum /1/1989 1/1/1992 1/1/1995 1/1/1998 1/1/2001 1/1/2004
30 RIVER MODEL Simple mass-balance model based on Passaic QUAL2E and WMA Characterization Studies Predicts concentration based on dilution of cumulative upstream discharges and NPS load Uses USGS flows and DMR data Applied on a daily basis
31 NONPOINT-SOURCE LOADS Modified procedure in the WMA Characterization Studies to simulate stormwater impacts Separated USGS flows into runoff and base flow components using HYSEP Computed runoff load based on NJDEP s UAL coefficients and GIS land-use data Calibrated NPS mass-balance to simulate calculated annual runoff load
32 RIVER MODEL FORMULATION PS Load Storm-Runoff Source Load Base Flow Load C Riv Q Riv = C Dis Q Dis + C SW Q SW + C BF ( Q Q ) BF Dis C SW = K UAL Q A SW LU
33 SELECTED CONTROL SITES Station Location 1 Passaic River Millington 2 Station Passaic River Chatham Location Rockaway River Pine Brook 1 Passaic River Near Millington NJ Whippany River - Morristown 2 Passaic River Near Chatham NJ 3 Rockaway R At Pine Brook NJ Whippany River Pine Brook 4 Whippany River At Morristown NJ # Whippany R Nr Pine Brook NJ Passaic River Two Bridges 6 Passaic R At Two Bridges NJ Ramapo River - Mahwah 7 Ramapo River Near Mahwah NJ 8 Ramapo River At Pompton Lakes NJ Ramapo River Pompton Lakes 9 Pompton R At Packanack Lake NJ 10 Pompton R At Two Bridges NJ Pompton River - Packanack Lake 11 Passaic River At Little Falls NJ Pompton River Two Bridges 12 Passaic R At Rt 46 At Elmwood Park NJ Passaic River Little Falls # 4 3 # # 5 # # # # # 11 # Passaic River Elmwood Park 2 # 1 #
34 Mass Balance Simulation of Total Phosphorus for the Pompton River at Two Bridges -- Station ( ) 2002) Total-P (mg/l) Jan-92 Jan-94 Jan-96 Jan-98 Jan-00 Jan-02 Total-P (mg/l) Jan-00 Dec-00 Dec-01
35 Mass Balance Simulation of Total Phosphorus for the Passaic River at Two Bridges -- Station ( ) 2002) Total-P (mg/l) Jan-92 Jan-94 Jan-96 Jan-98 Jan-00 Jan-02 Total-P (mg/l) Jan-99 Jan-00 Dec-00 Dec-01
36 Mass Balance Simulation of Total Phosphorus for the Ramapo River at Pompton Lakes -- Station ( ) Total-P (mg/l) Jan-92 Jan-94 Jan-96 Jan-98 Jan-00 Jan-02 Total-P (mg/l) Jan-94 Jan-95 Jan-96
37 Mass Balance Simulation of Total Phosphorus for the Ramapo River at Mahwah -- Station ( ) 2002) Total-P (mg/l) Jan-92 Jan-94 Jan-96 Jan-98 Jan-00 Jan-02 Total-P (mg/l) Jan-99 Jan-00 Dec-00 Dec-01
38 Mass Balance Simulation of Total Phosphorus for the Passaic River at Chatham -- Station ( ) Total-P (mg/l) Jan-92 Jan-94 Jan-96 Jan-98 Jan-00 Jan-02 Total-P (mg/l) Jan-00 Dec-00 Dec-01
39 Mass Balance Simulation of Total Phosphorus for the Passaic River at Little Falls -- Station ( ) 2002) Total-P (mg/l) Jan-92 Jan-94 Jan-96 Jan-98 Jan-00 Jan-02 Total-P (mg/l) Jan-00 Apr-00 Jul-00 Oct-00 Feb-01 May-01 Aug-01 Dec-01
40 Pompton Lake/Ramapo River Phase 1 also addresses Pompton Lake and Ramapo River above Pompton Lake Most of the load reduction must occur in New York WLAs/LAs established in Phase 1 will not be modified in Phase 2, subject to trading
41 Margin of Safety (MoS) and Reserve Capacity (RC) Explicit MoS for the Wanaque Reservoir of 6.0 % Explicit RC of 1.0 % MoS & RC for Wanaque Reservoir is 1220 lbs/year or 7.4 % of the TMDL (16,501 lbs/year)
42
43 Table 6.2: TMDL calculations for Ramapo River Watershed (at Pompton Lakes) (average annual loads and percent reductions) Existing Conditions 1 TMDL Specification Percent lbs TP/yr % of CWL lbs TP/yr % of CWL Reduction 2 Cumulative Watershed Load (CWL) 43, % 13, % 69% Point Sources other than Stormwater NJPDES Dischargers % % 0% Internal Loading Sediment/Base Flow 1, % 1, % 0% Boundary Inputs New York 4 28, % 6, % 76% Land Use Surface Runoff 5 Low Intensity Residential 3, % % 80% High Intensity Residential 4, % % 80% Commercial/Industrial/Transportation 2, % % 80% Mixed Urban/Recreational 1, % % 80% Crops/Pasture/Hay % % 80% Deciduous Forest 1, % 1, % 0% Evergreen Forest 6 0.0% 6 0.0% 0% Mixed Forest % % 0% Shrubland % % 0% Woody Wetlands % % 0% Herbaceous Wetlands % % 0% Open Water % % 0% Disturbed Areas % % 0% Other Allocations Margin of Safety n/a n/a % n/a Reserve Capacity n/a n/a % n/a average annual loads based on model simulation = 1 - (TMDL load /Existing load)*100 detailed listing of individual discharge facilities is provided with Table 6.10 includes PS and NPS discharges to Ramapo River within New York State
44 WLAs for Treatment Facilities on the Pompton Lake watershed PDES # Facility Name Current Flow (mgd) 2 Current Load (lbs/yr) 3 Permitted Flow (mgd) WLA (lbs/yr) 4 Load % Reduction* OAKLAND CARE CENTER * OAKLAND-CHAPEL HILL ESTATES STP * RAMAPO RIVER CLUB STP * OAKLAND-OAKWOOD KNOLLS WWTP * RAMAPO-INDIAN HILLS H.S. WTP * OAKLAND-SKYVIEW-HIGH BROOK STP * 2 current flows are based on NJDEP's Municipal STP Flow Database for current loads are based on facility's reported discharge load 4 based on a LTA effluent concentration of 0.20 mg/l * denotes that projected TMDL is greater than the reported discharge load
45 MODEL LINKAGES Calibrated River model provides time series of daily loads at Reservoir intakes Allows for Reservoir model simulations of diversions impacts
46 RESERVOIR MODEL ANALYSIS Apply calibrated LA-WATERS model Develop intake input based on River model output Re-simulate 11-year baseline condition
47 Simulated TP Concentrations in Wanaque Reservoir Raymond Dam at Surface Effluent LTA Conc. = 0.2 mg/l and 80% NPS Load Reduction Maximum ppm (mg/l) /1/93 1/1/94 1/1/95 1/1/96 1/1/97 1/1/98 1/1/99 1/1/00 1/1/01 1/1/02
48 12 Simulated Chlorophyll-a Concentrations in Wanaque Reservoir Raymond Dam at Surface Effluent LTA Conc. = 0.2 mg/l; NPS Reduction = 80% 10 Chlorophyll a (µg/l )
49 100% 90% Simulated Total Phosphorus Concentrations (surface) 10-Year ( ) Cumulative Distribution Effluent LTA Conc. = 0.2 mg/l and 80% NPS Load Reduction 80% 70% 60% 50% 40% 30% 20% 10% 0% (mg/l)
50 Allocations Model results indicate that full compliance with TP criterion can be achieved by: Reducing cumulative upstream discharge load (PS TP load) to 139 lbs/day (~ 83%), and Reducing NPS load by 80% Trading: point to point source STP Stormwater (MS4) Treat diversion water
51 NPS Strategies NPS & Stormwater PS reductions Stormwater SBR (inlet cleaning, street sweeping, pet waste, etc) Low Phosphorus Fertilizer Ordinance Retrofits (319 projects) Buffers Restorations Ag BMPs Goose management Septic system management Low maintenance landscaping at corporate campuses
52 Next Steps Comments due September 3 Response to Comments EPA for approval Point Source implementation meeting on November 1, 2005 at DEP public hearing room Low phosphorus ordinance -- additional measure post adoption as amendment
53 Comments are due September 3 All TMDL documents are posted at Barbara Hirst, Bureau Chief NJDEP DWM PO Box 418 Trenton, NJ 08625
54 Questions?