Components of Estuarine and Marine Ecological Risk Assessment
|
|
|
- Jasmin Tucker
- 5 years ago
- Views:
Transcription
1 Components of Estuarine and Marine Ecological Risk Assessment Denise M. Klimas Donald A. MacDonald Assessment and Restoration Division Office of Response and Restoration DTSC Ecological Risk Assessment Workshops July August 2007
2 OUTLINE for Sediment ERA presentation NOAA s Role at DTSC Sediment characteristics Components of a Sediment ERA Conceptual site models Tools for evaluation Weight of evidence-risk characterization Sediment Quality Guidelines Query Manager mapping tools
3 NOAA s Role MOU between DTSC and NOAA to Protect and Restore Coastal Resources NOAA provides technical support to DTSC project managers in OMF and Site Mitigation NOAA acts as a technical liaison and co-trustees with other federal, state, and local response agencies during field investigations, remedial planning, and the design and implementation of mitigation strategies NOAA exercises trusteeship at both DoD and industrial sites
4 When do Natural Resource Trustees get involved in a site? when there is an injury to, destruction of, loss of, or threat to natural resources as a result of a release of a hazardous substance or a discharge of oil. NCP Section

5 Marine and Estuarine Sediment Risk Assessment ERA Mini-recap
6 Why do we care about contamination in Sediments? Sediments act as sinks for contamination Benthic communities, which form the basis of the aquatic food chain, can be eliminated or tainted by sediment contamination Persistent organic contaminants in sediments can accumulate through the food web into higher trophic level organisms, including humans Contaminants in sediments can easily spread beyond the point of origin through physical or biological means Contaminated sediments can lead to an economic impact on local and regional communities
7 How can a Sediment Ecological Risk Assessment differ from a Terrestrial ERA? Contaminated sediments may occur in a wide variety of aquatic environments: wetlands, harbors, estuaries, rivers, lakes, etc. Aquatic environments are often large, complex and diverse with multiple sources, multiple contaminants, and multiple uses. Contaminants may be transported long distances from their sources by tides, currents, floods, and seasonal influxes Selecting a reference area, and separating background concentrations from site-specific sources can be difficult
8 How can a Sediment Ecological Risk Assessment differ from a Terrestrial ERA? Sampling and remediation of sediments can be technically challenging Evaluating the multiple communities and trophic levels associated with contaminated sediments can be very complex: communities may vary over smaller distances Remediation of sediments can destroy sensitive habitats and have a long-term impact on receptors which rely on those habitats
9 Physical/Chemical Parameters of Sediments Temperature Salinity Sediment Grain Size Total Organic Carbon ph Eh (Electrode Potential) Total Solids/Moisture Content Total Sulfide Acid Volatile Sulfides
10 Assessing the Risk at a Marine Sediment Site
11 Chemicals of Concern Plants/Animals Means of Exposure/ Impact Potential Ecological Risk
12 Conducting a Sediment ERA--Contaminants Identify contaminants, sources, and pathways to aquatic environment Site history Consider releases to surface water Direct or via Groundwater Consider releases from groundwater to sediments Consider releases from the atmosphere/wind driven particulates or volatilization
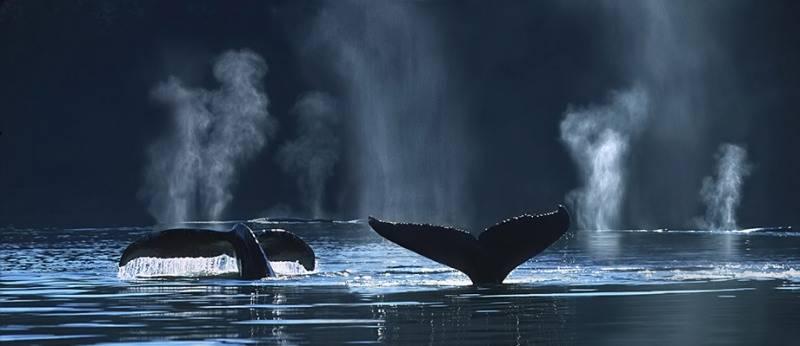
13 Basic Sediment-Based Marine Food Chain Quaternary Predators Very Large Fish Cetaceans Humans Tertiary Predators Birds Large Fish Pinnipeds Cetaceans Sea Otters Humans Secondary Predators Birds Medium Fish Pinnipeds Cetaceans Sea Otters Humans Primary Predators Birds Shrimp Crabs Small Fish Pinnipeds Cetaceans Sea Otters Humans Invertebrate Infauna & Epifauna Worms Amphipods Mollusks Sea Urchins Humans Plants Algae Bacteria Detritus
14 Generalized Aquatic Food Web Consumers Carnivores Marine Mammals Benthic Feeding Birds Piscivorous Bird Piscivorous and Benthic Fish Omnivores Vertebrate Omnivores (including filter feeders) Invertebrate Omnivores benthic, free (pelagic) (including filter feeders) Detritivores (Mechanical decomposers) chewers, shredders, gatherers Herbivores Vertebrate Herbivores (including filter feeders) Invertebrate Herbivores scrapers, grazers, filter feeders (including zooplankton) Producers Non-vascular & Vascular Attached and Free Algae (including phytoplankton and photosynthetic bacteria) Submerged, emergent, and floating vascular vegetation Decomposers Carcasses, plant debris, exuviae, fecal material, etc. Chemical Decomposers (fungi, bacteria) NUTRIENTS

15 Conducting a Sediment ERA--Receptors Identify receptors potentially impacted by the release Benthic organisms via sediment, porewater/gw Fish and epibenthic organisms via surface water, sediment, and contaminated prey Marine mammals via contaminated prey Aquatic-dependent birds via sediments and contaminated prey
16 Simple Conceptual Model Other Estuarine Sources release of a contaminant from a waste site Soil Groundwater Surface Water Bulk Sediment Sediment Particulates Benthos Receptor Ultimate Source Sediment Pore Water Benthos Receptor
17 Evaluating Exposure and Effects
18 Once Sediment Data are Available Identify the potential chemical action of contaminants as they relate to exposure of receptors at the site. Can exposure to the contaminant result in: Toxicity Acute Chronic Bioaccumulation/Biomagnification Food web
19 How to Estimate Potential Impacts to Receptors Toxicity from exposure to metals, pesticides, PAHs and PCB contamination For Sediments: Use Sediment Screening Guidelines (ER-L, etc) Conduct appropriate toxicity tests with site sediment For Surface and Pore water: Use Ambient Water Quality Criteria/California Toxics Rule values Conduct appropriate toxicity tests with site water
20 How to Estimate Potential Impacts to Receptors Bioaccumulation from exposure to certain metals, pesticides, dioxins and PCB contamination For Sediments: Conduct appropriate accumulation tests with site sediment Collect resident organisms for tissue residue analysis Can use literature-based accumulation factors for food web For Surface and Pore water: Use partitioning factors, literature-based factors Collect resident organisms for tissue residue analysis
21 Bioaccumulative Contaminants in Sediment Metals Cd, Cu, Hg, Ni, Pb, Se, Tributyltin, Zn Pesticides and PCBs PAHs in benthos Dioxins and dibenzofurans


22 Exposure and Effects: What Receptors and Functions Do We Care About?
23 Generic Assessment Endpoints Protection/maintenance of an animal/plant population: Refers to the ability of a population of the species of concern to survive, grow and reproduce. Protection/maintenance of a biotic community: Refers to the ability of all species in the community to survive, grow and reproduce maintaining the proper balance of species. Protection/maintenance of an endangered species: Refers to the ability of every individual of the endangered species of concern to survive, grow and reproduce.


24 Candidate Assessment Endpoints for Aquatic ERAs Survival and growth of aquatic plants Survival and growth of aquatic invertebrates Survival, growth and reproduction of fish Survival, growth and reproduction of aquaticdependent mammals Survival, growth and reproduction of aquaticdependent birds
25 Laboratory Studies
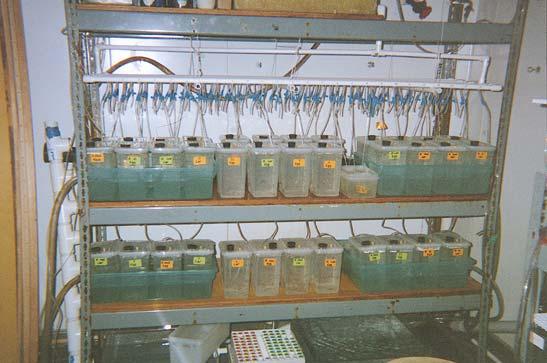
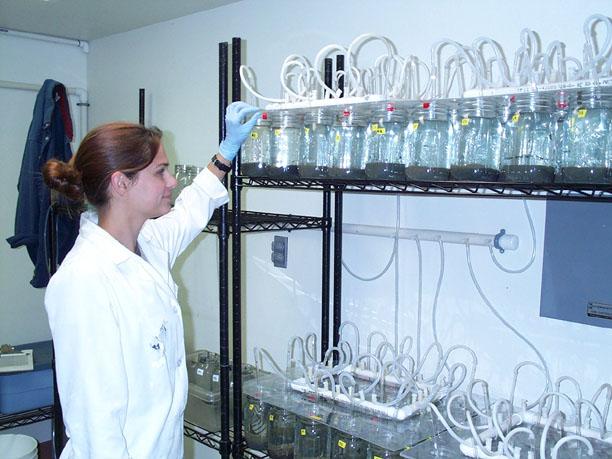
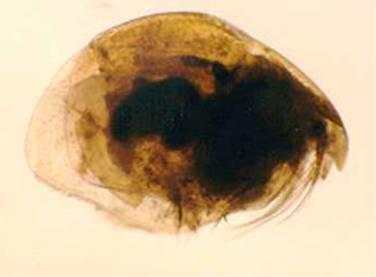
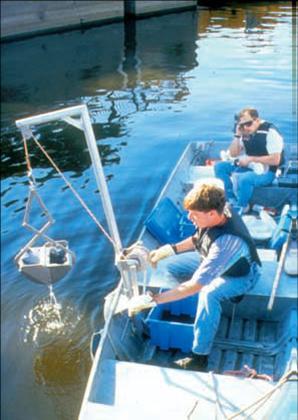
26 Types of Laboratory Studies Toxicity testing Survival amphipods (Eohaustorius sp) Growth worms (Neanthes sp) Reproduction echinoderms (Dendraster sp) Bioaccumulation studies Tissue residues and growth bivalves, fish

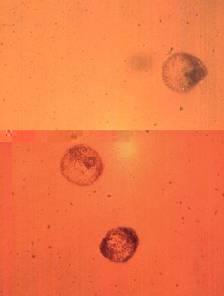
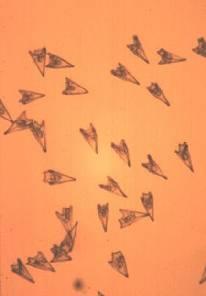
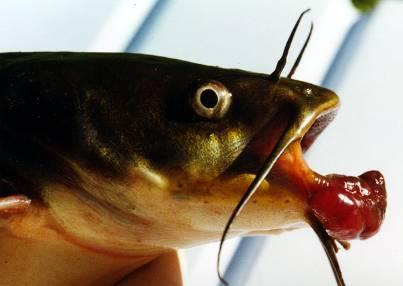
27 Toxicity Test Organisms
28 Advantages of Toxicity Tests Provides quantifiable information about the potential for bioeffects at a site Indirect indicator of bioavailability of contaminants Controlled conditions of exposure (minimizes natural variability) Not dependent on presence of an in-situ population Quick and relatively inexpensive
29 Disadvantages of Toxicity Tests Not designed to mimic natural exposure, so may be difficult to relate directly to actual responses at a site Test tells whether or not media is toxic not what is causing toxicity Not appropriate for contaminants that cause subtle effects over long periods, or for those where the major concern lies in their potential to biomagnify May observe toxicity in unexpected places (i.e., clean sites) due to unknown or unquantified factors
30 The net result when the uptake of a chemical by a biological organism exceeds the depuration of the chemical from the organism Bioaccumulation
31 Bioaccumulation Toxicant in water: fate processes either internal or external to model Uptake through gill: respiration rate assimilation efficiency Partitioning Toxicant in food sources Organic sediments Algae Uptake from diet consumption rates assimilation efficiency growth rates toxicity lipid content food web structure Losses of toxicant: biotransformation predation mortality depuration spawning promotion emergence
32 Bioaccumulation Factor (BAF) Biota-Sediment Accumulation Factor (BSAF) BAF = [Organism] / [Media] BAF BSAF BSAF = [Organism] / [Sediment] [ug/kg of lipid] / [ug/kg of organic carbon]

33 Field Deployment of Clam Bioaccumulation Study
34 Advantages of Bioaccumulation Studies Direct measure of bioavailability Integrates contamination levels over time Concentrates chemicals from water allowing easier and less expensive analyses Potential for determining health risks Use information to calculate uptake through the foodweb (dose to predator)
35 Disadvantages of Bioaccumulation Studies Due to bioregulation or metabolism of some contaminants, body burdens are not related to levels found in the environmental Relationship between body burdens and bioeffects uncertain Difficult to associate contamination in mobile species to the contaminated site Uptake of one contaminant may be inhibited by the presence of other contaminants-antagonism Rates of biological processes may be reduced by contamination, thus reducing rates of bioaccumulation

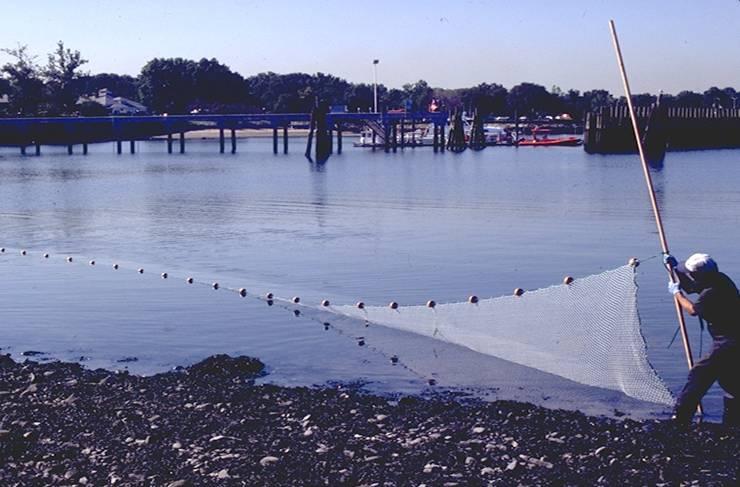
36 Biota Sampling
37

38 Benthic Community Analysis

39 Ponar Eckman grab

.")
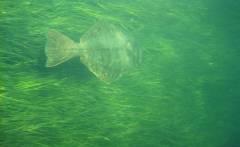
40 Deploying Remotes camera and bottom image taken with camera (NASSCO).
41 Community Measures Taxa Richness Percent Contribution of Dominant Taxa Abundance Community Similarity Indices: Benthic Response Index (BRI) Relative Benthic Index (RBI)
42 Community Studies Pros Cons Measures actual in-situ biological responses to contaminants Demonstrate effects on indigenous organisms Integrates temporal exposure High natural variability Requires experienced expert investigators May not be appropriate for contaminants whose major concern lies in their potential to bioaccumulate
43 Data Interpretation
44 Summary of Information PRESENCE OF CONTAMINANTS CHEMICAL ANALYSIS Sediment chemistry Water chemistry BIOAVAILABILITY OF CONTAMINANTS BIOEFFECTS BIOACCUMULATION Tissue chemistry Lipid bag deployment TOXICITY TESTS Amphipod mortality Daphnia reproduction Neanthes growth COMMUNITY STUDIES Species richness Species ratios Community composition
45 Uncertainty: Common Extrapolations Between taxa Between responses From laboratory to field Between geographic areas Between spatial scales From data collected over a short time frame to longer-term effects
46 Weight of Evidence---Triad Approach Chemistry results Exceeds benchmarks yes or no Results of toxicity testing Can include bioaccumulation testing Community Structure Indices
47 Weight of Evidence Table Example Loc Toxicity Benthic Bioaccm Score Test Chemistry testing Community testing Loc High Loc _ + High Loc 3 _ + + _ Potential Loc 4 + _ + _ Potential Loc 5 Low
48 WOE Approach: Advantages & Disadvantages Advantages: Document exposures and effects spatially & temporally, using qualitative & quantitative analyses Evaluate exposure & effects relationships in multiple compartments in both the lab & field Disadvantages: Cannot provide predictive capability (i.e., correlation is not causality) Cannot predict clean-up levels Individual LOE are quantitative; WOE approach may be subject to using only qualitative BPJ
49 Questions?