Stormwater Retrofit Assessments and Developing Policy to Forward our Treatment of the Urban Stormwater Dilemma An NAI Approach
|
|
|
- Colleen Francis
- 5 years ago
- Views:
Transcription
1 Stormwater Retrofit Assessments and Developing Policy to Forward our Treatment of the Urban Stormwater Dilemma An NAI Approach Georgia Association of Floodplain Managers March, 2013 Jacob McLean, PE, CFM

2 Stormwater and Related Retrofit Studies What and Why? Types of Retrofit Studies Retrofit Study Methods mixed with Innovations and Lesson Learned Programmatic and Policy Developments in the Chesapeake Bay Watershed
3 Retrofit Study Names Watershed Management Plans / Assessments Stormwater Master Plans Mitigation Site Searches Site Assessments Concept Studies / Concept Plans Alternative Analyses..


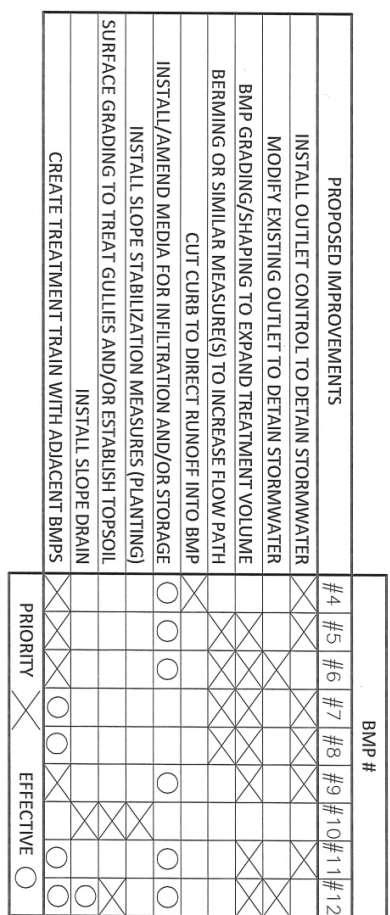
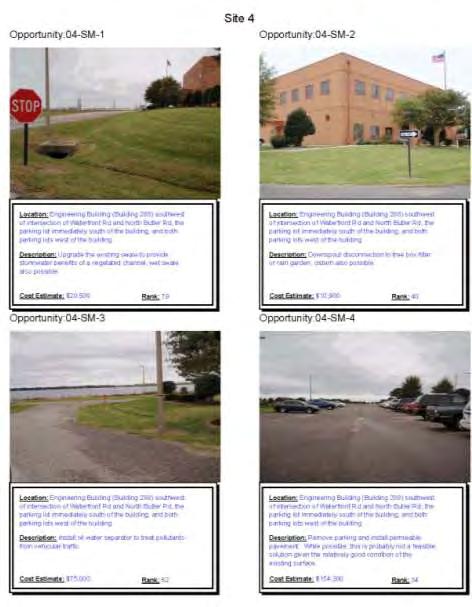
4 Retrofit Study Recommendations


 15 48 24 8 95 8 8 / 28 $ 43,500 04-SM-1 Dry swale (or bioretention if enough head) 35")


 30 20 10")
5 Retrofit Study Methods ProjectID Improvement Cat1 Cat2 Cat3 Cat4 Fatal Flaw Score Rank Rank Cost 01-SM-1 Impervious cover conversion / 28 $ 81, SM-1 Impervious cover conversion / 28 $ 36, SM-1 Impervious cover conversion / 28 $ 57, SM-2 Impervious cover conversion / 28 $ 84, SM-5 Forest buffer establishment / 28 $ 23, SM-4 Forest buffer establishment Y / 28 $ 27, SM-3 Forest buffer establishment / 28 $ 36, SM-1 Infiltration (micro scale) / 28 $ 43, SM-1 Dry swale (or bioretention if enough head) / 28 $ 90, SM-2 Flow to open space/filter strip Y / 28 $ 78, SM-3 Wet swale / 28 $ 75, SM-4 Soil ammendment and revegetated / 28 $ 10, SM-2 Constructed wetland / 28 $ 35, SM-2 Forest buffer establishment Y / 28 $ 23, SM-3 Wet swale / 28 $ 70, SM-1 Wet swale / 28 $ 96, SM-2 Wet swale / 28 $ 50, SM-4 Forest buffer establishment Y / 28 $ 17, SM-1 Dry swale / 28 $ 52, SM-6 Constructed wetland (or wetland restoration) / 28 $ 117,800
 TMDLs Public projects Demonstration Projects Aesthetics and recreation Citizen complaints Flooding")
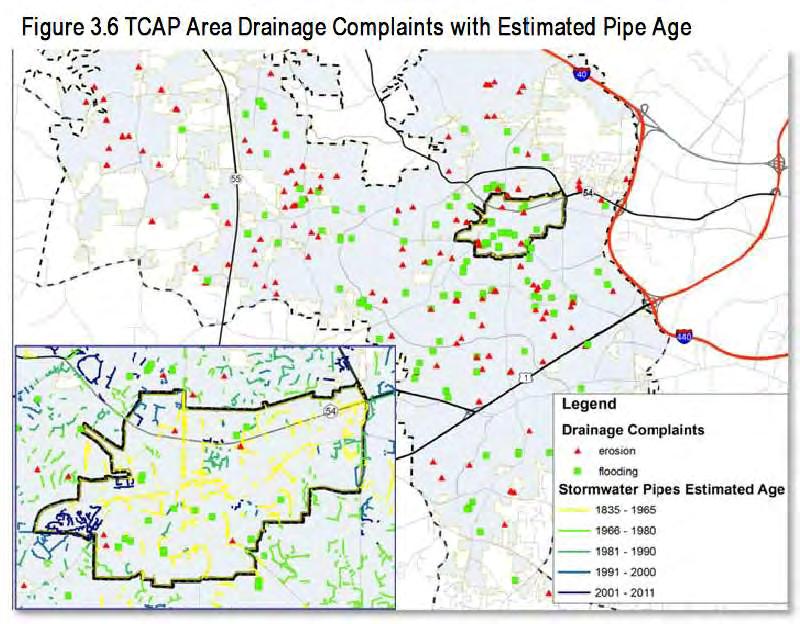
6 Retrofit Study Drivers Regulatory: Impact of pre-regulated development Municipal Stormwater Programs Infrastructure concerns 303(d) Streams, Watershed Plans, (Prevent) TMDLs Public projects Demonstration Projects Aesthetics and recreation Citizen complaints Flooding Mitigation
7 Example of 303(d) Driver: McDowell Creek Sediment Plume in McDowell Creek Cove Quantitative Goals Upland Pollutant Loading Rate In-Stream Water Quality Channel Stability


8 Retrofit Study Purpose & Outcomes Restoration need based on channel evaluation scores Red high Yellow medium Blue low BEHI/NBS Bank Erosion Calculation and Summary Map during Phase 1


9 Retrofit Study Purpose & Outcomes Recommendations Costs / Critical Assumptions Projects and Project Bundles Rank/Prioritize

10 Landscape Setting Retrofit Study Factors that Define Assessment Desired / Required outcomes Project Types / Scope to be recommended Type and quality of data available Budget and Scale Project Complexity Regional Detention vs On-site Treatment


11 Town of Sparta versus Town of Cary SWMP


12 Town of Sparta versus Town of Cary SWMP
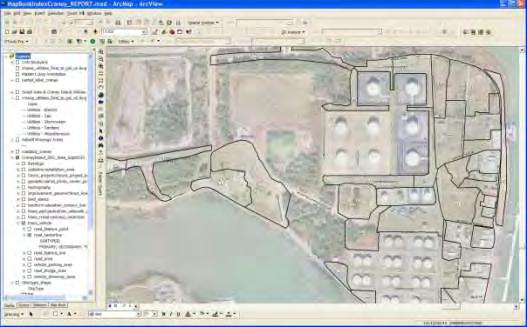
13 Retrofit Study Assessment Activities Reconnaissance of Aerial Photography/Mapping Analysis of GIS and CAD Data Site Visit Rapid vs. Comprehensive Assessments Water Quality/Quantity/Flood Modeling (Sizing) Load/Runoff Reduction (Efficiency) Constraints Analysis Scoring and Ranking Cost Estimate (Planning) Mapping & Fact Sheet Conceptual Design Detailed Cost Estimate
14 GIS / Desktop Assessment Reconnaissance of aerial photography, GIS and CAD mapping with variable levels of data analysis Preference for readily available data (georeferenced) Aerials, utilities, FEMA, buffer requirements Low cost & data input is an option Appropriate for: Coarse studies, large & remote study areas Screening tool (1 st phase of more detailed study) Less accounting required Identifying lowest hanging fruit Limitations must be understood


15 Ecosystem Enhancement Site Searches Query GIS databases based on Land Use characteristics Parcel data Topographic data Soils & wetland data Yields list of site and landowners Example of screening tool
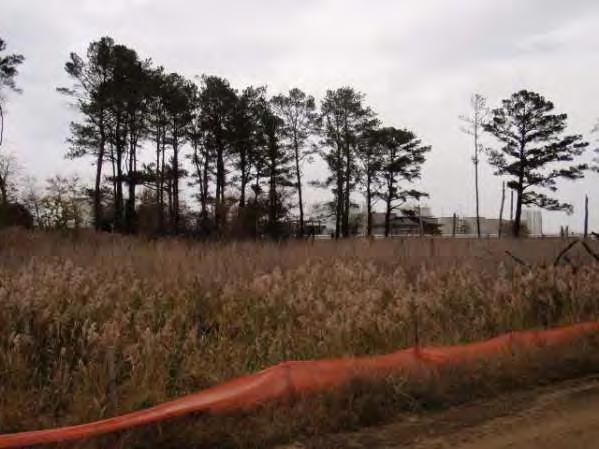
16 Field Assessment Level 1 Can support with maps from municipal GIS or aerials Emphasis on visual observation (judgment based) Identify gross characteristics Location of management practice Major observations Appropriate for: Aesthetic enhancement projects with benefits Screening tool (1 st phase of more detailed study) Less accounting required Identifying lowest hanging fruit Limitations must be understood

17 Rapid Assessment with Concepts


18 Rapid Field Assessment with Design Detail
19 Field Assessment Level 2 Support with high quality GIS information of a comprehensive nature Emphasis on protocols and assessment worksheets Produces consistent analysis and data for scoring More significant post-processing component Very effective for preliminary design Appropriate for: Regulatory drivers Capital improvement/comprehensive planning Competitive grant funding Cost-benefit analysis of many opportunities Limitations must be understood


20 Field Assessment Level 2
21 Detailed Assessment & Master Planning May involve multiple of the prior three types as well as other efforts such as mapping & data collection phases More complex GIS analyses and queries to enhance input and output Common to including H&H modeling or other rigorous analysis Post processing may include preliminary design tasks such as BMP sizing May warrant database output with user interface with potential for asset management Prioritization and cost analyses are typical


22 Chesapeake Bay Protection and Restoration Identify SM, EC, INF and restoration, rank SMs Low Impact Development focus Evolution of Methods Regulatory Driver Data Availability Refinement Automation Key development was more accurate BMP sizing Involves detailed concept design Scoring/Ranking (SM)
23 Tips to Evaluate and Manage Effort Understand Data Quality & Format Define database & scoring system up front use to create field forms Understand design calculations & data sources Immediate organization of field data use technological methods when appropriate Plan output format and generation methods

24 Define & Address Goals Improve Water Quality Greater & earlier peak discharge STREAM FLOW RATE Greater runoff volume Smaller & less rapid peak Reduced baseflow Prevent Flooding TIME WITH DEVELOPMENT PRE-DEVELOPMENT


25 Understand the design constraints Setting Drainage Area Physical, Aesthetic, and Operational 25

26 Base on local/regional/state design guidance TYPICAL BMP GUIDANCE INFO: BMP Description & purpose Design guidelines Plan submission requirements Construction/installation Performance, inspection, and maintenance Costs Credits Diagrams Sources and additional information


27 Figure out where technology makes sense


28 Automation can assist with large studies 28
29 Complex Methods and Technologies One time study versus plans to repeat Look for canned forms and methods such as published by Center for Watershed Protection or Chesapeake Stormwater Network Consider shelf-life of recommendations in undertaking expenses
30 Categorize Scoring Elements Category Environmental Impact Factors Benefits Constraints Scoring Elements Contributing Impervious Drainage Area Stormwater Benefits from Existing Landscape Impervious Area, Water Quantity, Maximum Element Score Land Use 10 Receiving Water Sensitivity 5 Land Use, Water Quality, Potential Nitrogen, Phosphorous, and Env. Solids Benefits 20 Removal (33%) Runoff Reduction 20 Environmental Benefits 5 Tree and Vegetation Loss 5 Minimization Space, Access, Space Constraints 5 (33%) Utilities, Engineering, Construction & Maintenance (33%) Construction Access 5 Utility Conflicts 10 Engineering Design Issues 10 Maximum Category Score 50 (33%) 50 (33%) 30 (20%) Relative BMP Cost Factors Unit Construction Cost 10 Maintenance Burden/Cost (13%) Total Maximum Possible Score: 150 Fatal Flaws - Considerations that may preclude certain opportunities from being viable, as described at the beginning of Appendix A F
 Water Quantity, Water Quality,")
 Relative")
31 Categorize Scoring Elements Environmental Impact Factors Impervious Area, Land Use, (33%) Water Quantity, Water Quality, Env. Benefits (33%) Benefits Constraints Space, Access, Utilities, Engineering, Construction & Maintenance (33%) Relative BMP Cost Factors 32
32 Categorize Scoring Elements ProjectID Improvement Cat1 Cat2 Cat3 Cat4 Fatal Flaw Score Rank Rank Cost 01-SM-1 Impervious cover conversion / 28 $ 81, SM-1 Impervious cover conversion / 28 $ 36, SM-1 Impervious cover conversion / 28 $ 57, SM-2 Impervious cover conversion / 28 $ 84, SM-5 Forest buffer establishment / 28 $ 23, SM-4 Forest buffer establishment Y / 28 $ 27, SM-3 Forest buffer establishment / 28 $ 36, SM-1 Infiltration (micro scale) / 28 $ 43, SM-1 Dry swale (or bioretention if enough head) / 28 $ 90, SM-2 Flow to open space/filter strip Y / 28 $ 78, SM-3 Wet swale / 28 $ 75, SM-4 Soil ammendment and revegetated / 28 $ 10, SM-2 Constructed wetland / 28 $ 35, SM-2 Forest buffer establishment Y / 28 $ 23, SM-3 Wet swale / 28 $ 70, SM-1 Wet swale / 28 $ 96, SM-2 Wet swale / 28 $ 50, SM-4 Forest buffer establishment Y / 28 $ 17, SM-1 Dry swale / 28 $ 52, SM-6 Constructed wetland (or wetland restoration) / 28 $ 117,800
33 Differentiate where-ever it makes sense Making Effective Comparisons Example of Simple Versus Complex Scoring Systems One Method for Creating Differentiation The Percentile Method Categories and Subscores
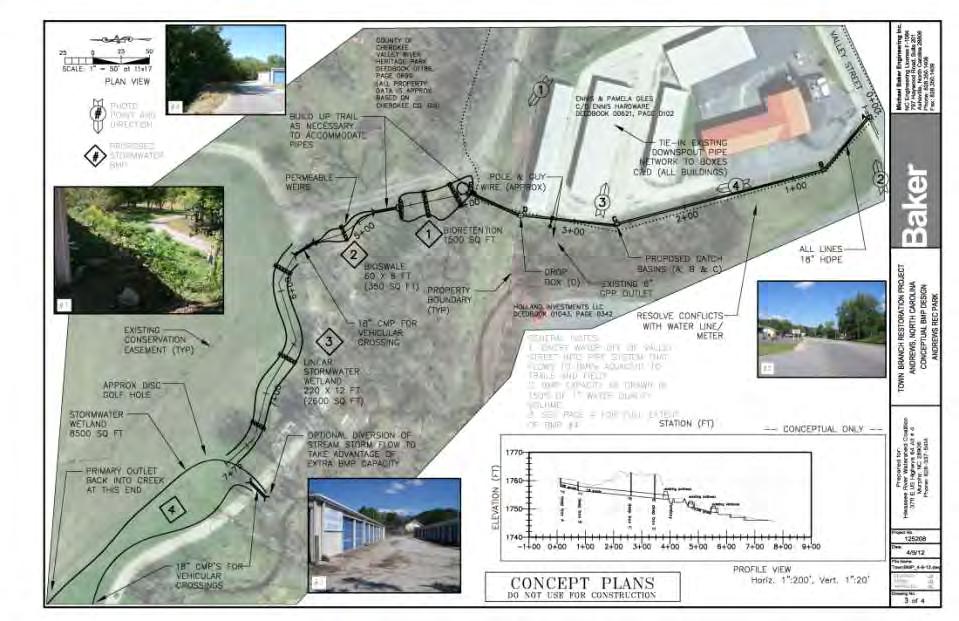
34 Prepare Conceptual Designs for High Ranking Recommendations 35
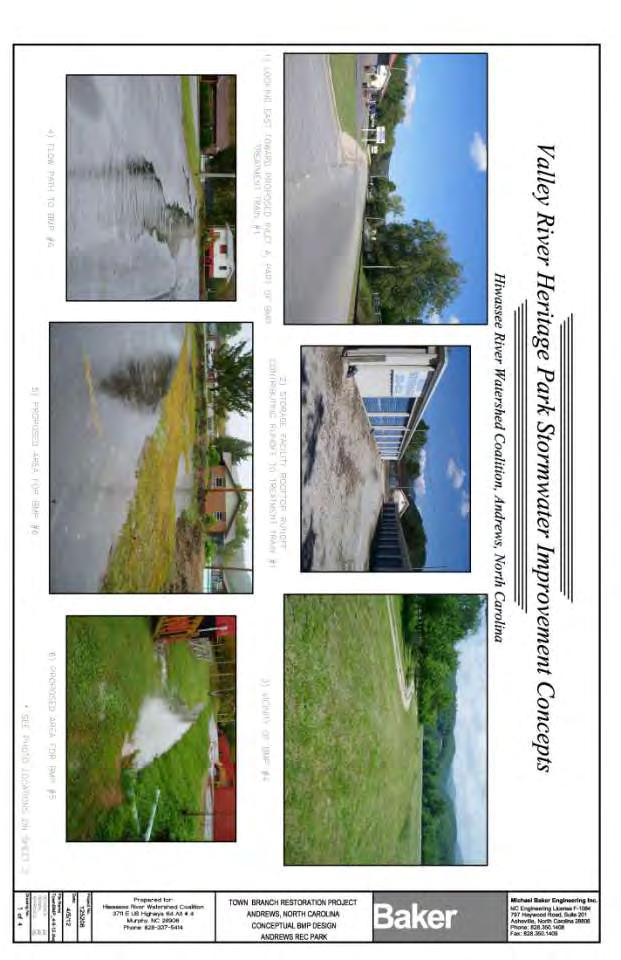
35 Use Oblique Imagery to Assist with Analysis


36 Use condensed presentation format
37 Chesapeake Bay Policy Developments for TMDLs - Defining Performance Expert Panel recommendations for: Stream restoration crediting BMP crediting Performance Curves based on mass reduction (runoff reduction) BMP Adjuster Curves Evaluate New Technologies and Design Specs Benchmarking for Facilities & Institutions Lots of non-structural based on Coca Cola bottling facilities model 38


38 % Removal based on runoff depth treated 39
39 Chesapeake Bay Program/Policy Developments for TMDLs - Defining Credit Tie crediting to inspections Repurposing existing facilities (BMP Conversions) Nutrient Trading programs being explored 40
40 Stormwater Retention Credit Trading in DC 1.2 Capture Requirement 1.7 Credit Option Typically 50% minimum on-site Benefits include: Cost efficiency Greater water quality benefit 41


41 Innovative BMPs being explored: Floating Mycoremediation Wetlands

42 Questions? March 2013 Jake McLean, PE, CFM