Regional Modeling Center Progress on Visibility Modeling in 2006
|
|
|
- Marion McDowell
- 5 years ago
- Views:
Transcription
1 Regional Modeling Center Progress on Visibility Modeling in 2006 Gail Tonnesen, Zion Wang, Mohammad Omary, Chao-Jung Chien, Yingqun Wang University of California, Riverside Zac Adelman University of North Carolina Ralph Morris et al. ENVIRON Corporation Int., Novato, CA
2 2006 Goals Modeling visibility projections using 2002 Typical Year and 2018 Base Case Source Apportionment Modeling using PSAT BART CALPUFF Modeling Alaska BART Modeling Fire emissions sensitivity studies Tech Support and Data Transfer
3 Visibility Modeling Scenarios Used MM5, SMOKE, CMAQ and CAMx Base version B was the model performance evaluation (completed in 2005). For visibility projections and PSAT we used: 2002 planning case using typical baseline period emissions (Plan02c) base case that includes on the books emissions reductions (Base18b).


4 Modeling Domain WRAP 36-km CMAQ/CAMx Domain within MM5 36-km domain WRAP CMAQ domain: red: 36-km blue: 12-km
5 WRAP RMC Emissions Modeling and Analysis RMC work plan emissions modeling tasks Emissions modeling summary for current project period: Plan02 and Base2018 Small fire sensitivity Natural emissions sensitivity Fire plume rise sensitivity results CAMx PSAT emissions BART selection Outstanding issues, lessons learned, and next steps Discussion
6 WRAP RMC Work Plan Emissions Modeling - Task 2 Modeling and analysis of final actual 2002 inventories Modeling and analysis of improved 2002 inventories with typical fire and EGU data (Plan02) Modeling and analysis of initial 2018 inventories 2018 point and area emissions control strategy scenarios X Mexico and Canada inventory improvements NH 3 model evaluation and recommendations X US inventory evaluation and recommendations
7 WRAP RMC Work Plan Emissions Modeling - Other Tasks Evaluation of the effects of small fires on haze Evaluation and recommendation of alternative plume rise algorithm for large fires Development and evaluation of natural emissions simulations Development of emissions for CAMx PSAT simulations
8 WRAP RMC Work Plan Emissions Modeling Task Status Tasks completed since January, 2006 Base 2002 versions B and C Planning 2002 versions B and C Base 2018 versions B and C Small fire sensitivity Natural emissions sensitivity Windblown dust sensitivity Fire plume rise sensitivity CAMx PSAT emissions
9 WRAP RMC Emissions Modeling Summary: January October, 2006 Simulation ID Work Plan Task # Completion Date Description Base02b 2,10 04/2006 Version B of the actual 2002 inventories; annual 36-km emissions for CMAQ and CAMx PSAT Plan02b 2 04/2006 Version B of the baseline 2002 inventories; annual 36-km emissions for CMAQ Base2018b 2 05/2006 Version B of the base 2018 inventories; annual 36-km emissions for CMAQ Plan02c 2,10 06/2006 Final baseline 2002 inventories; annual 36-km emissions for CMAQ and CAMx PSAT Base2018c 2 07/2006 Version C of the base 2018 inventories; summer season only and CAMx Zero WBD 5 04/2006 Base 2002 zero-out windblown dust sensitivity Small fire 7a 02/2006 Base02a with small fires removed; annual 12-km emissions for CMAQ Fire plume rise 7b 09/2006 Actual 2002 WRAP fire inventories; episodic sensitivity on alternative plume rise algorithm
10 Plan02 and Base2018 Planning 2002 baseline emissions typical year emissions for comparison to 2018 modeling Baseline fires, historical averaged temporal profiles for EGUs, Base02 emissions for all other sectors Base case 2018 future year emissions Inventories projected to 2018 Baseline fires and historical averaged temporal profiles for EGUs
11 Small Fire Sensitivity Derived from base 2002 fires Remove all wild and prescribed fires < 100 acres in woodland and < 300 acres in grassland Keep all agricultural and non-federal rangeland prescribed fires 12-km resolution; July and November Period Table 1. Mass emissions of NO x and primary PM 2.5 from small and large fires in July and November 2002 Species Mass Emissions (tons/month) Total Emissions Large Fires Small Fires Percent from Small Fires July NO x 56,434 54,959 1, % PM , ,631 5, % November NO x 7,789 3,608 4, % PM ,024 8, %
12 Natural Emissions Derived from simulation Base02a Emissions components: Biogenic Ammonia (WRAP, CENRAP, MRPO) Natural area sources (e.g. wildfires and deer) Natural fires: wildfire, wildland fire use, natural prescribed fires Windblown dust
13 Fire Plume Rise Sensitivity Objective: Compare the vertical emissions distribution for fires using two plume rise algorithms: the FEJF Approach the SMOKE-Briggs Approach For additional info:
14 Tons/h Tons/h Fire Plume Rise Sensitivity Hourly Emissions Distribution Colorado Wild Fire FEJF Profile SB Profile Time (h) Time (h) Max Layer Hieght (m) Max Layer Hieght (m) L12 L11 L10 L9 L8 L7 L6 L5 L4 L3 L2 L1 Max LH L18 L17 L16 L15 L14 L13 L12 L11 L10 L9 L8 L7 L6 L5 L4 L3 L2 L1 Max LH
15 Fire Plume Rise Sensitivity Daily Emissions Fractions per Layer layer CO_FEJF CO_SB AZ_FEJF_WF AZ_SB_WF AZ_FEJF_RX AZ_SB_RX OR_FEJF_WF OR_SB_WF OR_FEJF_RX OR_SB_RX CO FEJF: 45% in surface layer, 45% above 2462 m. CO SB: most emission between m daily fraction CO_FEJF CO_SB AZ_FEJF_WF AZ_SB_WF AZ_FEJF_RX AZ_SB_RX OR_FEJF_WF OR_SB_WF OR_FEJF_RX OR_SB_RX
16 Fire Plume Rise Sensitivity Results 1. The FEJF approach places a large fraction of fire emissions in the surface layer. The remaining emissions are consistently located at higher layers compared to the SB approach. 2. The plume bottom in the FEJF approach depends on the fire size; it can be as high as several thousand meters above the first layer. In the SB approach the plume bottom is always in layer With the FEJF approach, most of the emissions go in the first layer. In the SB approach most of the emissions go in the mid to upper layers.
17 Fire Plume Rise Sensitivity Conclusions The SB approach underestimates smoldering emissions, which should be located in the first layer. Since emissions occur during the day time when the boundary layer tends to be well mixed, model results might be insensitive to the vertical location of emissions within the boundary layer. To the extent that the FEJF approach locates emissions above the boundary layer, it might have smaller near field impact and greater long range transport. If fires occur at times when the boundary is shallow or poorly mixed, the FEJF approach might have a greater near field impact and less long range transport. SB approach would have greater near field impacts than FEJF if SMOKE is modified to locate a larger smoldering fraction in layer 1.
18 Fire Plume Rise Sensitivity Conclusions (2) Air quality modeling using CMAQ or CAMx is needed to determine of the two approaches would have significantly different air quality impacts, however, the current approach using FEPS is not feasible to model a large number of events. Because differences in near field versus long range transport likely depend on meteorology, it would be necessary to model a large variety of conditions to determine if the choice of FEJF or SB results in consistently different visibility impacts. We need empirical data of actual fire plumes to evaluate which approach is more correct.
19 BART Selection Objective: Identify the BART-eligible sources within the WRAP stationary-point-source inventory Solicit the help of the WRAP states and tribes to identify BART sources by developing spreadsheets that crossreference information we have about BART eligibility with the records contained in the emissions inventories. Initial approach: Use SCC-based BART eligibility criteria in the report Identification of BART-eligible Sources in the WRAP Region (ERG, 2006) to flag sources in the WRAP 2018 point-source inventory as BART-eligible. Current approach: revise the sources selected in the ERG report with information provided by the WRAP states and tribes in memos sent in 2006 Colorado as a case study
20 WRAP RMC Emissions Modeling and Analysis Lessons Learned Addressing errors in the emissions: determining significance Shortcomings in systematic QA/QC The perils of new emissions modeling technologies Important general issues Correct application of inventories and ancillary emissions data Mixing datasets = mixing assumptions New emissions data = potential problems Managing large datasets to accommodate computing/software resources Inventory overlaps Other source-specific issues in the 2006 WRAP-RMC report Discussion
21 Source Apportionment Modeling Objective is to assess the contributions of different geographic source regions (e.g., states) and source categories to current (2002) and future (2018) visibility impairment at Class I areas: obtain improved understanding the causes of the impairment and which states are included in the area of influence (AOI) of a given Class I area; to determine which source categories contributing to the AOI for each Class I area are changing, and by how much, between the and 2018 base case, by varying only controllable anthropogenic emissions between the 2 PSAT simulations; and identify the source regions and emissions categories that, if controlled, would produce the greatest visibility improvements at a Class I area.
22 CAMx PSAT Selected CAMx Particulate Source Apportionment Technology (PSAT) because of mass conservation problems in earlier CMAQ/TSSA versions Both CAMx and CMAQ had acceptable performance in the 2002 base case model performance evaluation. PSAT and TSSA use a similar approach results from updated CMAQ/TSSA were also used to compare and QA the PSAT results
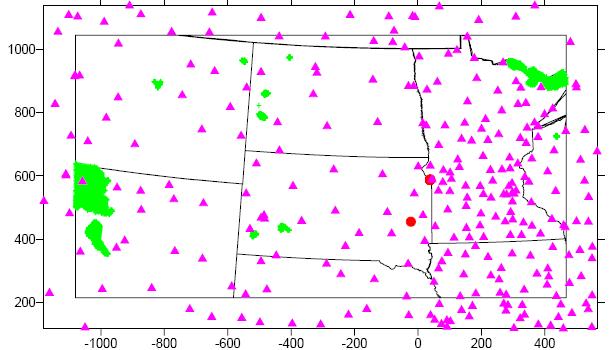
23 PSAT Source Regions Table 4-4. WRAP CAMx/PSAT source regions cross-reference table. Source Region ID Source Region Description 1 Source Region ID Source Region Description 1 1 Arizona (AZ) 10 South Dakota (SD) 2 California (CA) 11 Utah (UT) 3 Colorado (CO) 12 Washington (WA) 4 Idaho (ID) 13 Wyoming (WY) 5 Montana (MT) 14 Pacific off-shore & Sea of Cortez (OF) 6 Nevada (NV) 15 CENRAP states (CE) 7 New Mexico (NM) 16 Eastern U.S., Gulf of Mexico, & Atlantic Ocean (EA) 8 North Dakota (ND) 17 Mexico (MX) 9 Oregon (OR) 18 Canada (CN)
24 PSAT Source Regions
25 PSAT Emissions Categories Emissions Source Groups Table 4-5. WRAP CAMx/PSAT emissions source groups. Low-level Sources 1 Low-level point sources (including stationary offshore) Elevated Sources Elevated point sources (including stationary off-shore) 2 Anthropogenic wildfires (WRAP only) Anthropogenic wild fires (WRAP only) 3 Total mobile (on-road, off-road, including planes, trains, ships in/near port, off-shore shipping) 4 Natural emissions (natural fire, WRAP only, biogenics) 5 Non-WRAP wildfires (elevated fire sources in other RPOs) 6 Everything else (area sources, all dust, fugitive ammonia, nonelevated fire sources in other RPOs) Natural emissions (natural fire, WRAP only, biogenics) Non-WRAP wild fires (elevated fire sources in other RPOs)
26 PSAT Labels for Emissions Categories Type Source Category ID Table 4-6. PSAT tracer source tags. ICON ICON Initial conditions BCON BCON Boundary conditions Emissions MV_* PT_* ANF_* NTWF_* NWF_* AR_* Source Types On/off-road mobile sources from each source region Point sources from each source region Anthropogenic fire sources from each source region Natural fire sources from each source region Non-WRAP fire sources from each source region Area sources from each source region
27 PSAT Post Processing Prepared spatial plots of monthly average source contributions as spatial plots. Prepared bar plots at each receptor site showing largest contributors on the average of the worst 20%, best 20% days, and monthly averages. Results provided to TSS for additional processing and display.

28 PSAT Results Spatial Plots
29 PSAT Results Bar plots

30 Boundary Contribution (from GEOSCHEM)
31 PSAT Boundary Contributions Boundary conditions were the single largest contributor to sulfate at most WRAP sites (although typically less than half of the total sulfate). Boundary conditions were derived from GEOSCHEM global simulation this is our best available estimate of international transport of PM2.5. CMAQ/TSSA and CAMx/PSAT gave similar results for the relative order of contributors to haze: Boundary conditions were ranked slightly lower as a contributor in CMAQ than in CAMx, but they were a major source in both models. similar boundary contributions in other RPOs but more important in WRAP because of the relatively clean WRAP conditions. we believe the large boundary contribution estimates are credible.
32 PSAT Summary PM2.5 from the boundaries was the single largest contributor at many sites and was among the largest contributors to haze at all sites. Local sources (within the state or in neighboring states) were the largest contributors to haze at any given site. The sum of smaller sources from distant regions was a smaller but significant contribution to haze at all sites.
33 WRAP BART CALPUFF Modeling Performing CALMET/CALPUFF BART modeling for AZ, AK, NM, NV, SD and UT 2001, 2002 and 2003 with 36 km MM5 data for continental US States 2002 with 15 km MM5 data for Alaska Also doing 2001, 2002 & 2003 CALMET for MT Completed CALMET/CALPUFF modeling for all States except AZ Waiting for BART-eligible source list for AZ States currently reviewing results Update to States to determine BART eligibility and when to release results

34 BART CALPUFF Modeling Domains

35
36 Alaska BART Modeling 2002 with 15 km MM5 2 km Grids 2 Class I Areas Surface Met
37 Next Steps on BART Modeling Approve release of completed BART modeling. Finish BART modeling for AZ. Redo MT CALMET modeling.
38 Visibility Projections in 2018 RHR goal is defined as: 1) Visibility improvement toward natural conditions for the 20% worst visibility days. 2) No worsening in visibility for the best 20%. We used CMAQ to model visibility for a 2002 typical year and for a 2018 base case that includes on the books emissions reductions.
39 CMAQ 2002 Typical vs 2002 Base Largest change was in from actual to typical fires, resulting in large changes in OC concentrations.

40 CMAQ 2002 Typical vs 2002 Base
41 CMAQ 2002 Typical vs 2002 Base
42 CMAQ 2018 Base vs 2002 Typical Effects of emissions growth and on the books emissions reductions Mostly small reductions in 2018 in all species Reductions in CENRAP emissions show benefits in eastern tier WRAP states.
43 2018 Base vs 2002 Typical: Sulfate
44 2018 Base vs 2002 Typical: nitrate

45 2018 Base vs 2002 Typical: PM2.5

46 2018 Base vs 2002 Typical: deciviews
47 Procedure for Visibility Projections Start with observed Worst 20% visibility days from Baseline period Use CAMQ 36 km modeling results for 2002 meteorological year and the 2002 and 2018 base case emissions scenarios to scale the Baseline to 2018 Relative Response Factors (RRFs) Ratio of 2018 to 2002 modeling results Class I area and PM species specific
48 2018 Visibility Projections Daily PM species converted to light extinction visibility impairment using Extinction Coefficients New and Old IMPROVE equation WRAP is adopting New IMPROVE equation for visibility projections Different visibility projection approaches being investigated 2064 Natural Conditions target: Use EPA default for Old and VIEWS values for New IMPROVE equation
49 Glide Path to Natural Conditions Start with observed Worst 20% Days visibility Baseline 2064 visibility end point is Natural Conditions Uniform Rate of Progress (URP) linear line from Baseline to 2064 Natural Conditions In deciview (dv) Where Glide Path passes through 2018 is URP Goal
50 Uniform Rate of Reasonable Progress Glide Path Grand Canyon NP - 20% Worst Days 15 Haziness Index (Deciviews) Uniform Rate of Progress (URP) Linear Glide Path Baseline = dv 2018 ORP Goal = dv Deciview Reduction Needed = 1.19 dv Year Glide Path Natural Condition (Worst Days) Observation
51 Approaches for RRFs (1) Method 1: Average RRF Approach 2006 EPA Guidance: For each Class I area and Observed Worst/Best 20% days from 2002 take the ratio of the average modeled 2018 to 2002 PM species concentrations N N 1 SO4 ij (2018) SO4ij (2018) N i= 1 i= 1 RRFj ( SO4) = = N N 1 SO4 ij (2002) SO4ij (2002) N i= 1 i= 1 Applied to observed daily PM components for each Worst/Best 20% day from each year from the Baseline, calculate daily Bext/dv, annual dv and 2018 projected dv same as before
52 Concern 2002 May Not Capture Seasonal Variations Agua Tibia, CA (AGTI1) Distribution of 20% Worst Days by Year (IMPROVE data) Month Salt Creek, NM (SACR1) Distribution of 20% Worst Days by Year (IMPROVE data) Month Badlands (BADL1) Distribution of 20% Worst Days by Year (IMPROVE data) Month
53 Approaches for RRFs (2) Method 2A: Average Quarterly RRF Approach Similar to Average RRF Approach only calculate separate RRFs for each Quarter of the year using the observed Worst/Best 20% days for each Quarter in 2002 Allows for seasonal variations in RRFs, has similarities to 24-Hour PM 2.5 projection approach
54 Approaches for RRFs (3) Method 2B: Average Monthly RRF Approach Calculate separate RRFs for each Month of the year using the observed Worst/Best 20% days for each Month in 2002 Allows for seasonal variations in RRFs, Results follow for: 2002 Base C (Plan02c) 2018 Base B (Base18b) CMAQ km annual simulations
55 Uniform Rate of Reasonable Progress Glide Path Grand Canyon NP - 20% Worst Days Haziness Index (Deciviews) Old IMPROVE Equation Method 1: Average RRF Target Reduction = 1.19 dv Modeled Reduction = 0.33 Percent of Target Reduction = 28% Year Glide Path Natural Condition (Worst Days) Observation Method 1 Prediction
56 15 Uniform Rate of Reasonable Progress Glide Path Grand Canyon NP - 20% Worst Days New IMPROVE Equation Haziness Index (Deciviews) Percent of Reduction Target = 33% Year Glide Path Natural Condition (Worst Days) Observation Method 1 Prediction
57 2018 Visibility Results (1 of 3) 100% 90% 80% Method 1 predictions for Colorado Plateau and Desert Southwest sites base18b old algorithm base18b new algorithm 70% 60% 50% 40% 30% 20% 10% 0% BRCA1 CANY1 GRCA2 MEVE1 SAPE1 WEMI1 ZION1 BAND1 BOAP1 CHIR1 GICL1 GRSA1 IKBA1 SACR1 SAGU1 SIAN1 WHIT1 WHPE1 Percent of target reduction achieved Colorado Plateau Desert Southwest
58 2018 Visibility Results (2 of 3) Method 1 predictions for Pacific Northwest and California sites 100% 90% base18b old algorithm base18b new algorithm 80% 70% 60% 50% 40% 30% 20% 10% 0% HECA1 KALM1 MOHO1 MORA1 NOCA1 OLYM1 PASA1 SNPA1 STAR1 THSI1 WHPA1 AGTI1 BLIS1 DOME1 HOOV1 JOSH1 LAVO1 PINN1 REDW1 SAGA1 SAGO1 YOSE1 Percent of target reduction achieved Pacific Northwest California
59 2018 Visibility Results (3 of 3) 100% Method 1 predictions for North, Great Basin and Rockies sites 90% base18b old algorithm base18b new algorithm 80% 70% 60% 50% 40% 30% 20% 10% 0% BADL1 CABI1 GAMO1 LOST1 MELA1 MONT1 SULA1 THRO1 ULBE1 WICA1 CRMO1 JARB1 SAWT1 BRID1 NOAB1 ROMO1 WHRI1 YELL2 Percent of target reduction achieved North Great Basin Rockies
60 2018 Visibility Projections Conclusions The RRFs for the SO4, NO3, EC, OC, and Soil are used in future visibility projections. Coarse Mass (CM) was judged to be unreliable and the RRF for CM will be set to 1.0. Almost half of the WRAP western U.S. Class I areas, 2018 visibility projections could not be made due to incomplete data. Using the standard EPA approach for projecting 2018 visibility, most if not all WRAP Class I areas will fail to meet the 2018 URP goal due to the contributions of uncontrollable sources such as wildfires, dust, and international transport.
61 Alternative Approaches for Visibility Projections Alternative RRF approaches Method 1: Average of 2002 W20% days EPA Default Methods 2A & 2B Quarterly & Monthly W20% Separate Glide Paths for visibility and for extinction due to different PM components SO4, NO3, EC, OC and Soil
62 Tech Support and Data Transfer Webpage is being used to tracks requests for data transfer: Still need to approve release of BART modeling data to other stakeholders (data is being reviewed by states now).