National PRESENTATION Water & Sanitation TITLE Master Plan A Call to Action. Date CESA Indaba Engineering the Future Now Sesion 3: Water Security
|
|
|
- Emery Elliott
- 5 years ago
- Views:
Transcription


1 National PRESENTATION Water & Sanitation TITLE Master Plan A Call to Action Presented by: Name Surname Directorate Date CESA Indaba Engineering the Future Now Sesion 3: Water Security Presented by: Trevor Balzer DDG Strategic and Emergency Projects 5 March
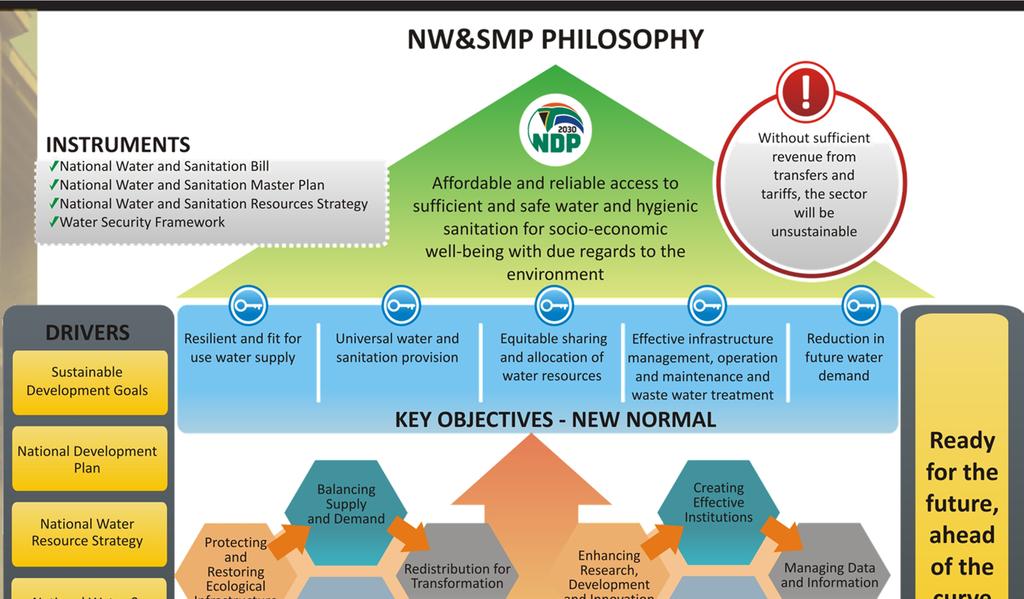
2 Context The National Water and Sanitation Master Plan (NW&SMP): Call to Action seeks to rally all water sector stakeholders in South Africa to work together to address the challenges confronting the water and sanitation sector and to ensure that we get ahead of the curve in relation to both current and future challenges. This includes ensuring that by 2030 we have a sufficient reserve of supply to take us safely into the future and that we meet Sustainable Development Goal 6: Ensure access to water and sanitation for all. This Master Plan (driven by a sense of urgency) sets out: prioritised actions and investments the country must implement between now and 2030 to overcome challenges and ensure a water secure future supporting inclusive development across the country; to ensure that universal sanitation coverage protects the health of our people. roles and responsibilities, targets, timeframes and how performance will be monitored; prioritised actions with responsibilities and timeframes, against which relevant players in the sector can be held accountable by Cabinet, Parliament and the public. 2
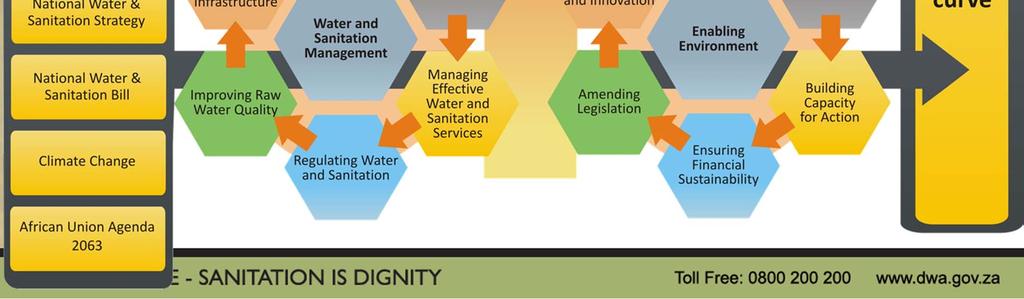
3 Building a Water Secure Future The NW&SMP is based on five key objectives that define a new normal for water and sanitation management in South Africa: Resilient and fit for use water supply Universal water and sanitation provision Equitable sharing and allocation of water resources Effective infrastructure management, operation and maintenance and Reduction in future water demand. These five objectives enable the achievement of the National Development Plan s Vision for 2030, of affordable and reliable access to sufficient and safe water and hygienic sanitation for socio economic growth and well being, with due regard to the environment. 3
4 4
5 Context South Africa is facing a water crisis caused by insufficient water infrastructure maintenance and investment, recurrent droughts driven by climatic variation, inequities in access to water and sanitation, deteriorating water quality, and a lack of skilled water engineers. This crisis is already having significant impacts on economic growth and on the wellbeing of everyone in South Africa. 5
6 Context 5.3 million households (35%) do not have access to reliable drinking water million people do not have access to safe sanitation Only 63 % of households have access to a reliable water supply service 56% of waste water treatment works and 44% of water treatment works are in a poor or critical condition. 11% are dysfunctional A R33 billion funding gap each year for the next 10 years must be closed through improved revenue generation and reduced costs Only 5% of agricultural water is used by black farmers 41% of municipal water does not generate revenue. 35% is lost through leakage 48% of the remaining wetlands are critically endangered South Africa is facing a projected 17% water deficit by 2030 if it doesn t adopt a new normal 6
7 Achieving water security in South Africa requires a new normal: a significant paradigm shift that recognises the limitations of water availability and the need for financial sustainability addresses the real value of water ensures equitable access to limited water resources delivers reliable water and sanitation services to all focuses on demand management and alternative sources of water considers the impacts of climate change and addresses declining raw water quality The `new normal The new reality: Water will become more expensive Everyone MUST use less water for the same activities Everyone except the indigent must pay for services 7

8 Underscoring the need for urgency and focus, the Call to Action, as the `front end of the NW&SMP has clustered the key challenges & solutions as follows Section 1 Section 2 8
9 KEY CHALLENGE Balancing supply and demand Our water availability could deteriorate rapidly as our supply contracts and demand escalates due to growth, urbanization, inefficient use, degradation of wetlands, water losses and the negative impacts of climate change Based on projections, by 2030, the water deficit could be between and million m3/a, a gap of about 17% of available surface and ground water. This will require a Business Unusual approach to close the gap Serious interventions should be made to reduce demand by improving efficiency, adopting new technologies and reducing losses (especially in the Agriculture and Municipal sectors) 9


10 National Rainfall and Potential Evaporation Note skewed distribution of rainfall, and decrease westwards while evaporation rates increase westwards With Climate Change it is highly probable that this distribution will intensify; the west will get drier and although the east will get wetter there will also be less water available since bigger and more infrequent flood events may occur, which means the more water cannot be harvested


11 Current water use by sector 11
12 Balancing supply and demand Agricultural consumption is largely unmetered, and there are co concerns about unauthorised abstraction and water wastage in the sector. In addition, agricultural users pay a much lower tariff than other users of untreated water and the relatively cheap water has not incentivised the adoption of water efficient irrigation practices. Average municipal water use in South Africa is around 237 litres per person per day compared to the world average of 173 litres per person per day. Since large numbers of South Africans use very small amounts of water per day, this average masks the high water use by privileged sectors of the population. The high water use is partly due to municipal non revenue water which is currently at an unacceptably high 41%. Municipalities are losing about 1660 million m³ per year through Non Revenue Water. At a unit cost of R6/m3 this amounts to R9.9 billion each year There is significant opportunity to reduce water demand in the municipal and irrigation sectors. 12

13 Being ready for the future means making a diversified water mix a reality in South Africa 13
14 Balancing supply and demand Water demand must be reduced by improving efficiency, adopting new technologies, and reducing losses through water awareness, and strict regulation and incentives. Average domestic consumption must be reduced to 175 litres per person per day by On the supply side, there is a need to move from the current water mix which is strongly dominated by surface water, with some groundwater and return flows to a water mix that includes increased groundwater use, re use of effluent from waste water treatment plants, water reclamation, as well as desalination and treated acid mine drainage (AMD). By 2040, treated acid mine drainage and desalinated seawater will make a significant contribution to South Africa s water mix, ground water usage will increase, and the over reliance on surface water will reduce. South Africa has four internationally shared river basins that contribute 45% of the country s total river flow. These resources must be shared equitably with neighbouring states 14
15 Water use sectors Balancing supply and demand Without demand management interventions 2030 water requirements projections (million m 3 ) With urban losses reduced from 35% to 15% With domestic demand reduced from 237 l/c/d to 175 l/c/d Agriculture (irrigation and livestock watering) Municipal (industries, commerce, urban and rural domestic) Strategic/Power generation Mining and bulk industrial International obligations Afforestation Total water requirements (2030) Total water available (2017) Increased surface water storage Increased groundwater use Desalination 365 Re use 300 Treated AMD 55 Total water available (2030) Deficit/surplus Deficit/surplus 5% 0% 8% 15
16 Managing effective water and sanitation services StatsSA General Household Survey (GHS): 89% households have access to operational services, while Reliability is only at 63% Some 11% of water supply schemes are fully dysfunctional. Approximately 56% of the over WWTW and approximately 44% of the 962 WTWs are in poor or critical condition and in need of urgent rehabilitation. The capacity of WSA s to operate, maintain and manage assets for existing infrastructure needs urgent attention The failure of municipalities to provide reliable water and sanitation services is largely due to the lack of capacity, the misappropriation of funding, and/or the lack of and funding to operate, maintain, refurbish and manage water and waste water infrastructure assets properly. 16
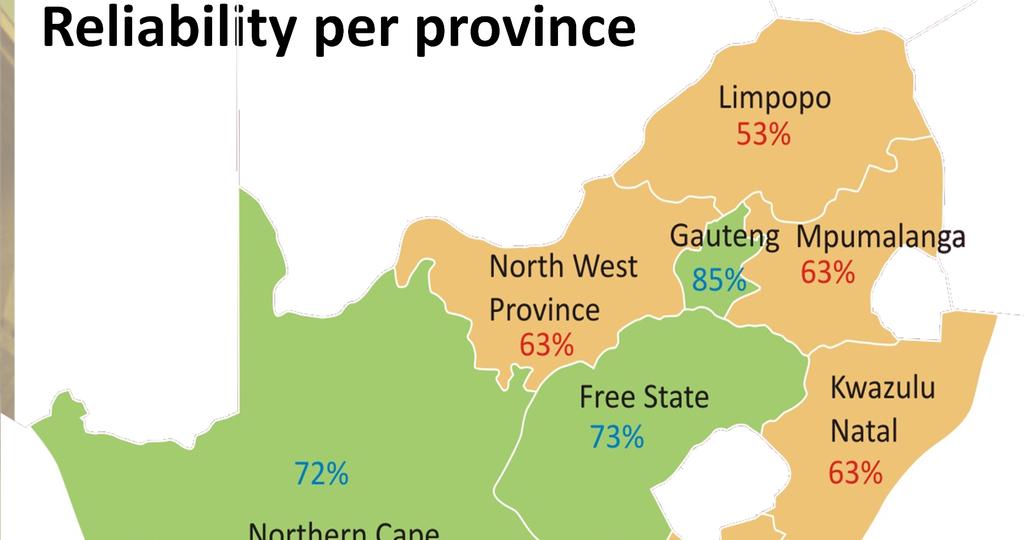
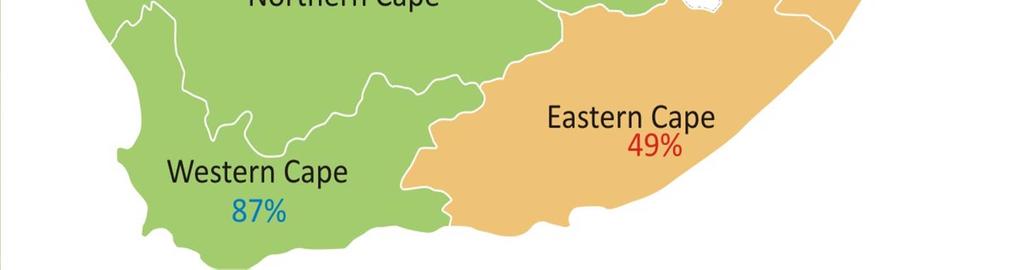
17 Reliability per province 17
18 Delivery trends (Stats SA) Current access to sanitation services is 80% on average (50% in some LM s). We have to aim at an increase to 90% by 2019, and 100% by

19 Drivers: Managing effective water and sanitation services Some 77% of rural households are indigent and are not required to pay for municipal services South Africa s population is rapidly urbanising, placing strain on service delivery in municipalities The SDG s and the aspirations of the NDP, the national targets for water supply and sanitation are as follows: Achieve universal, sustainable sanitation provision: 90% by 2020 and 100% by 2030 Achieve universal, sustainable and reliable water supply provision: 90% by 2019 and 100% by Targets must be met in a sustainable manner, with effective operation and maintenance, so that the services provided are reliable over time, and are accessible to all people, including those living with disabilities. The constitutional responsibility water supply and sanitation lies with 144 municipalities that are water services authorities (WSA), at least 33% of these municipalities are regarded as dysfunctional and more than 50% have no or very limited technical staff. Aging, poor quality and poorly maintained infrastructure is contributing to high levels of water wastage and pollution of rivers and groundwater with sewage. 19
20 Implementation Plan The Master Plan can still be viewed as work in progress A multi year, detailed schedule of actions is being developed for implementation over the period 2018 to This schedule of actions will be prioritised and refined in consultation with all stakeholders during the proposed Mini Phakisa scheduled to take place towards the end of August


21 ARE YOU UP TO THE CHALLENGE? Download NW&SMP documents from Thank you 21