Sustaining health in a changing environment: Examples from urban environmental health
|
|
|
- Samson Gilmore
- 5 years ago
- Views:
Transcription
1 Sustaining health in a changing environment: Examples from urban environmental health Michael Brauer The University of British Columbia School of Population and Public Health CPHA 2012 Annual Conference June 13, 2012 Edmonton, AB
2 Making a difference in environmental public health The population health lens Interventions If you are trying something new evaluate it!! Assessment of cost effectiveness Consider costs of implementing an ineffective measure Translating research to change Tools to empower change
3 Individual and population risk Major challenge in communication of risks and relative impacts of policies Nawrot et al, Lancet 2011
 generated by Federal")
4 The benefits of policies to address population risk Air quality regulations benefit:cost ratios ~4:1 30:1 Clean air rules responsible for majority of ALL estimated benefits (and costs) generated by Federal regulation
5 Fine-Particulate Air Pollution and Life Expectancy in the United States. Arden Pope, III, Ph.D., Majid Ezzati, Ph.D., and Douglas W. Dockery, Sc.D N Engl J Med 2009;360: Reductions in air pollution accounted for up to 15% of increased life expectancy (2.7 years) 5
6 Interventions Just because something should work, doesn t mean it will..sometimes, things you don t expect to work, will provide benefits Most effective interventions are prolonged, slow and costly but still costeffective! Non linearity DO THE ANALYSIS! TO DO THE ANALYSIS YOU MUST MEASURE!
7 Interventions Just because something should work, doesn t mean it will..sometimes, things you don t expect to work, will provide benefits Most effective interventions are prolonged, slow and costly but still costeffective! Non linearity DO THE ANALYSIS! TO DO THE ANALYSIS YOU MUST MEASURE!
8 Interventions Just because something should work, doesn t mean it will..sometimes, things you don t expect to work, will provide benefits Most effective interventions are prolonged, slow and costly but still costeffective! Non linearity DO THE ANALYSIS! TO DO THE ANALYSIS YOU MUST MEASURE! Pope et al. Circulation, 2009; EHP, 2011
9 Challenges in intervention assessment Association or causation? Consider impacts of actions focused on other (non health) goals......otherwise may miss co benefit opportunities requires multisectoral partnerships Evaluate unintended health consequences of other actions

10 22% decrease in peak weekday morning traffic counts 11 44% decrease in asthma acute care events Friedman MS, Powell KE, Hutwagner L, Graham LM, Teague WG. Impact of Changes in Transportation and Commuting Behaviors During the 1996 Summer Olympic Games in Atlanta on Air Quality and Childhood Asthma. JAMA. 2001;285:

11 Similar reductions in ozone in surrounding region. Both meteorologic conditions and reduced traffic may have played a role in the observed reduction in ozone in Atlanta. Little or no evidence of reduced ED visits during the Olympics. Intervention strategy not sustainable as a pollutionreduction strategy
12 Challenges in intervention assessment Association or causation? Consider impacts of actions focused on other (non health) goals......otherwise may miss co benefit opportunities requires multisectoral partnerships Evaluate unintended health consequences of other actions
 and low birth (11.")

13 E Z pass and premature birth Reductions in traffic congestion generated by E Z Pass reduced incidence of prematurity (10.8%) and low birth (11.8%) among mothers within 2km of a toll plaza Currie J, Walker R. TRAFFIC CONGESTION AND INFANT HEALTH: EVIDENCE FROM E-ZPASS. Working Paper NATIONAL BUREAU OF ECONOMIC RESEARCH
14 Challenges in intervention assessment Association or causation? Consider impacts of actions focused on other (non health) goals......otherwise may miss co benefit opportunities requires multisectoral partnerships Evaluate unintended health consequences of other actions
:387-9; Mazzi E.")
15 Reduction in fuel use, CO 2 emissions Increase in particle emissions 90 additional air pollution deaths / year Changes in vehicle mass distribution Missed opportunity for simultaneous reduction in vehicle crash fatalities Mazzi EA, Dowlatabadi H. Air quality impacts of climate mitigation: UK policy and passenger vehicle choice. Environ Sci Technol Jan 15;41(2):387-9; Mazzi E. An integrated assessment of climate mitigation policy, air quality and traffic safety for passenger cars in the UK. PhD Thesis. UBC


16 Complex interactions in the built environment Noise Land Use Walkability Frank LD et al AJPM 2004 Gan W et al. Env Res 2012 TRAP *Marshall JD et al. Healthy Neighborhoods: Walkability and Air Pollution. EHP, 2009, 117:
 Traffic influence zones")

17 Traffic proximity Distance to nearest highway/major road (m) Traffic influence zones 32% of Canadian population 36% of primary schools in large Canadian cities Amram et al., 2011; Brauer et al. 2012
18 Road proximity & cardiovascular death Relative Risk of CHD Mortality Constant exposure to traffic Moved close to traffic Moved away from traffic X-axis: Non-exposure to traffic m vs > 50 m Highway 150 m vs > 150 m Highway 150 m Highway or 50 m Major Road a 50 m vs > 50 m Major Road Coronary heart disease (CHD) mortality: Black Carbon Gan WQ, Tamburic L, Davies HW, Demers PA, Koehoorn M, Brauer M. Changes in residential proximity to road traffic and the risk of death from coronary heart disease. Epidemiology Sep;21(5):642 9.
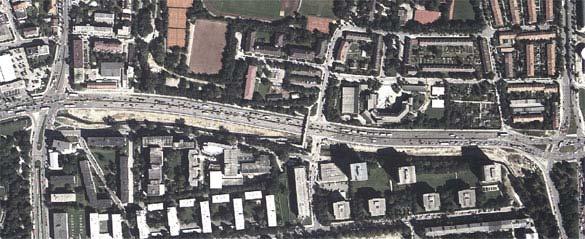


19 Munich Petuelpark

20 Healthy neighborhoods walkability and air pollution HIGH walkability / LOW NO / LOW O 3 LOW walkability / HIGH NO / HIGH O 3 Marshall JD et al. Healthy Neighborhoods: Walkability and Air Pollution. Environmental Health Perspectives, 2009, 117:

21 N=30,007 Hankey S, Marshall JD, Brauer M. Health impacts of the built environment: within-urban variability in physical inactivity, air pollution, and ischemic heart disease mortality. Environ Health Perspect Feb;120(2):


22 Population health benefits from increased physical activity in high walkability neighborhoods may be offset by adverse effects of air pollution exposure.
23 Cycling health impact assessments The Netherlands: Modal shift (Cars Bikes), N=500,000 (short trips) 1 Benefit:risk: ~ 9:1 Physical activity: life-day increase Air pollution: life-day decrease Traffic accidents 5-9 life-day decrease Barcelona Bicing bike share (181,982 users) 2 Benefit:risk: ~ 96:1 Physical activity: 12 deaths avoided Air pollution: 0.13 increased deaths Traffic accidents: 0.03 increased deaths 1 De Hartog et al. 2010, 2 Rojas-Rueda et al., 2011


24 Healthy urban design Separate major roadways from people (air, noise, accidents) Infrastructure to promote active transport 24

25 Cycling route planner Su J, Brauer M, Winters M, Nunes M. Designing a route planner to facilitate and promote cycling in Metro Vancouver, Canada. In press, Transportation Research Part A: Policy and Practice, 2010, 44:

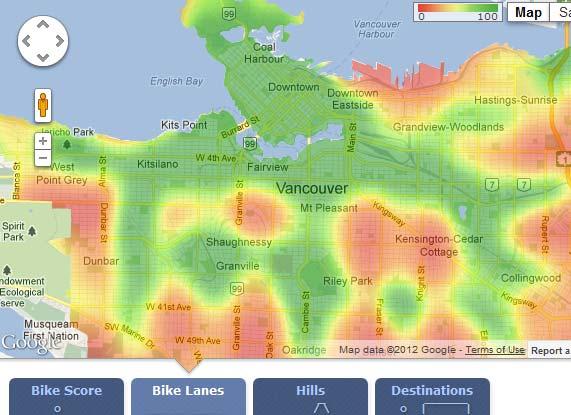
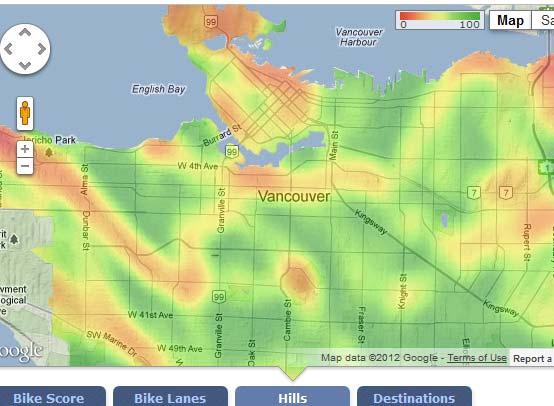
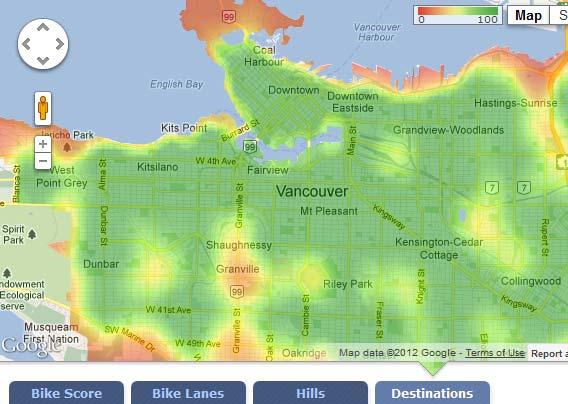
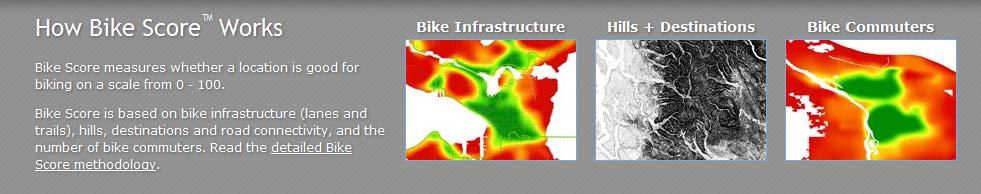
26 Bike Lane Score Hill Score Destinations Score
27 Thank you!