wise use of water, wetlands, and watersheds : Everglades restoration using large treatment wetlands
|
|
|
- Jared Gibbs
- 5 years ago
- Views:
Transcription


1 wise use of water, wetlands, and watersheds : Everglades restoration using large treatment wetlands Gary Goforth, P.E., Ph.D.
2 Overview Everglades Restoration Background Stormwater Treatment Areas Design and construction Performance & Enhancements Adaptive Management


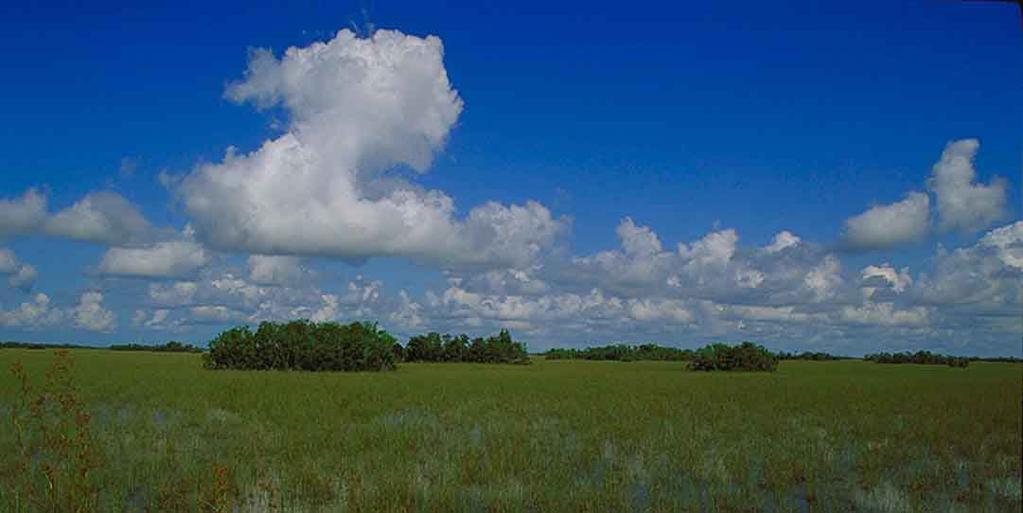
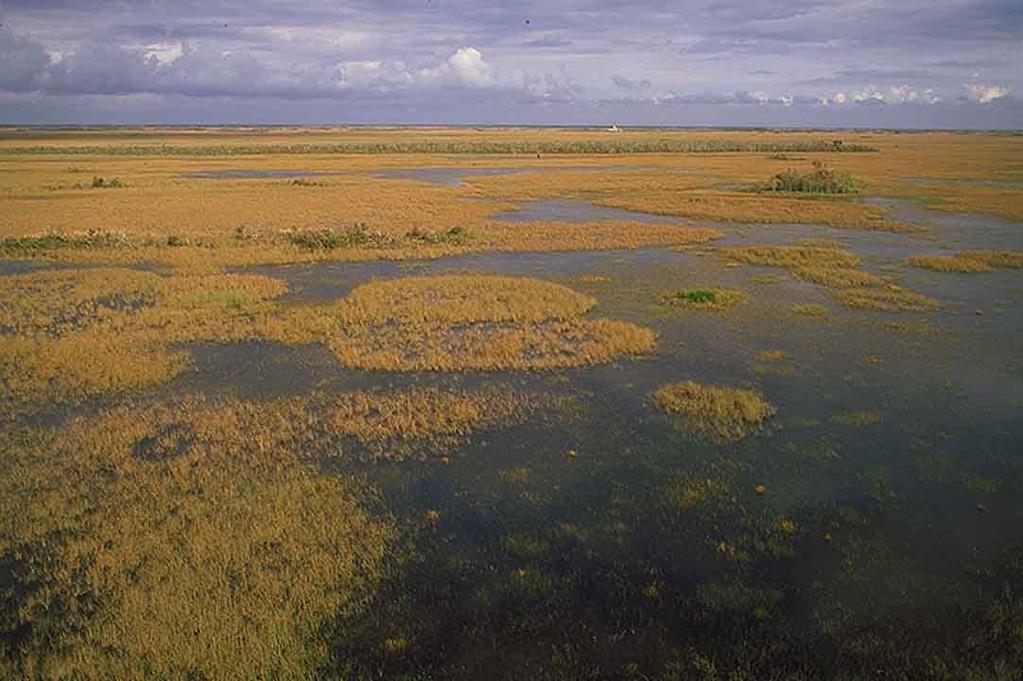
3 The Historic Everglades Ecosystem Sawgrass and tree islands River of Grass Sawgrass prairie & open water sloughs


4 History Settlement in south Florida increased in the late 1800 s Navigation Improvements Everglades Drainage District Initial drainage works improved development opportunities Severe floods & droughts persisted

5 The Central and Southern Florida Project for Flood Control and Other Purposes Initially authorized in 1948 Constructed between 1950 s and 1970 s Operated in accordance with USACE criteria

6 Major Problems Facing Everglades Loss of Everglades habitat Disruption of hydropatterns (i.e., timing, volume & distribution) Repetitive water shortages and salt water intrusion 1.7 billion gallons of water a day wasted to tide Degradation of water quality Exotic plant species
7 Everglades Restoration Two synchronized initiatives: Everglades Forever Act primary focus is water quality, with some quantity and distribution features Comprehensive Everglades Restoration Plan primary focus is water quantity and distribution, with some water quality features This presentation will cover the Everglades Forever Act restoration program
8 Everglades Forever Act 1991, amended 1994 and 2003 Achieve state water quality standards by 12/31/06 Construction Stormwater Treatment Areas Diversion and hydropattern restoration Research Phosphorus criterion research Advanced treatment technology research Regulation Best Management Practices (BMPs)

9 Everglades Construction Project Multiple objectives: Nutrient reduction, Water supply, Hydropattern restoration, Reduce freshwater discharges to estuaries

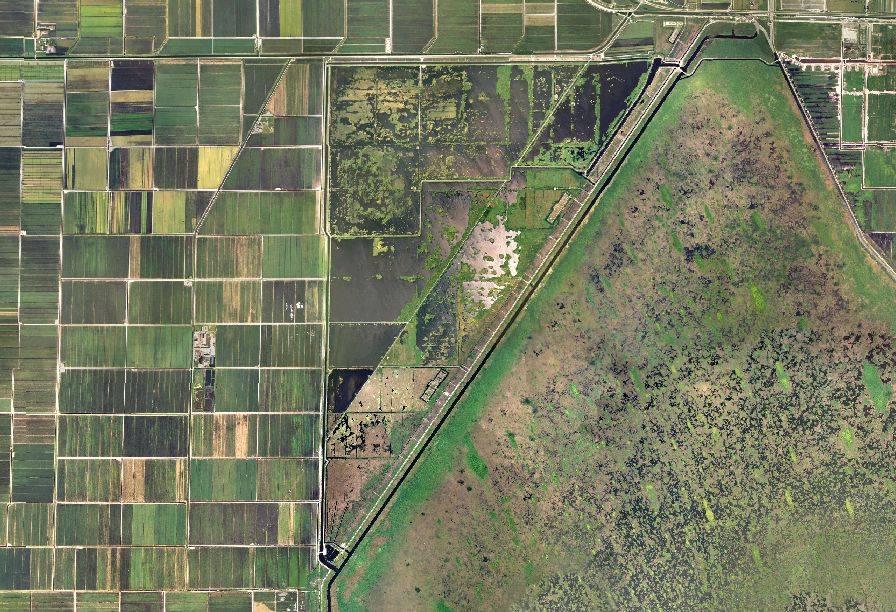
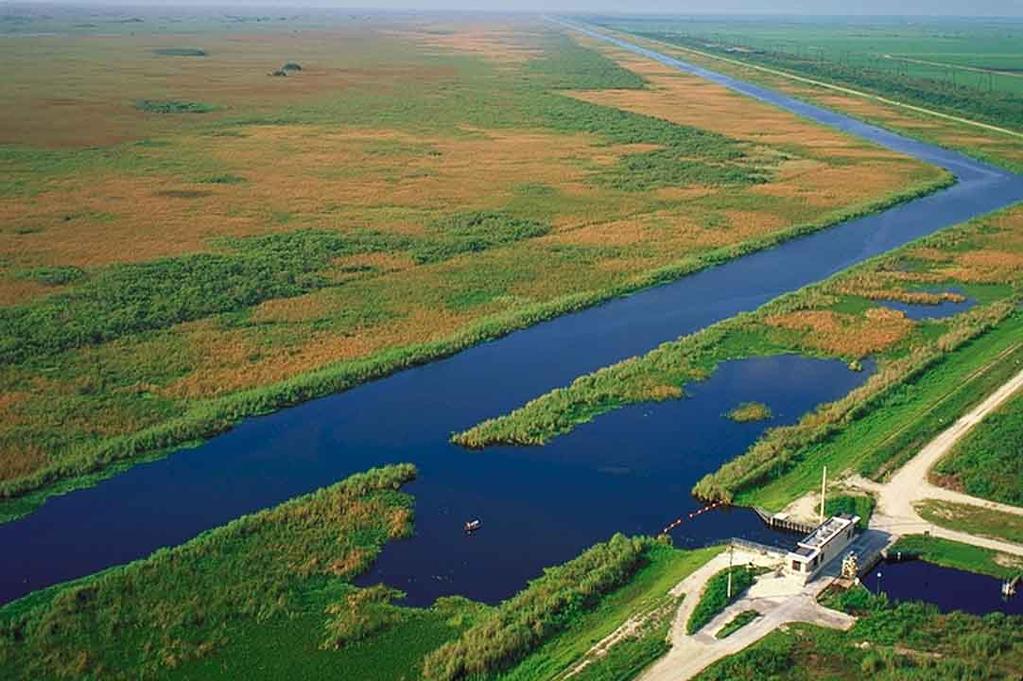
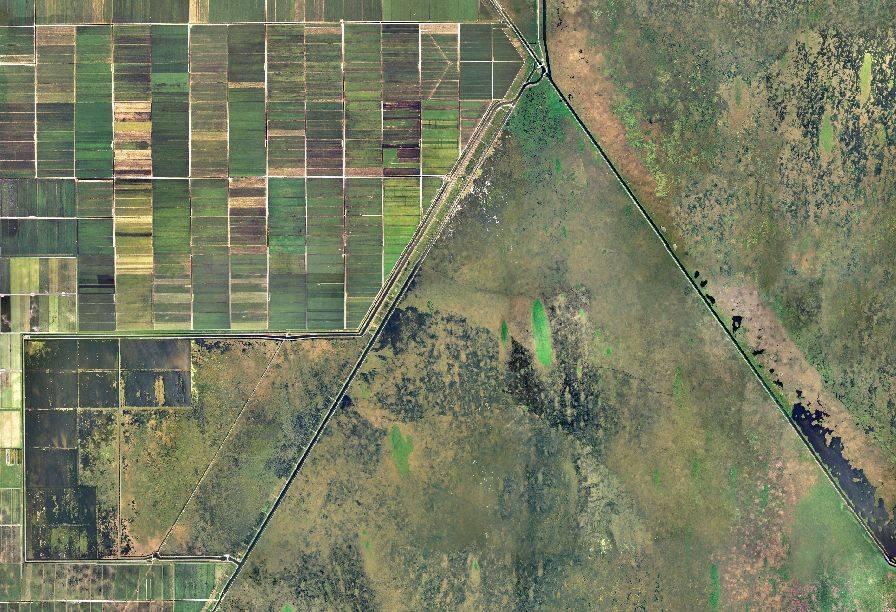
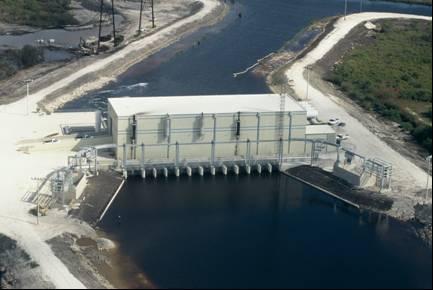
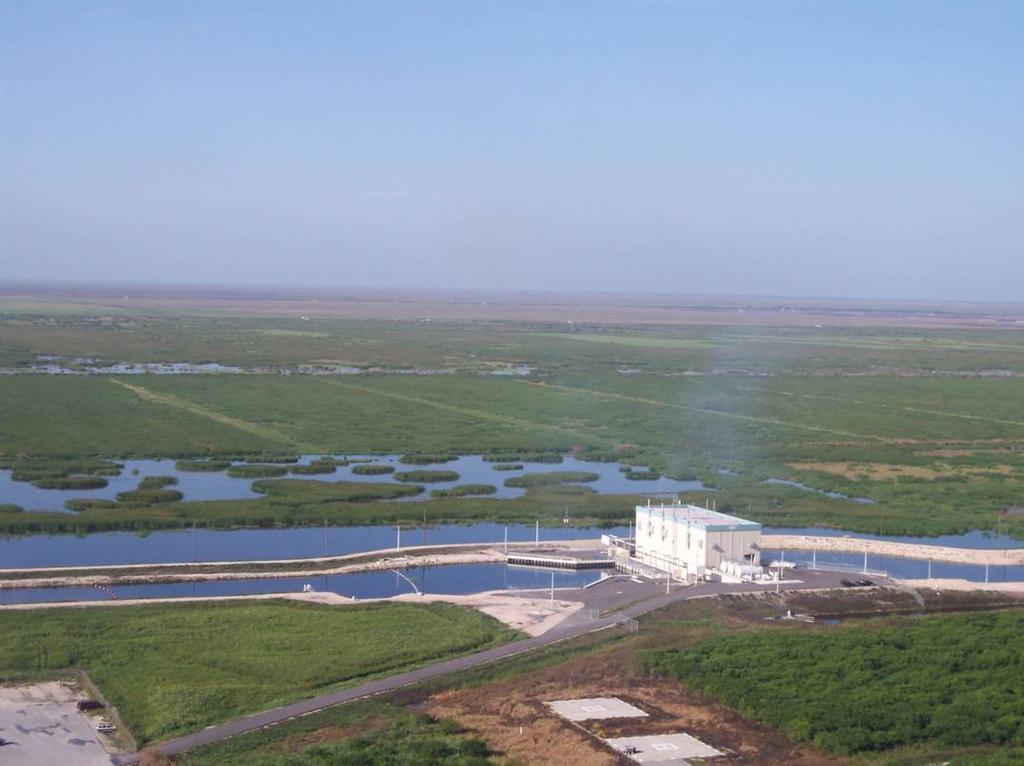
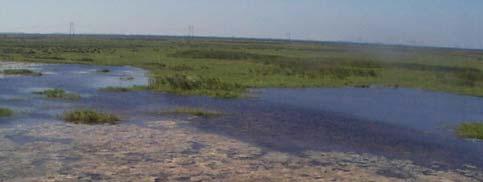
10 Stormwater Treatment Areas Stormwater Treatment Areas STAs are constructed wetlands that remove and store nutrients through plant growth and the accumulation of dead plant material in a layer of peat.


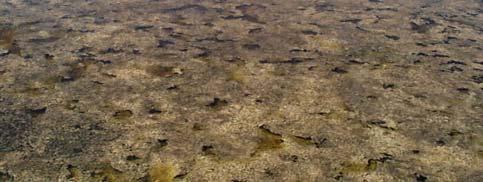
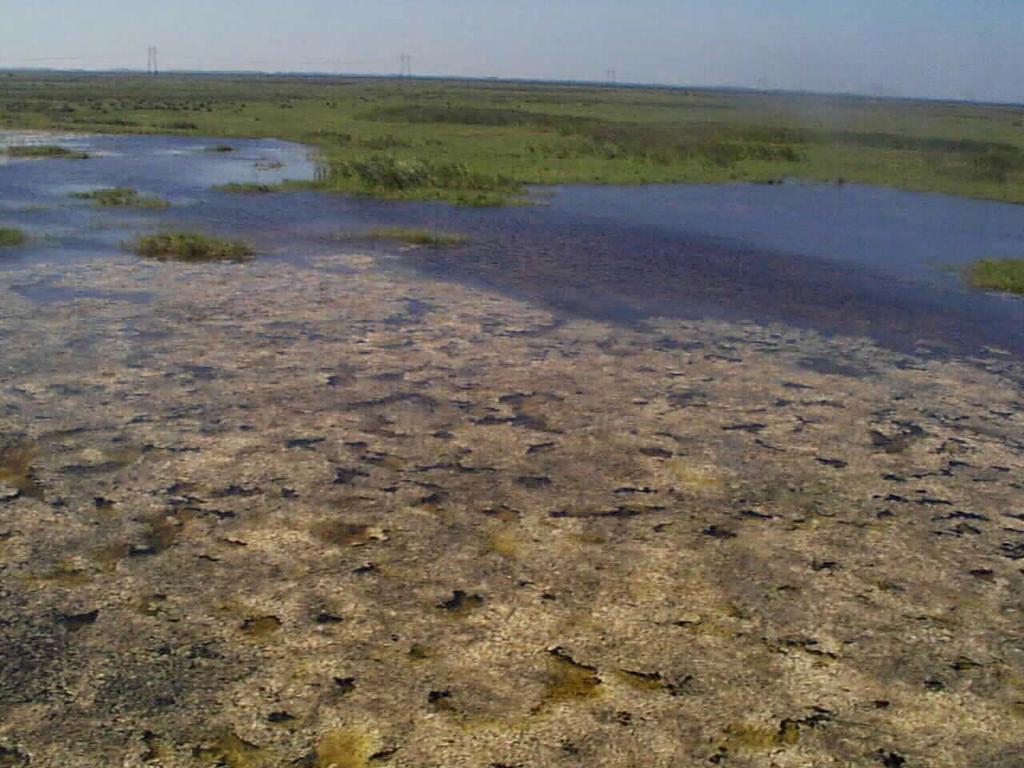
11 Emergent Vegetation Submerged Aquatic Vegetation Periphyton-based Stormwater Treatment Area (PSTA)


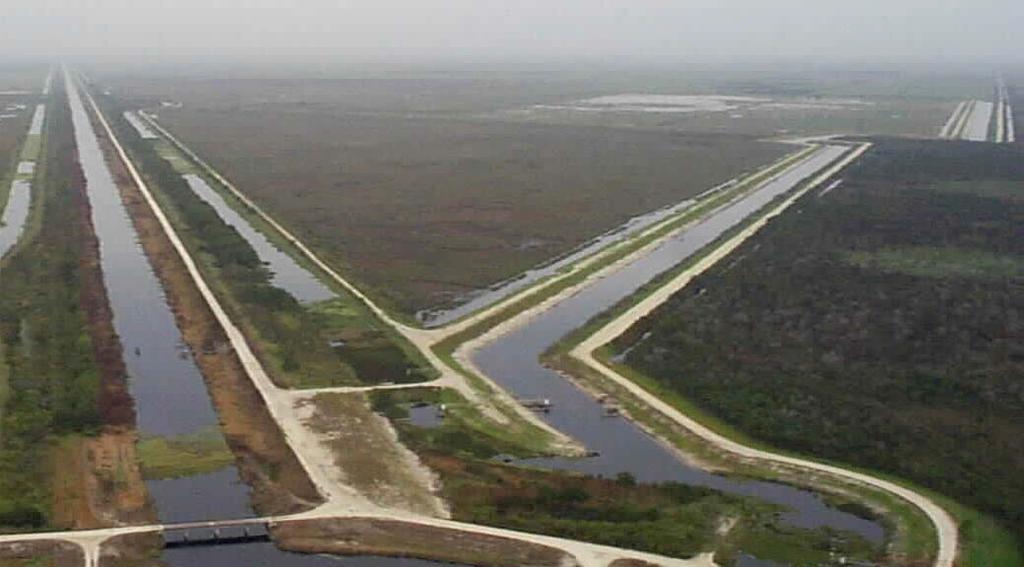
12 East Beach Water Conservation District da cy District South Shore Drainage District East ShoreWater Conservation District STA 1E STA-1W
13
14


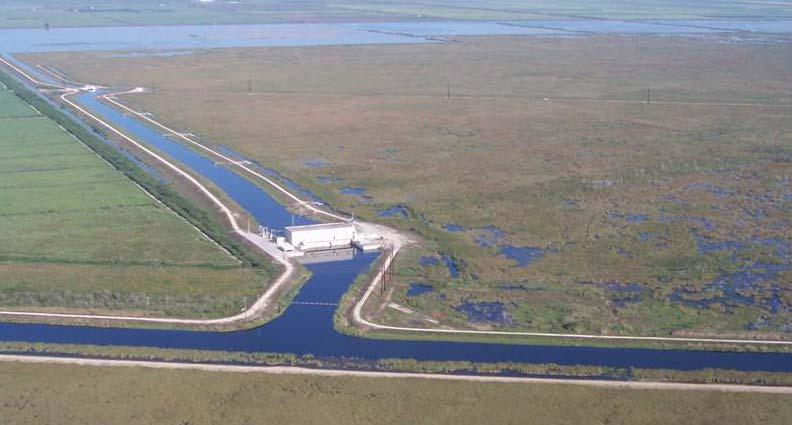
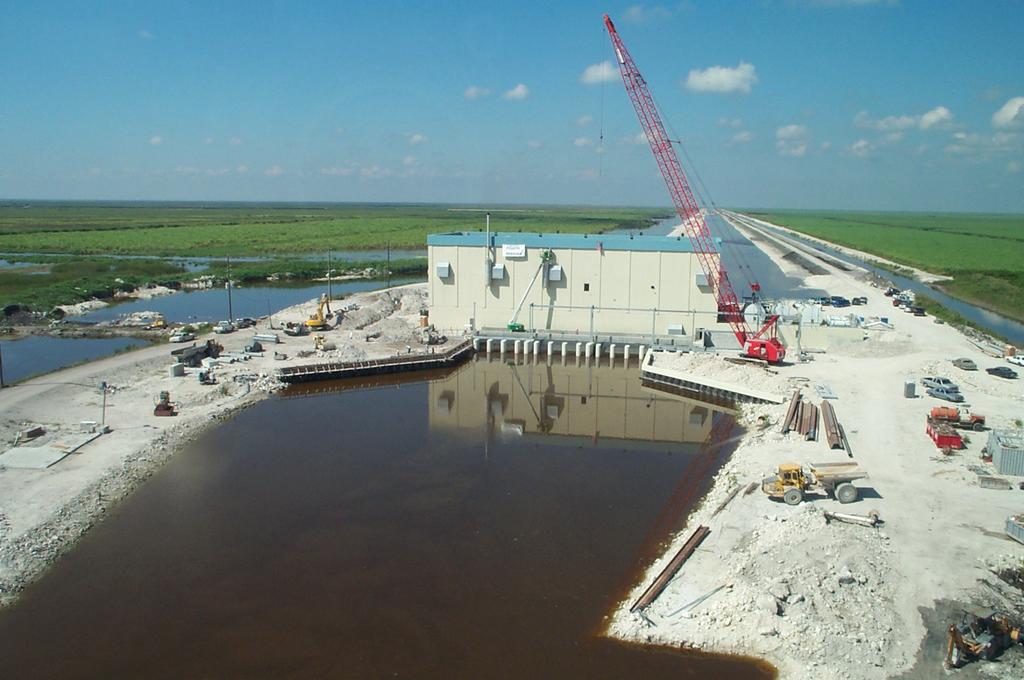
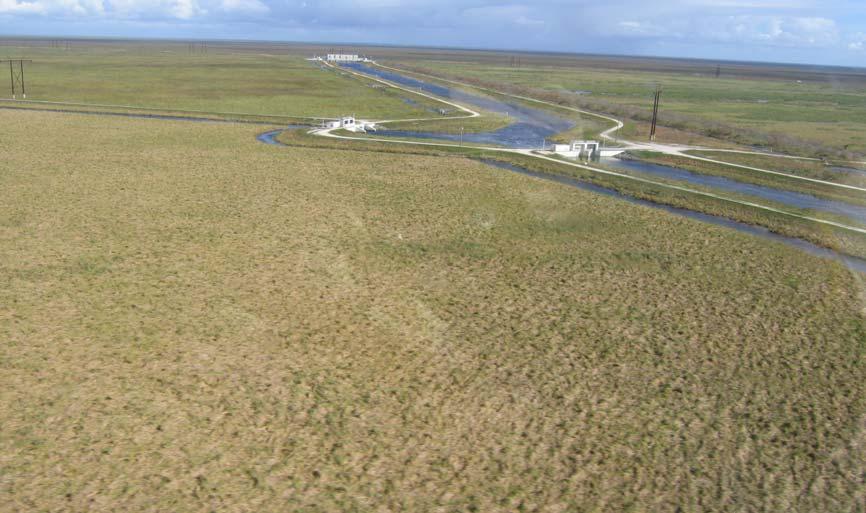
15 Inflow structure for STA 1W Limerock berm
16
17
18
19
20 700,000 STA-1W Annual Flows - Highly Variable Flow (acre feet) 600, , , , , ,000 Inflow Outflow Water Year (May - April)
21 300 STA-1W Phosphorus Concentrations Total Phosphorus (ppb) Inflow TP Outflow TP Water Year (May - April)
22 120,000 STA-1W Phosphorus Load Reduction 100% Total Phosphorus (kg) 100,000 80,000 60,000 40,000 20,000 0 Inflow TP Outflow TP Load Reduction (%) Water Year (May - April) 90% 80% 70% 60% 50% 40% 30% 20% 10% 0%
23 STA-2

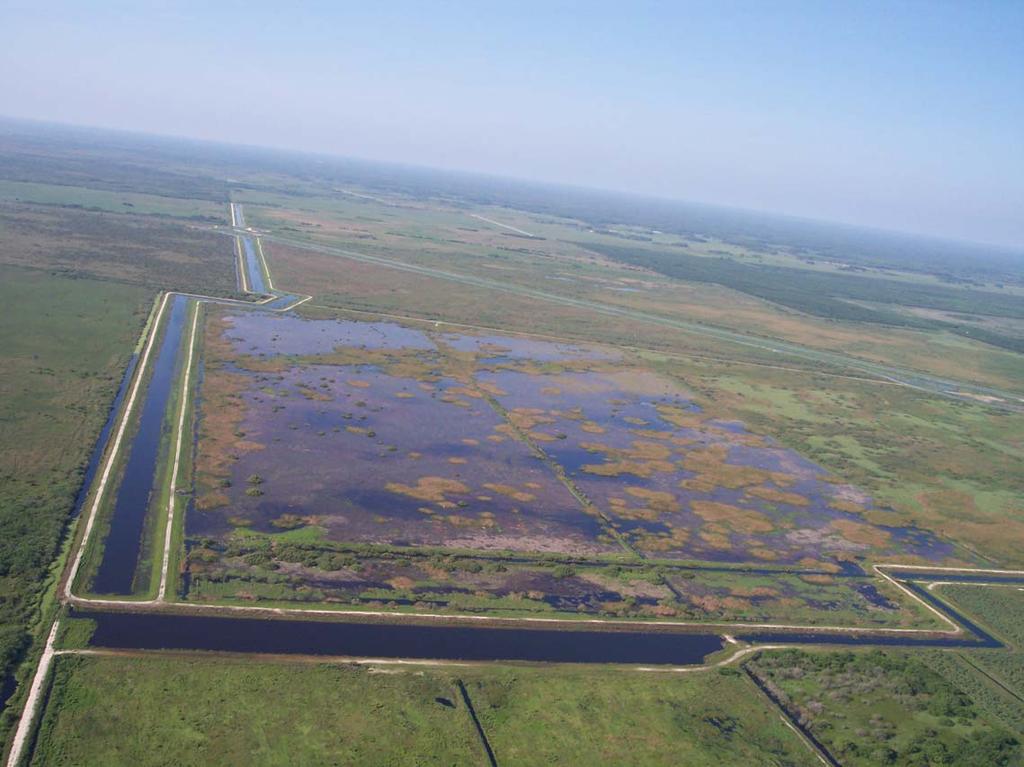
24 East Beach Water East Beach Water Conservation District Conservation District STA-2 South Florida South Florida Conservancy District Conservancy District South Shore South Shore Drainage District Drainage District East ShoreWater East ShoreWater Conservation District Conservation District STA 1W STA 1W STA 1E STA 1E STA 5 STA 5 STA 6 STA 6 STA 3/4 STA 3/4 ENR ENR STA 2 STA 2 STA-2 6,430 acres of effective treatment area Parallel flow-ways: emergent followed by SAV
25 STA-2 has a mixture of emergent & submerged vegetation
26
27
28 Total Phosphorus (ppb) STA-2 Phosphorus Concentrations Inflow TP Outflow TP Total Phosphorus (kg) 60,000 50,000 40,000 30,000 20,000 10,000 0 STA-2 Load Reduction Performance Inflow TP Outflow TP Load Reduction (%) % 90% 80% 70% 60% 50% 40% 30% 20% 10% 0% % Reduction


29 Stormwater Treatment Area 3/4 is the world s largest constructed wetland: over 16,500 acres of former agricultural land. >220 tons of phosphorus removed
30
31
32
33 STA-3/4 Phosphorus Concentrations Total Phosphorus (ppb) Inflow TP Outflow TP Total Phosphorus (kg) 120, ,000 80,000 60,000 40,000 20,000 0 STA-3/4 Load Reduction Performance Inflow TP Outflow TP Load Reduction (%) % 90% 80% 70% 60% 50% 40% 30% 20% 10% 0% % Reduction
34 East Beach Water Conservation District South Florida Conservancy District South Shore Drainage District East ShoreWater Conservation District STA 1W STA 1E ENR STA 5 STA 2 STA-5 STA 6 STA 3/4
35 STA-5 4,118 acres Parallel flowways: emergent and the emergent followed by SAV Treated water helping to restore hydroperiod of Rotenberger WMA

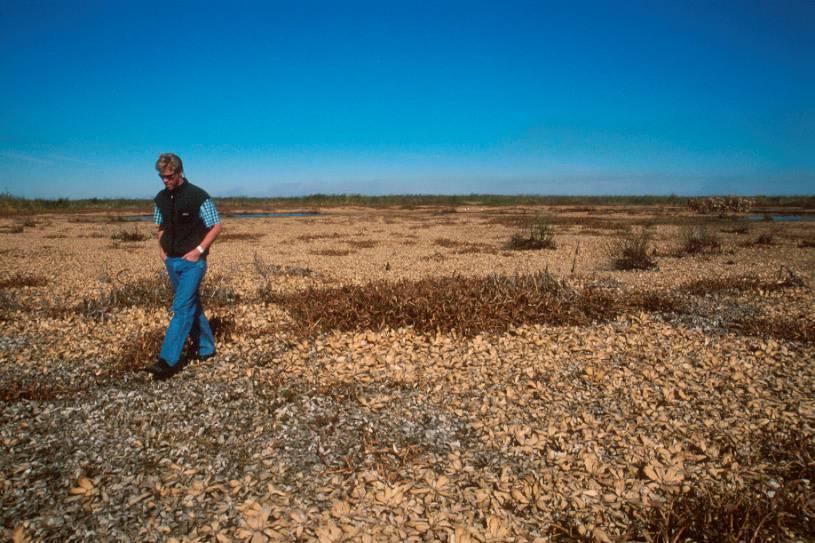
36 Treatment areas are susceptible to drought

37 but they are resilient
38 STA-6
39
40
41 Public Access Bird Watching tours available in cooperation with SFWMD, USFWS and FFWCC


42 Hurricane Impacts SAV uprooted
43 Emergent Vegetation flattened

44 To minimize disruption Vegetation Strips (STA-3/4 & 2)
45 Mixed Marsh (STA-1E)
46 Treatment performance has met initial expectations, but now the focus is on enhancement and sustainability All STA Phosphorus Concentrations Inflow TP Outflow TP TP (ppb)
47 Summary of Performance In general, performance has exceeded expectation outflow has averaged 45 ppb STA-1E: 125 ppb STA-1W: 55 ppb STA-2: 21 ppb STA-3/4: 19 ppb STA-5: 106 ppb STA-6: 20 ppb 960 metric tons removed; 70% removal
48 Combined with EAA BMPs, over 2,500 tons of phosphorus removed Phosphorus Reduction Due to BMPs and STAs Annual Phosphorus Load (tons/yr) Load without BMPs & STAs Load with BMPs & STAs Cumulative Reduction Missing WY2007 BMP data Cumulative Phosphorus Load Reduction (tons) Despite success of EAA BMPs and STAs, need additional water quality improvement measures to achieve compliance with phosphorus standard
49 Long-Term Water Quality Solutions Expansion of BMPs (esp. urban basins) Expansion of STAs Additional 19,000 acres Enhancement of STAs Continue strong science-based program to optimize performance Synchronization with CERP projects ADAPTIVE MANAGEMENT
50 8,800 acre expansion of STA-2 Not to Scale

51 10,300 acre expansion of STA-5 and STA-6
52 Structural Compartments Water supply Automation Vegetation More SAV Operational Revised depths Weekly performance assessment STA-1W Enhancements G-327 A G-306 A-J Discharge Canal G-258 G-309 G-307 G-256 G-308 G-259 P Cell 5B Cell 2 G-254 A-I Cell 4 G-251 G-310 G-327 B Cell 3 Limerock Berm G-257 G-253 A-J Cell 5B G-255 Cell 1 N Ocean Canal G-305 A-V L-7 Canal G-303 Cell 5A G-252 H-J G-250 S A.R.M. Loxahatchee National Wildlife Refuge (WCA 1) G-302 G-301 G-304 A-J S-5A S-5AS G-311 Effective Cell Area (ac) 1A 745 1B 745 2A 471 2B , A 562 5B 2,293 G-300 Total 6,670 ac


53 Large-scale conversion from cattails to submerged aquatic vegetation

54 Any questions?