Clean Energy Partnership Q3 Board Meeting July 27, 2018
|
|
|
- Kristian Hugo Summers
- 5 years ago
- Views:
Transcription

1 Clean Energy Partnership Q3 Board Meeting July 27,
2 Agenda 1. Welcome and Introductions 2. Review and Approve Agenda and Q2 Minutes 3. Quarterly Update from EVAC Co-Chairs Annual Report 5. Utility Funding Flexibility Presentation 6. Partnership Activity draft concepts under development for next work plan 2
3 * Quarterly Update from EVAC Co-Chairs 3
4 * 2017 Annual Report 4
5 * 2017 Clean Energy Partnership Annual Report ES Executive Summary 2017 Highlights 1 Citywide GHG emissions (electricity & natural gas) 2 Commercial building energy use 3 Residential Building Energy Use 4 Local or directly purchased renewable energy 5 Home Energy Squad Visits 6 Low Income Program Activity 7 Air Sealing/Insulation Activity 8 Multi-Family Building Program Activity A Work Plan Activities Progress 5


 o Small Business Refrigeration Program (Xcel")

6 Executive Summary: 2017 Partnership Highlights ~$1 million new funding to climate and energy programs via City s franchise fee increase; 9 new and expanded City programs underway in 2018 Barriers & benefits to EE identified for hard-to-reach communities. New Tools Underdevelopment: o On-Bill Loan Repayment (CenterPoint Energy) o Energy Data Aggregation (CenterPoint Energy) o Small Business Refrigeration Program (Xcel Energy) Conservation Improvement Programs (CIP) Minneapolis 2017 results: o 98,660 metric tons of carbon dioxide saved (2.4% 2016 emissions) o $12 million saved by customers in year 1 o $18 million invested in Minneapolis conservation 6

7 Metric 1.0: Citywide Greenhouse Gas Emissions
8 Metric 2.0: Commercial Buildings Xcel Energy CenterPoint Energy City of Minneapolis 3.1 M Commercial/Industrial Building Electricity Use (MWh) M 3.0 M M 2.9 M Commercial Building Natural Gas use (therms) M M M Average ENERGY STAR score of benchmarked buildings Average weather-normalized EUI of benchmarked buildings (kbtu/sqft/yr)
9 Metric 2.2: Commercial Utility EE Program Utilization CenterPoint Energy Foodservice Equipment Rebates Heating & Water Heating Rebates Custom Rebates Natural Gas Energy Analysis Industrial Process Efficiency Training & Education Engineering & Certification Assistance Industrial Process Steam Trap Audit Energy Design Assistance Multi- Family Building Efficiency Xcel Energy Commercial Efficiency Comprehensive Efficiency Heating & Cooling Custom Data Controls EDA/EEB Fluid System Food Service Interrupted Rates Lighting One Stop Motors Process Efficiency Recommissioning Saver s Switch Turn Key 9
10 Metric 2.2: Commercial Utility EE Program Utilization Participation Rebate Dollars Spent ($) 8.9 M 3.1 M 4.2 M 900 K K 1.1 M $ 5.9 M 2.9 M 6, Estimated Annual Energy Savings (Household Equivalent) 8,017 5,152 3,165 13,986 6,190 15,894 10, Estimated Annual Cost Savings ($) 7.5 M 4.6 M 7.4 M 2.8 M 2.0 M 1.3 M 2.8 M 3.2 M
11 Metric 4.0: Renewable Energy Windsource Participants 11,154 11,926 9,906 12,903 8,449 Winsource - MWh (Household Equivalent) 6,181 6,703 9, Solar*Rewards Participants Solar*Rewards - MWh (Household Equivalent)
12 Metric 5.0: Home Energy Squad 731 Participation 1, Percent of 1-4 unit residences served by HES (incremental) 1.00% 0.80% 0.90% 0.70% HES-Driven Energy Efficiency Loan Count HES-Driven Energy Efficiency Loan Amount ($) 279, , ,519 66,
13 Metric 6.0: Low Income Services CenterPoint Energy Rental Efficiency Free Heating System Tune- Up Affordable Housing Rebates Multi-Family Housing Rebates Low Income Home Energy Squad Xcel Energy Home Energy Savings Program Multi-Family Energy Savings Program Multi-family Building Efficiency Low Income Weatherization MN DOC
")
14 Metric 6.0: Low Income Services Participation 1, Bill Payment Assistance Participation 8,105 7,103 5,714 4,000 3,450 3, Dollars Spent ($) 921,83 916, ,35 324, , M 1.5 M 1,618,7 35 1,841, Bill Payment Assistance Dollars Spent ($) 2.9 M 1.2 M , M 1.3 M $
15 Metric 7.0: Air Sealing & Insulation 335 Participants Rebates Dollars Spent ($) [VALUE ] $ 130, Estimated Annual Energy Savings (Household Equivalent) Estimated Annual Cost Savings ($) 43, ,069 42,
16 Metric 8.0: Multi-Family Program Participation CenterPoint Energy Foodservice Equipment Rebates Heating & Water Heating Rebates Custom Rebates Natural Gas Energy Analysis Training & Education Engineering & Certification Assistance Affordable Housing Multi- Family Rebate Energy Design Assistance Multifamily Building Efficiency Xcel Energy One Stop Shop Multi-Family Energy Savings Air Conditioning Cooling Lighting Res Demand Response Res Heating Saver s Switch Smart Thermostat Turn Key Services

 302,76 7 Estimated Annual Cost Savings ($) 364,66 1 452,83 294,57")
17 Metric 8.0: Multi-Family Program Participation Participation Estimated Annual Energy Savings (Household Equivalent) ,006 1, , ,84 0 Rebate Dollars Spent ($) 302,76 7 Estimated Annual Cost Savings ($) 364, ,83 294, ,649, , , , , ,25 1 $
18 2017 Annual Report Looking Ahead: Evaluate metrics Align metrics with City climate & energy goals Communicate trends and trajectories w/ new visuals Report progress on Work Plan Activities * 18
19 * Utility Funding Flexibility Discussion 19
20 Utility Funding Flexibility Discussion Board Direction Background Methodology Findings Recommendations Next Steps 20
21 Utility Funding Flexibility Discussion Direction to Utilities: Review CIP Programs to determine opportunities for realignment with City activities. Discuss process for developing new initiatives or programs. 21
22 Utility Funding Flexibility Discussion Conservation Improvement Program (CIP): MN 216B.241 Energy Conservation Improvement Overseen by MN DOC, Division of Energy Resources Minimum Spending Requirements 0.5% of Gas Company s state revenue 2.0% of Electric Company s state revenue Annual Energy Savings Goals: 1.5% retail sales Administered by Gas & Electric Companies paid for by customers 22
23 Utility Funding Flexibility Discussion Conservation Improvement Program (CIP): CIP Plans submitted to DOC (every 3 years) Next submission June 2019 Program modifications (including pilots) can be submitted anytime Programs evaluated based on cost-effectiveness and the reliability of technologies employed Annual CIP Status Report submitted to DOC/PUC April [Electric] & May [Gas] Companies 23
24 Utility Funding Flexibility Discussion Conservation Improvement Program (CIP): Utility Program Development Process [ days]. Research & Program or Pilot Design Pilots: 1) Intent to determine viability statewide & 2) require designated time frame, evaluation process, and can evaluate cost effectiveness Regulatory Filing Decision[ days] CIP Program or Modification (incl. Pilots) > MN DOC New Tariff (incl. Pilots) > MN PUC Program Launch [if approved] 24
25 Utility Funding Flexibility Discussion Methodology: Review CIP Program Participation, Savings, and Spending in City of Minneapolis in 2017 What are the programs in each customer group w/ the highest energy savings? What are the programs w/ the highest energy savings per customer? 25
26 Customer Group Residential Home Efficiency Rebates Air Sealing & Insulation Rebates No Cost DIY Kits Home Energy Squad Home Energy Reports High Efficiency Home New Home Construction Rebates Air-Conditioning Efficient New Construction Home Energy Squad Home Energy Audits Insulation Rebates Refrigerator Recycling Residential Demand Response Residential Heating Smart Thermostats Home Energy Squad Subsidy 0% Interest Loans Inclusive Financing Feasibility Study Low Income Weatherization Rental Efficiency Heating System Tune-Up Non-Profit Affordable Housing Rebate Multi-Family Housing Rebates Home Energy Savings Program Multi-Family Energy savings Program (MESP) Low Income home Energy Squad Green Zone Community Engagement Home Energy Squad Subsidy in Green Zone and residents between % AMI Green Cost Share (Housing) Commercial Heating & Water Heating Rebates Foodservice Equipment Rebates Custom Rebates Energy Analysis Design Assistance Process Efficiency Training & Education Multi-Family Building Efficiency Commercial Efficiency Computer Efficiency Cooling Efficiency Custom Efficiency Data Center Efficiency Efficiency Controls Energy Design Assistance/Energy Efficiency Buildings Fluid System Optimization Food Service Equipment Heating Efficiency Interrupted Rates Lighting Efficiency One Stop Efficiency Shop Motors Efficiency Process Efficiency Recommissioning Saver s Switch Business Turn Key Services Green Cost Share (Multi- Family) Green Cost Share (Business) Small Business Energy Initiative Other Energy Data Aggregation Tool On Bill Loan Repayment Tool Marketing & Outreach Research & Development Data Aggregation Tool Marketing & Outreach Research & Development Energy Information Systems Pilot (EIS) ENERGY STAR Retail Products Platform Pilot Workforce Development Assessment 26
27 Utility Funding Flexibility Discussion Findings Customer Group Residential Low Income Commercial Highest Energy Savings Programs in Minn CenterPoint Energy Home Efficiency Rebate Program Furnaces Boilers Xcel Energy Residential Heating Electrically Commutated Motor (ECM) in a furnace; forced air or new CenterPoint Energy Weatherization Xcel Energy Low Income Multi-Family CenterPoint Energy Custom Rebates Xcel Energy Lighting Efficiency Highest Energy Savings per Participant in Minn CenterPoint Energy Home Insulation Rebate Program Xcel Energy Home Insulation Rebate Program CenterPoint Energy Low Income Multi-Family Xcel Energy Low Income Multi-Family CenterPoint Energy Energy Design Assistance Xcel Energy Data Center Efficiency Energy Design Assistance 27
28 Utility Funding Flexibility Discussion Recommendations: Target high residential natural gas users for heating and insulation rebates Focus on increasing low income participation in Weatherization and Multi-Family Programs Engage high commercial natural gas users in custom programs and electric customers in lighting and whole building Create Minneapolis-focused pilots that, if successful, can be implemented territory-wide 28
29 Utility Funding Flexibility Discussion Next Steps: Consider Utility Spending Findings & Annual Report Findings in development of Partnership Activities for the next work plan. 29
30 * Partnership Activity draft concepts under development for next work plan 30
31 * 2018 Quarter Work Plan Development Process Development Process 1 Develop and approve Board Priorities and Approaches Board Brainstorm Partnership Activities that align with Board Priorities, Approaches, and Principles. Consider and analyze EVAC ideas Develop 2-3 Partnership Activities per Board Priority Provide feedback on Partnership Activity draft concepts Present Partnership Activity draft concepts with EVAC feedback to Board for review Revise and further develop Partnership Activity draft concepts based on Board Feedback Provide Feedback on proposed Partnership Activities Consider approval of proposed Work Plan with Partnership Activities Responsible Party EVAC Planning Team EVAC Board Planning Team EVAC Board 31
32 * Partnership Activities A Partnership activity: 1. Helps the City reach its Climate Action Plan and Energy Vision for 2040 goals, 2. Initiates an action that would not happen absent the Partnership, 3. States roles for the City and at least one utility, and 4. Identifies a lead Partner. Two Types of Activities Partnership Activities Potential Collaboration Activities The Partners may identify certain individual Partner activities that clearly advance the City s climate and energy goals and may become areas of future collaboration. Previously existing and/or new utility programs near deployment may be considered for this section with a planned collaborative effort to leverage the Partners resources. These collaboration items may fully develop and become priority initiatives of the Clean Energy Partnership, turning into Partnership activities. Adopted by Board on Dec. 19, Priority will be given to accomplishing and reporting on Partnership activities over the course of a work plan timeline. 32
33 Partnership Activity draft concepts under development Energy Efficiency Study & Act on High Residential Gas Usage: Conduct a research effort to identify high residential natural gas users and the contributing factors of high usage. Develop and pilot individually customized strategies and more accessible marketing materials to dramatically increase residential energy Partnership efficiency Activities with a focus on building envelope upgrades. CAP Link* 15% EE in Res Bldgs by 2025 (Goal) 75% of homes have energy retrofit by 2025 (Strategy) Align Benchmarking Data with Utility EE Resources: Create a pilot commercial office building sector cohort to realize significant energy conservation by targeted and measurable outreach efforts to buildings with the highest energy use intensity and highest energy use. Pursue City Facilities Performance Path : Pursue new pilot Performance Path to Energy Efficiency for City facilities by providing discrete bundles of service according to progression in energy management. *All activities drive toward overall community-wide GHG emissions reduction goals 20% EE in C/I Bldgs by 2025 (Goal) 1.5% annual reduction in City facility GHGs (Goal) 20% EE in C/I Bldgs by 2025 (Goal) 33
34 * Feedback on Energy Efficiency Partnership Activity concepts EVAC Item #1: Emphasize different strategies for different building types focusing primarily on building envelopes may preclude action in multifamily buildings. Set target for how many high NG users will receive customized interventions. Item #2: The item should include an action component, not just targeted outreach and discussion. Item #3: More information needed to understand the program design and expected outcomes. Board What additional feedback and comments do you have? 34
35 Partnership Activity draft concepts under development Renewable Energy Conduct Electric Vehicle Infrastructure Pilot: Conduct an Xcel Energy EV Infrastructure pilot with City fleet vehicles and maximize renewable electricity consumption based on actual and modeled renewable resource production. Partnership Activities Achieve 100% RE for City Enterprise: Create a pathway for meeting the City s 100% renewable electricity enterprise goal after the current Renewable*Connect tranche subscriptions expire while meeting the City s priorities. Include a potential to expand citywide, helping to reach the community-wide goal. Align Low Income Solar*Rewards with 4D Criteria: Add 4D NOAH participation as eligibility criteria to upcoming Low Income Solar*Rewards program with a focus on Minneapolis outreach and promotion. CAP Link* City infrastructure is model of RE technology (Strategy) Provide EV charging at City facilities (Strategy) Investigate large-scale RE for municipal government and/or residents. (Strategy) 10% of electricity from local and directly purchased renewables by 2025 (Goal) Citywide 100% RE Goal *All activities drive toward overall community-wide GHG emissions reduction goals 35
36 * Feedback on Renewable Energy Partnership Activity concepts EVAC Item #1: Be more clear about the scope of what is being piloted and what it will lead to. Is the ultimate goal to create infrastructure for the City fleet or the broader community? Item #2: The ultimate goal should be to create an approach that will work community-wide. Item #3: In addition to Solar*Rewards qualification, consider a more comprehensive approach to address various barriers facing 4D NOAH buildings (financing, etc.). Board What additional feedback and comments do you have? 36
37 Partnership Activity draft concepts under development Inclusive Financing CAP Link* ***NOTE: The following definition of inclusive financing was adopted at the Q2 Board meeting: Inclusive financing allows direct investment in resource Partnership Activities efficiency upgrades on the customer side of the meter through an on-bill approach regardless of the customer s income, credit score, or renter/owner status. Under this definition debt is not accrued by the customer. Advocate for inclusive financing at the State Legislature and/or Public Utilities Commission, if inclusive financing is determined to be feasible and can reasonably favor customers. Develop an inclusive financing pilot project, if it is determined to be legally feasible and reasonable for the implementer and their customers. 15% EE in Res Bldgs by 2025 (Goal) 75% of homes have energy retrofit by 2025 (Strategy) Develop tools to finance EE and RE retrofits that have low barriers to entry (Strategy) *All activities drive toward overall community-wide GHG emissions reduction goals 37
38 * Feedback on Inclusive Financing Partnership Activity concepts Board What additional feedback and comments do you have? 38
39 * Feedback on overall list of Partnership Activity concepts EVAC More details will help make it easier to assess projects. Include near-term objectives (ie. % of actions taken in target sector) and an expected two-year project outcome that will lead into future work plans (ie. a plan for how successful programs and activities will be expanded). The work plan as a whole doesn t seem ambitious enough at the current level of detail provided. At least one item in each section should be expanded to have a broader reach and larger expected impact. Board What additional feedback and comments do you have? 39
40 * Work Plan Next Steps Hold two additional Energy Efficiency and Renewable Energy EVAC feedback sessions for deeper dive into concepts Revise and further develop Partnership Activity draft concepts based on Board and EVAC feedback Present proposed Partnership Activities to Q4 EVAC Meeting for final feedback Board considers approval of proposed Work Plan with Partnership Activities at Q4 Meeting 40
41 * Adjourn 41
42 * Supplemental Slides 42
43 * CEP Board Priorities for the Next Work Plan Description: Priorities Lower Energy Consumption in all building sectors Make clean energy accessible through inclusive financing tools Make the City more sustainable and resilient through increased local renewable energy Approaches As a partnership, make requests of the State and PUC Consider ROI and Equity of Energy Efficiency efforts Leverage partners respective strengths Clarify CEP roles and prioritize goals and activities CEP Work Plan priorities and approaches approved on March 15,
44 * Franchise Fee Increase Programming 44
45 Average Savings as a Percent of Sales (y); Average $/Dth (x); Average Annual Dth Savings (size) 1.40% 1.20% 1.00% 0.80% 0.60% 0.40% 0.20% 0.00% $0.00 $20.00 $40.00 $60.00 $80.00 $ $ $ $ $ $
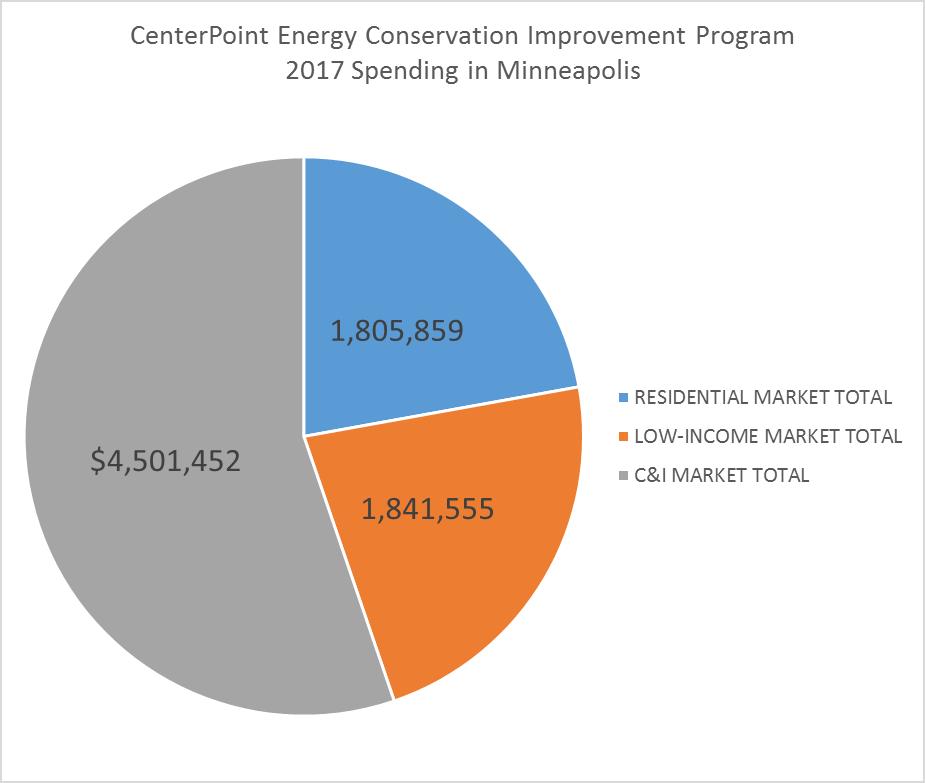
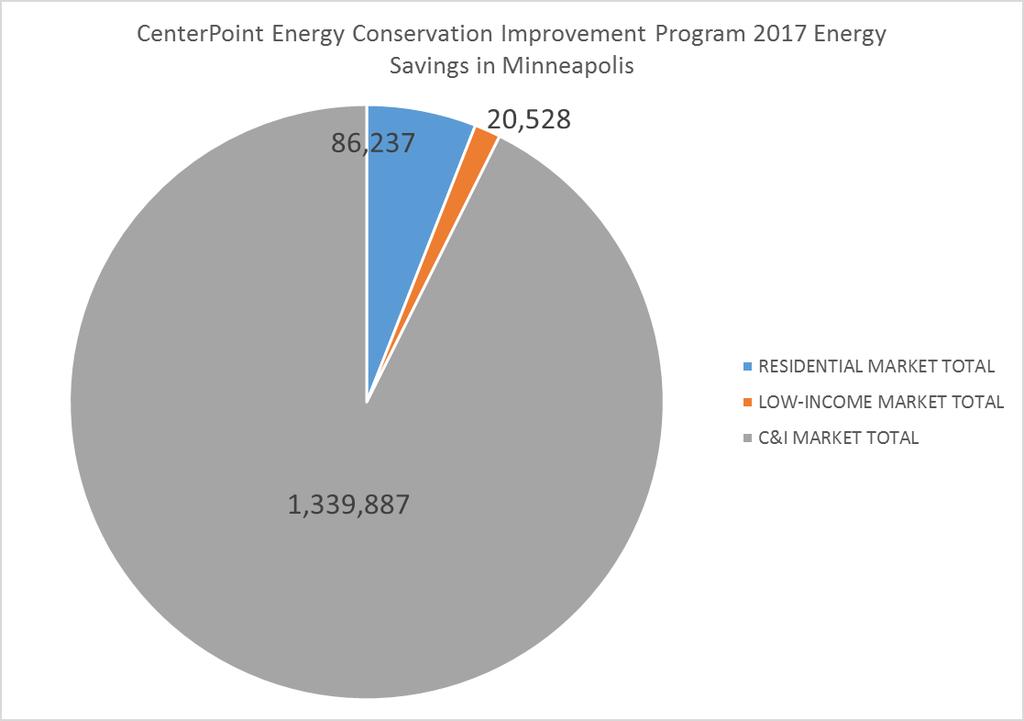
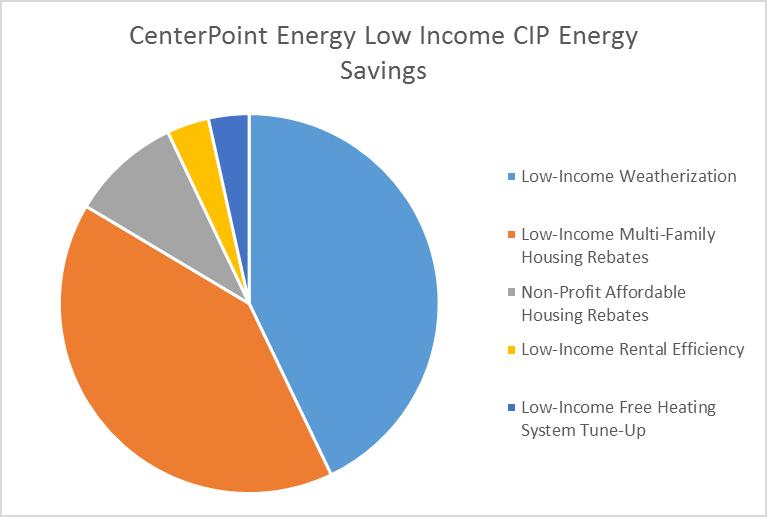
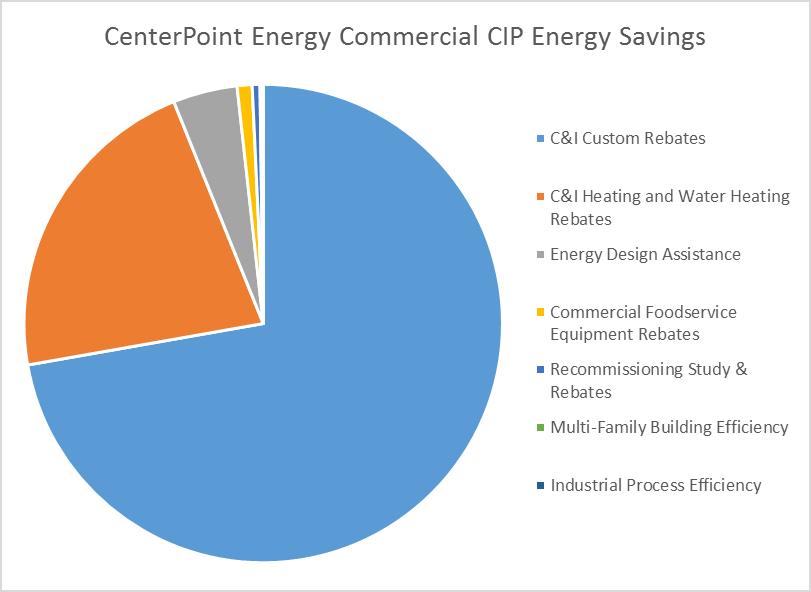
46 2017 CenterPoint Energy Conservation Improvement Program Results Participants Minneapolis Energy Savings (Dth) Total Program Spending ($) Energy Savings/ Participa nt RESIDENTIAL MARKET Home Efficiency Rebates 5,264 37, , DIY Home Efficiency 1,688 3,542 91, Home Insulation Rebates 242 6, , Home Energy Reports 24,175 34, , Home Energy Squad 599 2, , High-Efficiency Home , New Home Construction Rebates , RESIDENTIAL MARKET TOTAL 32,142 86,237 1,805, LOW-INCOME MARKET Low-Income Weatherization 253 8,804 1,246, Low-Income Rental Efficiency , Low-Income Free Heating System Tune-Up , Non-Profit Affordable Housing Rebates 59 1, , Low-Income Multi-Family Housing Rebates 37 8, , LOW-INCOME MARKET TOTAL ,528 1,841, COMMERCIAL & INDUSTRIAL MARKET Commercial Foodservice Equipment Rebates ,291 $158, C&I Heating and Water Heating Rebates 3, ,486 $1,076, C&I Custom Rebates ,321 $2,401, Natural Gas Energy Analysis Energy Design Assistance 18 58,647 $590, Industrial Process Efficiency* N/A N/A N/A #VALUE! C&I Training and Education Engineering & Certification Assistance 15 - $38, Recommissioning Study & Rebates 9 8,329 $42, Multi-Family Building Efficiency 30 2,424 $178, Industrial Process Steam Trap Audit
47 2017 Xcel Energy Conservation Improvement Program Results Participants Energy Savings (kwh) Total Program Spending ($) Energy Savings/Particip ant RESIDENTIAL MARKET Air Conditioning 1, ,551 $1,744, Efficient New Home Construction 20 21,373 $5,434 1, Home Energy Audits 121 N/A $24,655 Home Energy Squad ,955 $130, Home Insulation Rebates 2 10,907 $207 5, Refrigerator Recycling ,943 $38, Residential Demand Response 640 3,082 $132, Residential Heating 1, ,293 $137, Smart Thermostat 45 N/A N/A RESIDENTIAL MARKET TOTAL 4,178 2,144,104 $2,213,813 1, LOW-INCOME MARKET Low Income Home Energy Squad ,626 $32, Home Energy Savings Program ,011 $298, Low Income Multi-Family ,634 $283,530 1, LOW-INCOME MARKET TOTAL ,271 $614, COMMERCIAL & INDUSTRIAL MARKET Commercial Efficiency 117 5,757,601 $1,744,544 49, Computer Efficiency 1 1,088 $105 1, Cooling 132 1,554,548 $328,838 11, Custom Efficiency 5 780,578 $123, , Data Center Efficiency 17 5,262,366 $518, , Efficiency Controls 15 3,038,693 $317, , Energy Design Assistance 17 3,916,057 $1,409, , Energy Efficient Buildings 2 305,425 $165, , Fluid System Optimization ,551 $93,259 50, Foodservice Equipment 9 171,838 $10,534 19, Heating Efficiency 2 2,709 $293 1, Interrupted Rates 34 30,248 $206, Lighting ,712,704 $5,718,073 15, Lighting One Stop 280 9,451,085 $2,505,662 33,
48 48


49 Xcel Energy Conservation Improvement Program 2017 Spending in Minneapolis Xcel Energy Conservation Improvement Program 2017 Energy Savings in Minneapolis $2,213,813 $614,777 2,144, ,271 RESIDENTIAL MARKET TOTAL RESIDENTIAL MARKET TOTAL LOW-INCOME MARKET TOTAL LOW-INCOME MARKET TOTAL $16,198,117 C&I MARKET TOTAL 56,415,846 C&I MARKET TOTAL 49

50 Back Up Slides 50


51 Back Up Slides Xcel Energy Residential CIP Energy Savings Xcel Energy Low Income CIP Energy Savings Air Conditioning Efficient New Home Construction Home Energy Squad Insulation Rebates Refrigerator Recycling Low Income Home Energy Squad Home Energy Savings Program Low Income Multi-Family Residential Demand Response Residential Heating 51


52 Xcel Energy Commercial CIP Energy Savings Commercial Efficiency Computer Efficiency Cooling Custom Efficiency Data Center Efficiency Efficiency Controls Energy Design Assistance Energy Efficient Buildings Fluid System Optimization Foodservice Equipment Heating Efficiency Interrupted Rates Lighting Lighting One Stop Motors Efficiency Process Efficiency Recommissioning Saver's Switch for Business Turn Key Services 52