UNICEF indicator clinic Data for children in the SDGs Monitoring SDG indicators for WASH
|
|
|
- Ann Horn
- 5 years ago
- Views:
Transcription


1 UNICEF indicator clinic Data for children in the SDGs Monitoring SDG indicators for WASH International workshop on SDG monitoring Beijing 28 June 2018 Tom Slaymaker UNICEF HQ (New York) WHO/UNICEF JMP data.unicef.org washdata.org

2 UNICEF GLOBAL CUSTODIAN OF DATA FOR CHILDREN CUSTODIAN CO-CUSTODIAN Stunting 3.b.1 Full vaccination coverage Wasting/overweight Sexual violence by intimate partner UNICEF briefing notes on SDG global indicators related to children Skilled attendance at birth Sexual violence by non-intimate partner Under-five mortality Safely managed drinking water Neonatal mortality Safely managed sanitation and hygiene Early childhood development Child labour Early marriage Birth registration FGM/C Child discipline Sexual violence against children

3 Monitoring SDG indicators for WASH 3
4 SDG Target 6.1: Drinking water By 2030, achieve universaland equitableaccess to safeand affordable drinking water for all Indicator 6.1.1: Population using safely managed drinking water services Definition: The population using an improved drinking water source which is Accessible on premises Available when needed Free from faecal and priority chemical contamination 4


5 Improved drinking water sources (MDG) 5

6 SDG drinking water service ladder 6
7 Accessible Use of drinking water sources PMA15 Uganda On premises Within 30 minutes PMA PMA2020 Performance Monitoring and Accountability Survey 2015 Definitions Facility type estimates Urban Rural National Improved All piped Non-piped Service level estimates Accessibility 0 mins On premises No more than 30 mins roundtrip Within 30 minutes Household surveys and censuses Available for most countries How long does it take for members of your household to go there, get water, and come back? Sector data and regulators Household connections Maximum distances
8 Available when needed Use of drinking water sources CWA CWA14 Central Water Authority Mauritius Central Water Authority Admin 2014 Definitions Facility type estimates Improved All piped Non-piped Urban Rural Nation al Service level estimates Accessibility On premises Within 30 minutes Availability 86.0 Sufficient Population receiving water on a hour basis Most of the time Continuous National Standard Quality Microbial Fluoride Arsenic Priority chemical Safely managed Household surveys and censuses Continuity (hours of service) of piped water supplies In the last month, has there been any time when your household did not have sufficient quantities of drinking water? Sector data and regulators Continuity of piped supplies Different benchmarks and standards 24/7, 20 hours/day, 12 hours/day, 5 days/week
9 Free from contamination Use of drinking water sources MICS13 Bangladesh Bangladesh Bureau of MICS13 Statistics Bangladesh Multiple Indicator Cluster Survey 2013 Survey 2013 Definitions Urban Rural National Prop. With no E. coli / 100 ml in source water Prop. within 10 ppb arsenic at source (WHO GV) Prop. within 50 ppb arsenic at source (Natl Standard) Improved All piped Non-piped Service level estimates Accessibility On premises Within 30 minutes Availability Sufficient Most of the time Continuous National Standard Quality Microbial Fluoride Arsenic Priority chemical Faecal and priority chemical E. coli / thermotolerant coliforms (all countries) Arsenic, fluoride (where relevant) Household surveys New module to test E. coli Sector data and regulators Typically only formal systems, mainly urban Some lack E. coli or thermotolerant coliforms Many lack arsenic and fluoride Some report compliance for multiple parameters


10 Water quality testing in household surveys 10

11 JMP country file contains a complete list of national data sources used to produce estimates 11


12 JMP estimates for improved and basic services based on average of all available national sources of data 12
13 Safely managed drinking water calculation Safely managed drinking water calculation National Rural Urban Year: Proportion of population with improved: Proportion of population with improved sources which are: Accessible on premises Available when needed Free from contamination Safely managed Notes: The indicator for SDG 6.1, safely managed drinking water services are defined as use of an improved drinking water source which is accessible on premises, available when needed and free from contamination. To make an estimate of safely managed services, information on the use of improved drinking water sources is combined with information on the accessibility, availability and quality of drinking water. Estimates are based on the minimum value of these criteria or, where estimates are available for both rural and urban, a population weighted average of the two. The JMP reports estimates for safely managed drinking water provided information is available for at least 50 per cent of the population on quality of drinking water and either accessibility or availability. 13

14 Safely managed drinking water estimate 14

 6.")

15 JMP estimates for drinking water ( ) In billion used a safely managed drinking water service Safely managed estimates available for 96 countries (4 out of 8 regions) 6.5 billion people used at least a basic service 844 million still lacked basic services 263 million used a limited service 159 million still used surface water sources
16 SDG Target 6.2: Sanitation By 2030, achieve access to adequate and equitable sanitation and hygiene for all, and end open defecation, paying special attention to the needs of women and girls and those in vulnerable situations Indicator 6.2.1a: Population using safely managed sanitation services Definition: The population using an improved sanitation facility which is Not shared, and where Excreta are safely disposed in situ or Transported and treated off site 16
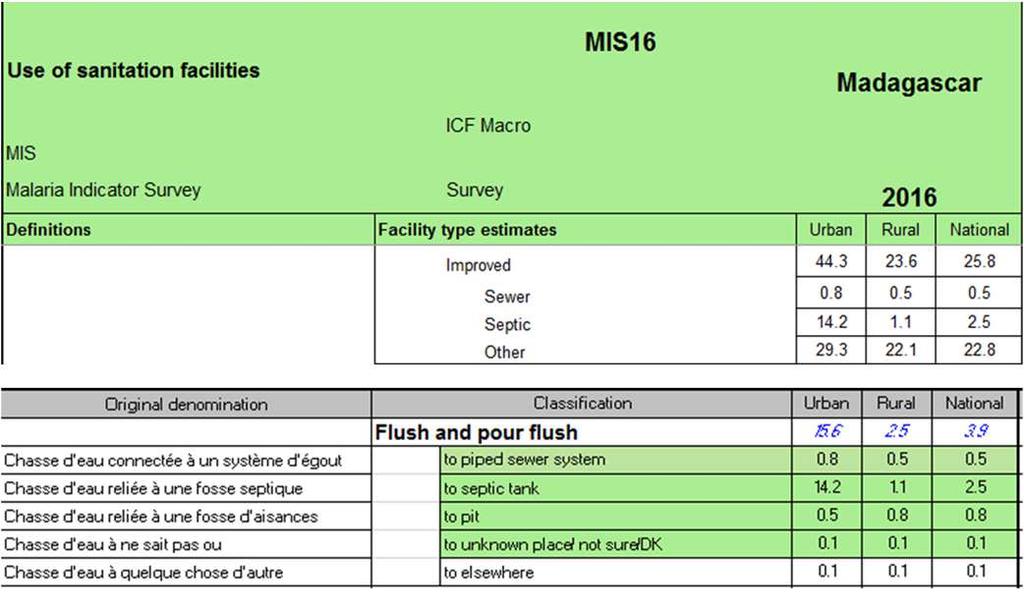
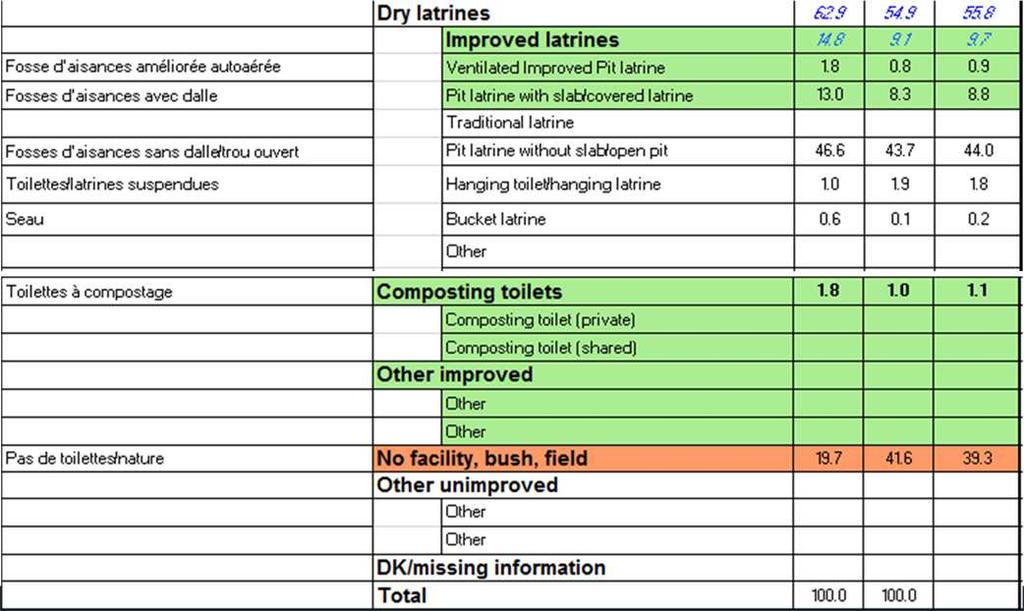
17 Improved sanitation facilities (MDG) 17

18 SDG Sanitation Ladder 18


19 Not shared with other households WS14. WHERE IS THIS TOILET FACILITY LOCATED? WS15. DO YOU SHARE THIS FACILITY WITH OTHERS WHO ARE NOT MEMBERS OF YOUR HOUSEHOLD? WS16. DO YOU SHARE THIS FACILITY ONLY WITH MEMBERS OF OTHER HOUSEHOLDS THAT YOU KNOW, OR IS THE FACILITY OPEN TO THE USE OF THE GENERAL PUBLIC? WS17. HOW MANY HOUSEHOLDS IN TOTAL USE THIS TOILET FACILITY, INCLUDING YOUR OWN HOUSEHOLD? IN OWN DWELLING 1 IN OWN YARD / PLOT 2 ELSEWHERE 3 YES 1 NO 2 SHARED WITH KNOWN HOUSEHOLDS (NOT PUBLIC) 1 SHARED WITH GENERAL PUBLIC 2 NUMBER OF HOUSEHOLDS (IF LESS THAN 10) 0 TEN OR MORE HOUSEHOLDS 10 DK 98 19

20 Safely disposed in situ Household surveys Has your (pit latrine/septic tank) ever been emptied? The last time it was emptied, where were the contents emptied to? Safely managed Not removed Removed and buried on site
21 Emptied and treated ANSD EE14 Senegal Survey 2014 Urban Rural National Sewer Wastewater enters network Wastewater reaches treatment plant Septic Contained Not emptied Emptied and buried on site Emptied and discharged locally Emptied and removed offsite Delivered to treatment plant Latrines and other improved Contained Not emptied Emptied and buried on site Emptied and discharged locally Emptied and removed offsite Delivered to treatment plant Treated At wastewater treatment plant At faecal sludge treatment plant Shared Safely managed Sector data and regulators Desludging services, emptying and transport Faecal sludge treatment plants Wastewater treatment plants that receive faecal sludge Safely managed Solid and liquid wastes treated
22 Wastewater treated Treatment technology Examples SMS Tertiary treatment uses additional processes to remove compounds which are not typically removed in secondary treatment such as nitrogen and phosphorus. Secondary treatment makes use of biological and chemical processes to remove organic matter. Primary treatment involves mechanical or physical processes to remove solids from sewage Chemical or advanced oxidation processes, carbon adsorption, ion exchange, membrane filtration and disinfection. Activated sludge, trickling filters, membrane bioreactors, anaerobic digestion, waste stabilization ponds, and constructed wetlands. Screens, flotation, sedimentation tanks, Imhoff tanks, and rapid filtration beds. Yes Yes No (unless long ocean outfall) Household surveys sewer connection Sector data and regulators Primarily in urban areas Treatment by service provider Little data on transport, leakage

23 JMP country file contains a complete list of national data sources used to produce estimates 23


24 JMP estimates for improved and basic services based on average of all available national sources of data 24
25 Safely managed sanitation calculation Safely managed sanitation calculation National Rural Urban Year: Proportion of population with improved: Proportion of population with improved facilities which are: Sewer connected Septic tanks Latrines and other Disposed in situ 7-3 Emptied and treated 0-0 Wastewater treated Safely managed Notes: The indicator for SDG 6.2, safely managed sanitation services are defined as use of an improved sanitation facility which is not shared with other households and where excreta are disposed in situ or transported and treated offsite. To make an estimate of safely managed services, information on use of different improved sanitation facilities types (sewer connections, septic tanks and latrines and other) is combined with information on containment, emptying, transport and treatment. The JMP reports estimates for safely managed sanitation when information on excreta management is available for at least 50 per cent of the population using the dominant type of improved sanitation facility (sewer connections or on-site sanitation systems). 25

26 Safely managed sanitation estimate 26


27 JMP estimates for sanitation ( ) In billion used a safely managed sanitation service Safely managed sanitation estimates were available for 84 countries (5 out of 8 regions) 5 billion used at least a basic sanitation service 2.3 billion still lacked basic services 600 million used a limited service 892 million still practised open defecation 27
28 SDG Target 6.2: Hygiene By 2030, achieve access to adequate and equitable sanitation and hygiene for all, and end open defecation, paying special attention to the needs of women and girls and those in vulnerable situations Indicator 6.2.1b: Population with a handwashing facility with soap and water available 28

29 SDG Ladder for Hygiene 29

30 Observation of handwashing facilities Household surveys Direct observation of handwashing is challenging Recommended proxy is observation of facilities and availability of water and soap Standard module in MICS & DHS Can you please show me where members of your household most often wash their hands? 30
 Regional coverage varied from 15% in SSA to 76% in WANA In LDCs just 27% of the population had")

31 JMP estimates for handwashing (2015) In 2015 Handwashing estimates available for 70 countries (2 out of 8 regions) Regional coverage varied from 15% in SSA to 76% in WANA In LDCs just 27% of the population had basic facilities with soap and water available In 34 out of 38 African countries less than 50% used basic handwashing facilities Many high income countries lacked data 34/38 countries <50% basic handwashing facilities 31


32 Thank you! 32
33 Updated survey tools for SDG monitoring 33