Green Infrastructure Modeling Strategies
|
|
|
- Anissa James
- 5 years ago
- Views:
Transcription


1 District of Columbia Water and Sewer Authority George S. Hawkins, General Manager Green Infrastructure Modeling Strategies Steve Skripnik, P.E Environmental Engineer, LimnoTech American Water Resources Association National Capital Region Section November 12, 2015

2 Agenda Green Infrastructure Modeling Overview DC Water Green Infrastructure Timeline of DC Water GI Models Next Steps 2
3 Green Infrastructure Model Basics Why do we need a computer model? Models are used as tools to help us predict CSO overflows caused by different management scenarios. Why can we trust models? The models used here are calibrated to actual sewer flow measurements specifically selected to quantify CSO overflow volume and frequency. How is GI modeled? 3

4 Combined vs. Separated Areas Different goals in combined vs separated areas Separate area flows directly to receiving waters Reduce runoff volume Reduce pollutant load Capture first flush Combined area flows to Blue Plains AWTP Reduce peak flows Reduce volume during large storm 4 events


5 The Task Quantify reduction in volume and frequency of CSO overflows caused by: Increased Green Infrastructure Variations in pumping Variations in tunnel volume Grey infrastructure improvements 5

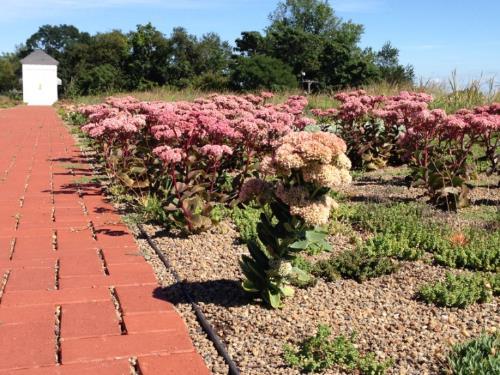


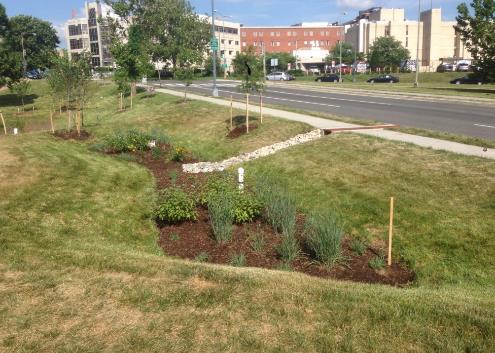

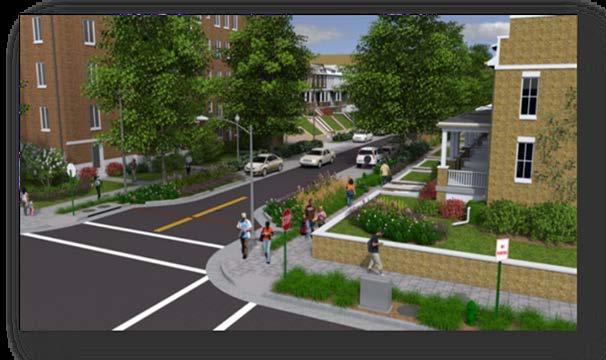
6 What is Green Infrastructure? 6

7 What is Green Infrastructure? 7

8 What is Green Infrastructure? 8

9 GI Modeling Methods Runoff/pollutant reduction Volume reduction percentage Treatment percentage Peak flow reduction Drain time/volume simulation Assume treatment volume and drain time Link with runoff model, or use as separate model Complex GI representation Model internal processes of GI practice: soil permeability, infiltration, underdrain, vertical conductivity Hydrograph Must have on-the-ground data to support level of detail Runoff Rate (MGD) Time 1990) (August to August 9 Time (August 9-11, 1990) Baseline All Practices - Intensive 9
10 Lumped Parameter Model 10

11 Lumped Parameter Model Individual GI Practice Example data for demonstration 11

12 Lumped Parameter Model Lumped GI Practice Example data for demonstration Represent all GI within a catchment as one GI practice per catchment 12
13 Hydrologic Modeling Tools MIKE URBAN by DHI Software Fully dynamic hydraulic and hydrologic model Developed for urban runoff and collection systems EPA SWMM5 Also fully dynamic hydraulic and hydrologic model Recent built-in support for LID Controls Used throughout the industry Other tools InfoWorks, InfoSWMM, PCSWMM, xpswmm, HSPF, and other H&H modeling packages EPA Stormwater Calculator, GIS, Excel, R, Python 13
14 Project and Model Progression 2015 GI Design Standards 2007 Green Buildout Model 2013 Proposed Modified Consent Decree 1998 CSO Longterm Control Planning Begins 14
15 Project and Model Progression 2015 GI Design Standards 2007 Green Buildout Model 2013 Proposed Modified Consent Decree 1998 CSO Longterm Control Planning Begins 15
16 Model Development MIKE MOUSE/MIKE URBAN collection system model Calibrated model of combined sewer area Pumps and inflatable dams operated with real-time controls Quantify volume and frequency of CSO overflows Tunnels (and other grey improvements) to reach LTCP goals Green Build-out Model (GBOM) MIKE URBAN What runoff volume can we capture with GI in DC? Green Infrastructure as depression storage with evaporation 16
17 Green Buildout Model IMPERVIOUS SURFACE GREEN INFRASTRUCTURE Roofs to Rain Barrels Building Roofs (9 sq mi) Roofs to Rain Gardens Green Roofs Streetside Bioretention Planters Sidewalks Sidewalks (3 sq mi) Streets Streets (8 sq mi) Parking Lots Parking Lots (3 sq mi) Alleys Alleys (1 sq mi) Curb Bumpout Bioretention Tree Cover Permeable Pavement 17
18 GBOM Green Infrastructure Representation Evapotranspiration Rainfall Runoff to surface Depression Storage = GI Storage Volume 18

19 Green Buildout Model Identified the potential benefits of GI implementation Quantified District-wide runoff reductions Formed basis for moving forward with Green Infrastructure 19
20 Project and Model Progression 2015 GI Design Standards 2007 Green Buildout Model 2013 Proposed Modified Consent Decree 1998 CSO Longterm Control Planning Begins 20
21 Model Development SWMM5/MIKE URBAN coupled model We know that GI is feasible in certain areas. How much do we need? Shift to SWMM5 to leverage LID Controls GI represented as mix of bioretention, pervious pavement, cisterns, and rain barrels Higher resolution drainage areas Link runoff reduction to combined sewer overflow reduction Can we use GI to offset tunnels? 21
22 SWMM5 and MIKE URBAN Linkage 22


23 SWMM5 Runoff Framework 23
24 SWMM5 LID Controls Environmental Variables Infiltration Evapotranspiration (ET) Design Variables Volume capture Time to empty 24
25 Results Indicated performance comparable to Long Term Control Plan using mix of green infrastructure and grey infrastructure EXAMPLE RESULTS FROM GROUP OF SCENARIOS GI Optimization Group 2: Optimization of Piney Branch SCENARIO % GI TUNNEL VOL STRUCTURE 70 WEIR CSO PREDICTIONS (AVE YR) (ML) HEIGHTS # CSOs VOL (ML) TM7-1 30% cm / +101 cm / +31 cm 0 0 TM7-2 0% cm / +40 cm / TM7-2B 0% 0 No change TM7-3B 30% cm / +40 cm / TM7-3C 30% cm / +55 cm /
26 Model Scenario Progression General approach: Increase GI within reasonable limits Is increase in GI enough to offset tunnel? Make small but detailed changes in grey infrastructure controls necessary to meet reduction goal Over 60 scenarios evaluated and modeled for CSO overflow frequency and volume 26
27 Results Optimized Green/Gray approach Remove and/or right-size tunnels Potomac River Tunnel reduced from 58 MG to 30 MG Piney Branch Tunnel eliminated Determined % GI implementation Range 30% to 60% across select sewersheds Refined control structure modifications 27
28 Project and Model Progression 2015 GI Design Standards 2007 Green Buildout Model 2013 Proposed Modified Consent Decree 1998 CSO Longterm Control Planning Begins 28

29 Develop GI Design Standards What if we let low flows bypass GI? What if GI is not uniformly distributed? What if we make our GI larger/smaller? 29
30 First Flush Bypass Modeling Bypass small amount of flow to save storage volume for the peak of the storm Used 3-year average period to test concept Results were mixed. In general, bypass only beneficial if full treatment depth cannot be obtained. Treatment Depth (in) 50% Impervious FFB Flow Rate per 10 acres (cfs)
 Catchments grouped into near, mid and far travel times 1.")
31 Location Sensitivity Determine if effect exists from applying GI in upstream vs. downstream locations (sewershed wide) Catchments grouped into near, mid and far travel times 1.2 inches runoff routed into idealized GI practices, which drain in 48 hours 31
32 Maximum Facility Size Volume of GI practices used in model were varied to capture full range of runoff depths over contributing area As treatment depth increases, the number of events exceeding GI capacity decreases At treatment depth greater than 1.2 diminishing to no returns on investment 32
33 Project and Model Progression 2015 GI Design Standards 2007 Green Buildout Model 2013 Proposed Modified Consent Decree 1998 CSO Longterm Control Planning Begins 33
34 Next Steps Monitor green infrastructure sites before and after GI implementation Incorporate detailed GI practices into models based on sitespecific monitoring Incorporate GI model results in receiving water quality modeling of rivers link runoff reduction and water quality improvement Use modeling to inform the GI implementation process as the DC Clean Rivers Project moves forward 34
35 Contact Special thanks to: John Cassidy, Volker Janssen, Brad Udvardy, Seth Charde, Caitlin Feehan Brian Busiek, Mike Sullivan, Justin Carl, Ed Shea, Carlton Ray Steve Skripnik Bethany Bezak Green Infrastructure Manager