FHWA Resilience & Durability to Extreme Weather Pilot Program
|
|
|
- Lillian Brown
- 5 years ago
- Views:
Transcription

1 FHWA Resilience & Durability to Extreme Weather Pilot Program Let s Talk Resilency Session presented to AMPO Annual Conference San Antonio, TX presented by Beth Alden, AICP Hillsborough MPO September 28,


2 2 2
3 3


4 4
5 5


6 Transportation Policy Federal Fixing America's Surface Transportation (FAST) Act addresses planning for and expenditures on surface transportation system Added planning factor: Improve the resiliency and reliability of the transportation system and reduce or mitigate stormwater impacts of surface transportation Florida Transportation Plan is statewide plan guiding Florida's transportation future Agile, Resilient, and Quality Infrastructure Goal Florida Statutes Long Range Transportation Plans Metropolitan planning organizations are encouraged to consider strategies that integrate transportation and land use planning to provide for sustainable development and reduce GHG emissions Slide courtesy of Lois Bush, Florida Department of Transportation

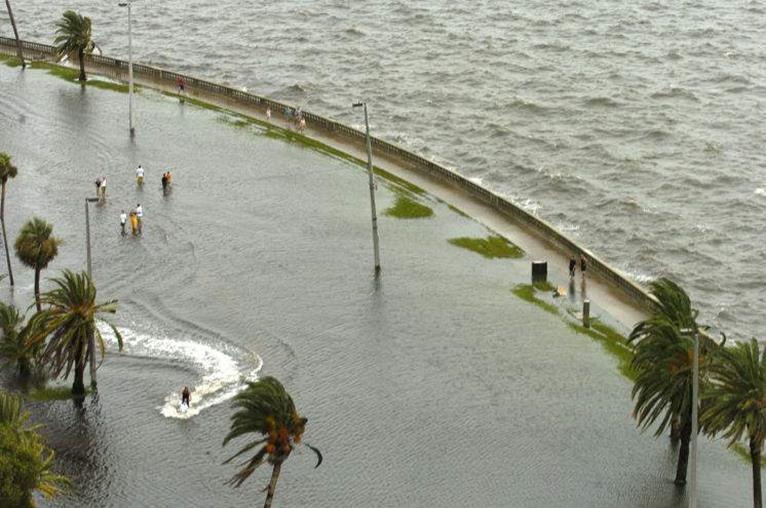
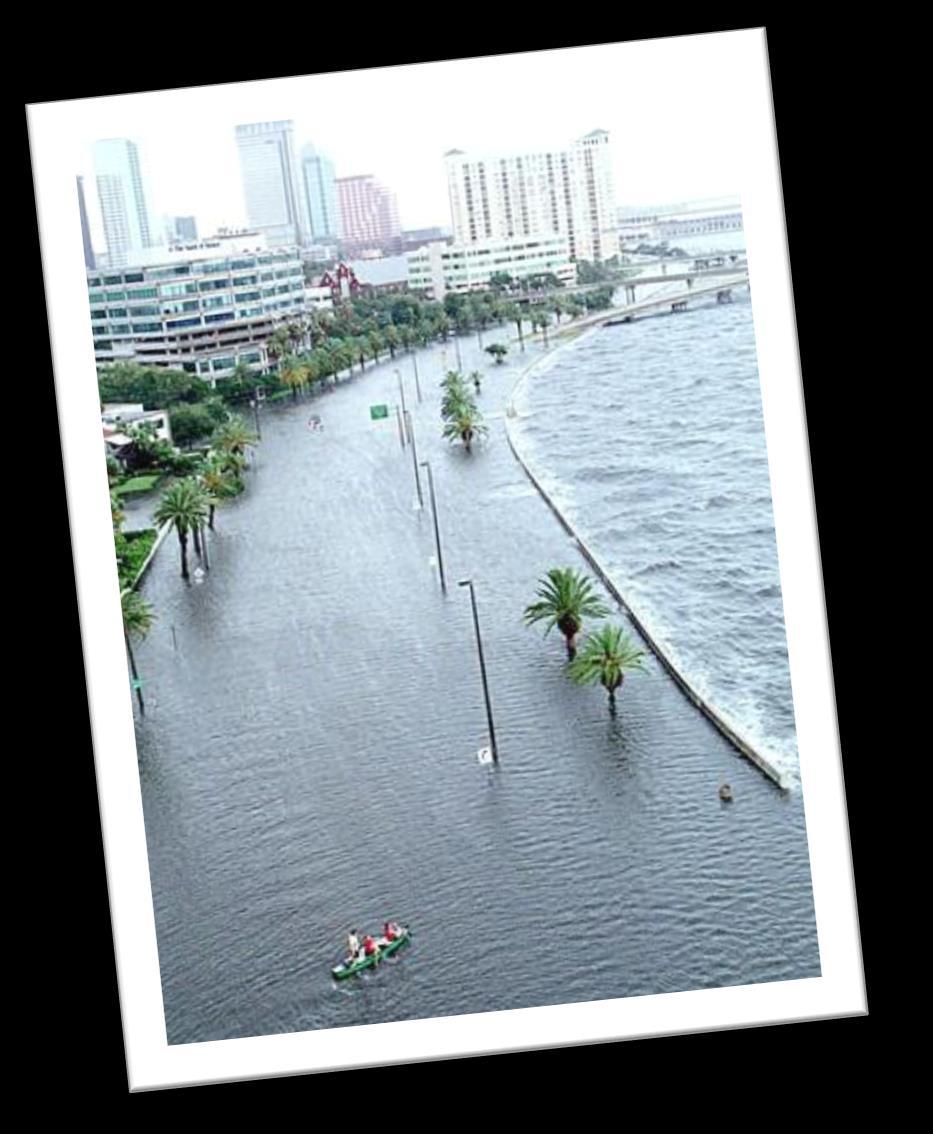
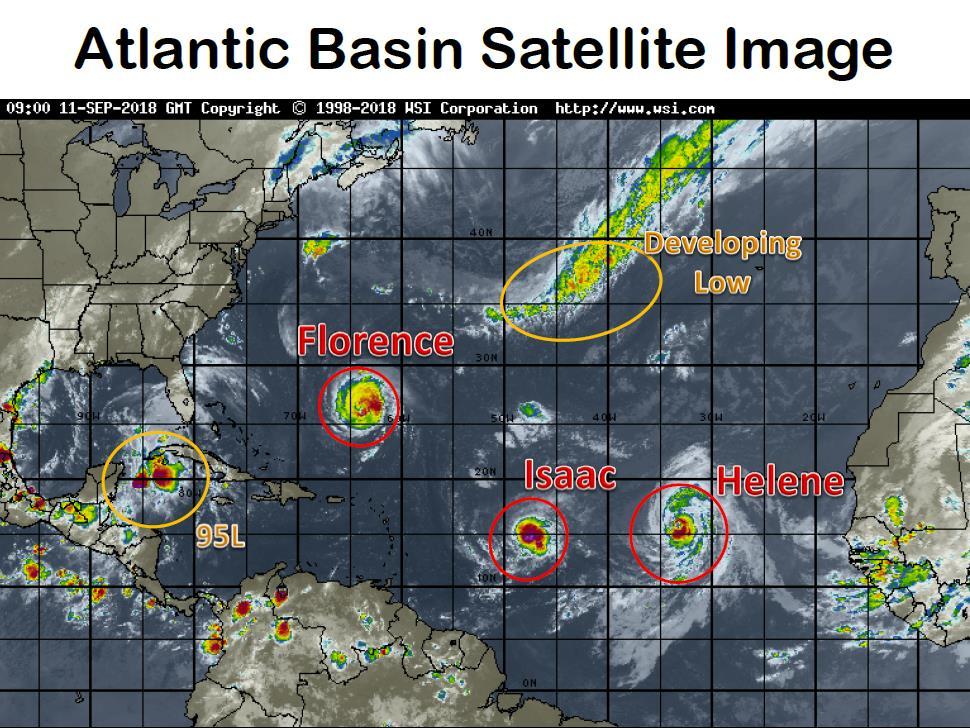
7 7 Resilient Tampa Bay Transportation: Background» Tampa Bay TMA 2.8M Population 2 nd largest pop. In FL miles of shoreline 39% pop. in flood zones» Regional vulnerability assessment of surface transportation assets Incorporate into LRTPs, hazard mitigation, emergency mgt, and PDRP plans
8 8 FHWA Pilot Program : Resilience & Durability to Extreme Weather 1 of 11 Pilot projects looking at integrating into agency practices, tools & resources, or deployment & monitoring. Tampa Bay TMA Atlanta Regional Commission Quad Cities - Iowa/Illinois MPO Caltrans Corpus Christi MPO Houston-Gaveston Area Council MassDOT Mid-America Regional Council (Kansas City, MO & Johnson Co, KS) PennDOT UDOT Navel Facilities Engineering Command (East and Gulf Coast)


9 Resilient Tampa Bay Transportation: Project Team 9
10 Work Plan Climate & Weather Obtain Data Identify Vulnerable Areas Identify at risk Transportation Fall 2018 Critical Linkages Fall 2018 Winter Stakeholder Engagement Quantitative Analysis of Critical links Adaptation Strategies Econometric Analysis Adaptation/ Mitigation Strategies Include in Decision Making Final Report Winter/ Spring 2019 Summer/Fall 2019


11 11 Criticality Determination Incorporating stakeholder input into quantitative assessment Qualitative Assessment Quantitative Assessment Stakeholder and practitioner input Persistent flooding locations Leveraging prior planning work (Current LRTP, hazard mitigation and local mitigation strategies) Weighting facilities/locations based on stakeholder input GIS-based Quantitative Analysis Context Sensitive Criticality Construct (Transportation disadvantaged population, social & economic importance) Sensitivity, exposure level and adaptive capacity Supporting Image Sources: Sustainable Convos, Northern Arizona Healthcare
12 12 Data/Information Coordination One Bay Tampa Bay RPC Local Government Public Works Hillsborough County Perils of Flood Act Matrix of Impacts Initiative Pinellas County Restore Act Vulnerability Assessment Tampa Sea Level Rise Vulnerability Assessment Local Mitigation Strategies Post Disaster Redevelopment Plans Resilient Tampa Bay Transportation: Vulnerability Assessment and Adaptation Pilot Project Tampa Bay RPC Transit Agency Asset and Operational Plans MPO Long Range Transportation Plans Water Resilient Tampa Bay Transportation Transportation
13 13


14 2045 Transportation Plan We Want to Hear from You!


15 15 What s Important to You? Consider these priorities Storm Vulnerability Traffic Jams Open/Green Spaces Alternatives to Driving Equal Opportunity Shorter Commutes Public Service Costs 1 5


16 Rate Scenario A Technology Focus DRIVERLESS CARS RAPID BUS ON SHOULDERS Results on priorities: Storm Vulnerability Traffic Jams Open/Green Space Alternatives to Driving Equal Opportunity Shorter Commutes Public Service Costs By 2045, Worse than Today By 2045, Better than Today 1 7


17 Rate Scenario B Expressway Focus TOLLED EXPRESS LANES I-275 CONVERTED TO BOULEVARD Results on priorities: Storm Vulnerability By 2045, Worse than Today By 2045, Better than Today Traffic Jams Open/Green Space Alternatives to Driving Equal Opportunity Shorter Commutes Public Service Costs 1 8


18 Rate Scenario C Transit Focus REGIONAL & STATEWIDE RAIL RAPID BUS WATER FERRY Results on priorities: Storm Vulnerability Traffic Jams Open/Green Space Alternatives to Driving By 2045, Worse than Today By 2045, Better than Today Equal Opportunity Shorter Commutes Public Service Costs 1 9
 Preserve System Reduce Crashes & Vulnerability Real Choices when not Driving Major Capacity")
19 What s in the current Hillsborough Imagine 2040 Plan? (Adopted 11/12/14) Preserve System Reduce Crashes & Vulnerability Real Choices when not Driving Major Capacity Projects For Economic Growth Minimize Traffic for Drivers & Shippers 2 0


20 21 Hillsborough MPO 2040 LRTP Performance Measures Preserve the System Road resurfacing schedule Bridge repair schedule Vehicle replacement schedule Reduce Crashes & Vulnerability Total crashes, fatal crashes, and walk/bike crashes Economic impact of a major storm Manage Traffic for Drivers & Shippers Peak-hour travel time reliability Affected truck trips Real Choices for Non-Drivers People & jobs served by the bus system and trail/sidepath network New for Major Capacity Projects for Economic Growth


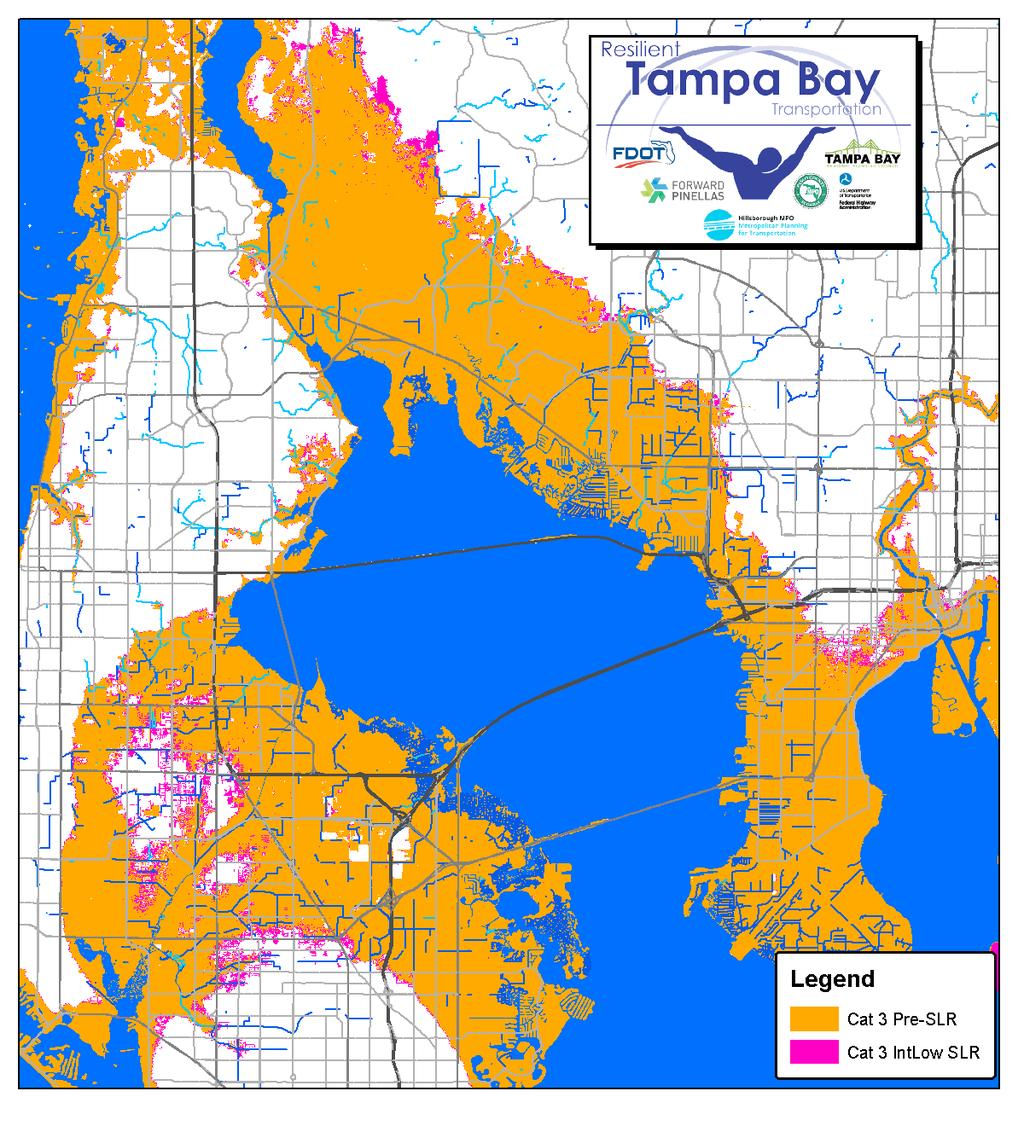
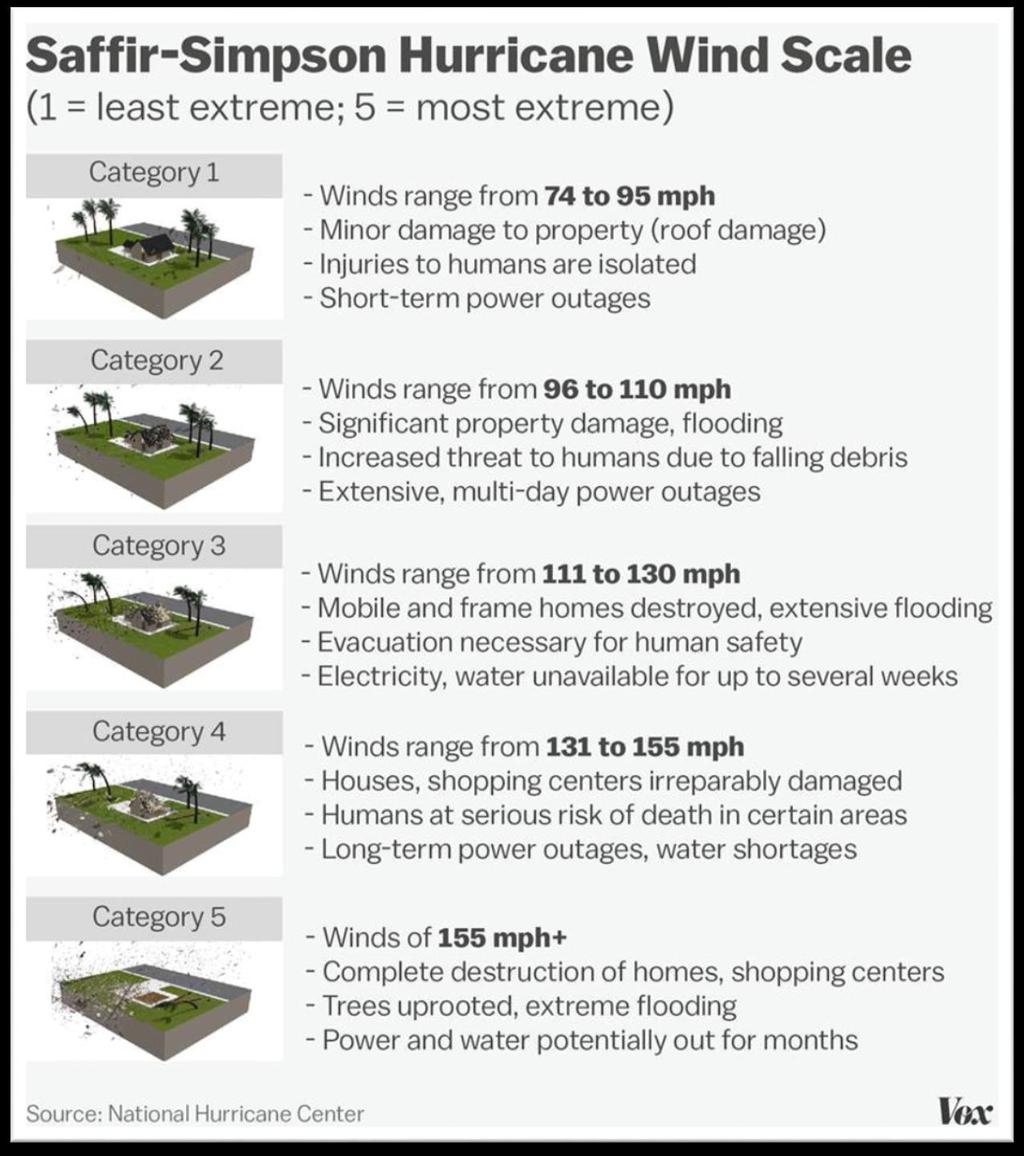
21 Vulnerability Reduction Investment Assumed in 2040 Plan Investment Level Scenario 1 Level 1 Benefits and Costs $31 Million per year Continue today's stormwater drainage improvement programs Category 3 storm impacts: - 8 weeks major roads may be unusable - $266 million economic loss $39 Million per year Scenario 8b Level 3 Continue today's stormwater drainage, plus: raise road profiles, enhance base, protect shorelines from wave damage Category 3 storm impacts: - 3 weeks major roads may be unusable - $119 million economic loss (cut in half!) Economic losses cut in half
22 23
 Interstates only: drainage")
23 What can we get if we invest in Reduced Vulnerability Based on illustrative Cat 3 storm occurring in next 20 years Investment Level 1 $988 M (current spending trend x 20 years, in YOE $) Routine drainage improvements Up to 8 weeks of road network disruption with sample Cat 3 storm Economic loss to Hillsborough County: $266 M Investment Level 2 - $1,025 M (in YOE $) Interstates only: drainage improvements, shoreline armoring & wave attenuation Up to 6 weeks of road network disruption with sample Cat 3 storm Economic loss to Hillsborough County: $153 M or 42% less $31 M investment results in $113 M benefit Investment Level 3 $1,159 M (in YOE $) Interstates & arterials: drainage improvements, shoreline armoring & wave attenuation 3 weeks of road network disruption with sample Cat 3 storm Economic loss to Hillsborough County: $119 M or 55% less $112 M investment results in $147 M benefit Estimated avoided losses are based on making highway segments less vulnerable to storm & flood damage
24 25 Typical Costs for Reduced Vulnerability Risk Mgmt. Strategy Unit Unit Cost Base/Low Medium High Raise profile/ strengthen base* Lane mile $268,883 $268,883 Wave attenuation (WADs) 1 Unit $750 $750 Shoreline protection (riprap) Lin. ft. $350 $350 Drainage improvements* CL mile $14,737 $14,737 $20,854,540 $68,807,075 $3,887,400 $17,628,600 $5,442,360 $24,680,040 $816,566 $816,566 TOTAL $31,000,866 $111,932,281 TOTAL plus contingency 20% $37,201,039 $134,318,738 * Counts marginal costs only. All costs are approximate

25 Pilot Project Follow-Up Study (2016) Gandy Boulevard critical segment in 2014 Vulnerability Assessment» 1/3-mile segment connecting bridge to planned expressway» $1.9M estimated for strategies
26 Inundation Profile Gandy Blvd (segment) Connector CATEGORY 3 Bridge CATEGORY 1


27 Adaptation Options Treatment Cost Differential Level of Risk Do nothing None initially. Reconstruction cost is $3,312,000 Highest Risk. Required if roadway is destroyed. Upgrade to full-depth concrete pavement $676,000 Medium Risk. Road damage possible if inundation occurs. Raise Profile $1,119,000 Low Risk. Inundation from storm surge, rain or tide related flooding. Erosion control via vegetation Pier protection via vegetation $104,544 Low Risk. Embankment damage or washout if inundation occurs. $30 per pier Low Risk. Pier scour or damage (total depends on design) possible if surge occurs.

28 Strategy Refinement for Implementation Refined strategies appropriate Selmon Elevated extension at Gandy Blvd. Developed conceptual designs & specific preengineering cost estimates» Within limit of $1.9M budget» Assume strategy mainstreaming as part of a project Offer low-risk, high benefit solutions to incorporate into elevated expressway extension PD&E proposal.
29 Planning for Transportation System and Transportation Project Development Phases Long Range Planning for Transportation System Preliminary Development & Environment (PD&E) Design Right of Way Construction Operations & Maintenance Increasing transportation resiliency is not linear. Need to address during all phases simultaneously. 30 Slide courtesy of Karen Kiselewski, Cambridge Systematics, Inc.

30 31 Linkages to the Long Range Planning Process Needs Assessment: Vulnerability Reduction, State & Federal Mandates Vulnerability Screening and Project Prioritization Framework Leveraging Emergency Management, Local Hazard Management Plans Vulnerability Performance Metrics Planning objectives inform Vulnerability and Risk Assessment scope setting Assets profile and investment portfolio characterize exposure System level Impact Assessment, MOEs Develop customized suite of adaptation strategies Emergency Management and Evacuation Planning Regional Mobility and Economic Impacts


31 32 Contact Information Beth Alden, AICP Executive Director x 318

32 Thank you! 33