Wind Energy. Evaluating the International Renewable Energy Market for the Creation of a Longstanding and Secure Energy Policy 12/29/10
|
|
|
- Eric Norman
- 5 years ago
- Views:
Transcription

1 Evaluating the International Renewable Energy Market for the Creation of a Longstanding and Secure Energy Policy GCC Solar Power Meeting Dec 2010 Doha, Qatar US Keynote Presentation Prof. Saifur Rahman Virginia Tech, Washington, DC Wind Energy Off-shore Wind turbines, Blyth, U.K. 2 1
 Year 1997-2020 MW World Wind Energy Association, World Wind")
2 Global Cumulative Installed Wind Capacity Source: Global Wind Energy Council, Expected Installed Wind Power Capacity (MW) Year MW World Wind Energy Association, World Wind Energy Report


3 Cumulative Wind Turbine Capacity Country Breakdown in 2009 MW Source: USA Germany China Spain India France UK Portugal Denmark Rest of World Source: Global Wind Energy Council, New Wind Power New Installed Capacity in 2009 Source: Source: Global Wind Energy Council,
4 Annul Installed Wind Turbine Capacity by Region Source: Source: Global Wind Energy Council, Top Five Countries Wind Power Installations n n n n n United States Germany China Spain India What do they have in common? - All of them have robust domestic wind power turbine generator manufacturing industries 8 4

5 Challenges are: Environmental Impact Evacuation of Power Power System Operation and Control Evacuation of Power In the US market there is an aspirational target of 20% capacity from wind power generation by 2030 The biggest challenge is not land, not technology, or the manpower availability, it is transmission access 5
 Source: Global Market Outlook for Photovoltaics")
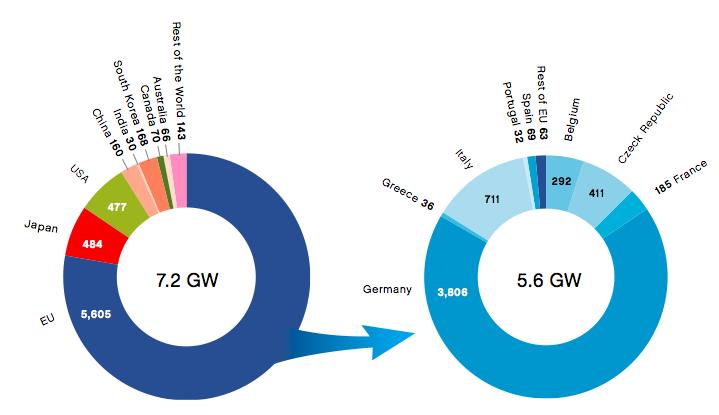
6 12/29/10 Solar Photovoltaics 11 World and EU PV markets in 2009 (MW) Source: Global Market Outlook for Photovoltaics Until May,

7 Regional PV distribuaon in the World (Policy- Driven scenario) Annual Additions Source: Global Market Outlook for Photovoltaics Until May, Solar PV ApplicaAons n Grid connected applications n Remote area applications n Building Integrated PV (BIPV) 14 7


8 12/29/ kw Grid- connected Project in China 15 Remote Area PV Project in Bangladesh 16 8


9 12/29/10 Roof- top solar photovoltaic panels, Japan Source: Energybiz Magazine 17 BIPV in Thailand Source: Solartron, Thailand 18 9

10 Solar Thermal Energy Project California, USA Project: Genesis Solar Energy Project Location: Riverside County, Ca, U.S.A. Capacity: Land: Cost: 250 MW (for 150,000 homes) 800 hectares Slightly over US $1 billion In service: 2012 (expected) 19 World Installed Concentrating Solar Thermal Power Capacity, March Megawatts Source: EPI Earth Policy Institute - Source: Plan B 4.0 Solar Energy Data - Updated. Mar. 11 th,
11 Why some countries are more successful than others? Source: Interna-onal Energy Agency (IEA Sta-s-cs 2007 data, available as of September 2010) 21 Programs to encourage renewables penetraaon Renewable Portfolio Standards (RPS) Feed-in Tariff (FIT) Source: Interna-onal Energy Agency (IEA Sta-s-cs 2007 data, available as of September 2010) 22 11
12 Renewable Portfolio Standards (RPS) State regulators mandate certain percentage of renewables mix in generation For Example, California 2020: 20% nonhydro renewables mix by 2020 Source: Interna-onal Energy Agency (IEA Sta-s-cs 2007 data, available as of September 2010) 23 Feed- in Tariff (FIT) FIT is a renewable energy policy that offers guaranteed payments to renewable energy developers for the electricity they produce FITs are responsible for approximately 75% of global PV and 45% of global wind deployment Source: Interna-onal Energy Agency (IEA Sta-s-cs 2007 data, available as of September 2010) 24 12
13 Key Provisions of FIT Payment FIT policies typically include three key provisions: Long-term purchase agreements for the sale of electricity Specified price for every kwh of electricity produced Structured with contracts ranging from years There are three broad approaches used to set the FIT payment to RE developers: Levelized cost of RE generation, plus a targeted return Estimating the value of the RE generation either to society or to the utility Auction-based price discovery mechanisms Source: Interna-onal Energy Agency (IEA Sta-s-cs 2007 data, available as of September 2010) 25 Basic FIT Payment Choice Fixed FIT policies - Guaranteed price for a fixed period of time FIT Purchase Price (c/kwh) Time FIT Price (c/kwh) Electricity Price (c/kwh) Premium FIT policies - Either a sliding or a constant premium payment on top of the spot market price FIT Premium (c/kwh) FIT Premium (c/kwh) Electricity Price Actual FIT Premium Amount (c/kwh) Time Source: Interna-onal Energy Agency (IEA Sta-s-cs Source: 2007 data, NREL, available Feed-in-Tariffs: as of September A Policy and Economic 2010) Analysis,

14 United States Incentives/Policies for Renewable Energy Federal and few state programs 27 US Federal IncenAves for RE Renewable Electricity Production Tax Credit (PTC): Commercial and industrial sectors Amount: 2.2 /kwh for wind; 1.1 /kwh for other eligible technologies. Generally applies to first 10 years of operation. Carryover Provisions: Unused credits may be carried forward for up to 20 years following the year they were generated U.S. Department of Treasury - Renewable Energy Grants: Amount: 30% of capital subsidy for solar and small wind Ends 12/31/2010 Source: Interna-onal Energy Agency (IEA Sta-s-cs 2007 data, available as of September 2010) 28 14
15 US Federal IncenAves for RE Renewable Energy Production Incentive (REPI): Amount: $0.021/kWh Term: 10 years Corporate - Modified Accelerated Cost-Recovery System (MACRS) + Bonus Depreciation ( ): 50% first-year bonus depreciation (remaining 50% of the adjusted basis of the property is depreciated over the ordinary MACRS depreciation schedule) Residential - Renewable Energy Tax Credit: Amount: 30% Expires: 12/31/2016 Source: Interna-onal Energy Agency (IEA Sta-s-cs 2007 data, available as of September 2010) 29 US Loan Programs U.S. Department of Energy - Loan Guarantee Program: Amount: Varies. Program focuses on projects with total project costs over $25 million USDA - Rural Energy for America Program (REAP) Loan Guarantees: Amount: Varies; Sectors: Commercial, Agricultural Maximum Incentive: $25 million per loan guarantee Source: Interna-onal Energy Agency (IEA Sta-s-cs 2007 data, available as of September 2010) 30 15
16 California IncenAves and Policies California Incentives/Policies for Renewable Energy Source: Interna-onal Energy Agency (IEA Sta-s-cs 2007 data, available as of September 2010) 31 California IncenAves and Policies California Feed-In Tariff - Performance-Based Incentive (time-differentiated, market-based prices): Example: FIT for Southern California Edison: At 1 PM on a weekday in June is $0.32/kWh (baseline grid supplied electricity costs about $0.20/kWh at this time)
17 California IncenAves and Policies Other examples: Property Tax Exclusion for Solar Energy Systems: 100% of system value; No maximum cap California Solar Initiative - PV Incentives - Performance-Based Buy-downs for systems under 30 kw at $2.50/W Performance-Based Incentives (PBI) for systems 30 kw and larger at $0.39/kWh for the first five years 33 New Jersey IncenAves and Policies New Jersey Incentives/Policies for Renewable Energy Source: Interna-onal Energy Agency (IEA Sta-s-cs 2007 data, available as of September 2010) 34 17
18 New Jersey IncenAves and Policies New Jersey Board of Public Utilities - Solar Renewable Energy Certificates (SRECs): Approximately $0.56/kWh as of December 2009 Property Tax Exemption for Renewable Energy Systems: 100% of value added by renewable system Solar Energy Sales Tax Exemption : Full exemption from the state's sales tax (currently 7%) for all solar energy equipment Clean Energy Capital Investment Loan/Grant Program: Grant: 50% of project cost; Loan: 0% interest for 10 years 35 Virginia IncenAves and Policies Virginia Incentives/Policies for Renewable Energy Source: Interna-onal Energy Agency (IEA Sta-s-cs 2007 data, available as of September 2010) 36 18
19 Virginia IncenAves and Policies Tenn Valley Authority - Generation Partners Program: $1,000 plus $0.12/kWh above the base rate for Solar PPA: 10 years Property Tax Exemption for Renewable Energy Systems: Allows any county, city or town to exempt or partially exempt solar energy equipment Virginia - Net Metering: Net excess generation credited to next bill at retail rate 37 Colorado IncenAves and Policies Colorado Incentives/Policies for Renewable Energy Source: Interna-onal Energy Agency (IEA Sta-s-cs 2007 data, available as of September 2010) 38 19

20 Colorado IncenAves and Policies Property Tax Exemption for Renewable Energy Systems: Allows any county, city or town to exempt or partially exempt solar energy equipment Residential Renewable Energy Rebate Program: PV: Up to $1.50/W; Wind: Up to $1.00/watt for the first 5kW and up to $0.50/watt for the next 5-10kW 39 European Union Incentives/Policies for Renewable Energy 40 20
 Cost plus profit model (Fixed Tariff): Energy FIT Duration Scale Source (USD/kWh) (years) Solar PV < 4kW (New) 0.58 25 Solar PV < 4kW (Retrofit) 0.")
21 Germany: Feed- In Tariffs Cost plus profit model (Fixed FIT Policy): - Average grid-supplied domestic electricity price: $0.29/kWh 41 UK: Feed- In Tariffs (April 2010) Cost plus profit model (Fixed Tariff): Energy FIT Duration Scale Source (USD/kWh) (years) Solar PV < 4kW (New) Solar PV < 4kW (Retrofit) Solar PV > 4-10 kw Solar PV > kw Solar PV > 100kW - 5 MW Wind < 1.5kW Wind > kw Wind > kw Wind > kw Wind > 500kW MW Wind > 1.5 MW - 5 MW Average grid-supplied domestic electricity price: $0.30/kWh 42 21
![Italy: Feed- In Tariffs 2010 Feed-in Tariff Peak Power/Type Grid connection Upto 31.12.2010 Field Plant Partially Integrated Fully Integrated (BIPV) [kw] [USD/kWh] [USD/kWh] [USD/kWh] 1-3 kw 0.53 0.](/docs-images/90/101202785/images/22-0.jpg "58 0.65 3 kw to 20 kw 0.50 0.56 0.61 > 20 kw 0.48 0.53 0.58 Average grid-supplied domestic electricity price: $0.35/kWh! 43 Italy: Feed- In Tariffs, contd.")
22 Italy: Feed- In Tariffs 2010 Feed-in Tariff Peak Power/Type Grid connection Upto Field Plant Partially Integrated Fully Integrated (BIPV) [kw] [USD/kWh] [USD/kWh] [USD/kWh] 1-3 kw kw to 20 kw > 20 kw Average grid-supplied domestic electricity price: $0.35/kWh! 43 Italy: Feed- In Tariffs, contd Feed-in Tariff (Expected) Grid connection between Dec and Apr Peak capacity Rooftop Ground- mounted [kw] [USD/kWh] [USD/kWh] 1 P <P <P <P P>1, Average grid-supplied domestic electricity price: $0.35/kWh 44 22

23 Spain: Feed- In Tariffs - Retroactive reduction in subsidies in Average grid-supplied domestic electricity price: $0.19/kWh 45 Asia Incentives/Policies for Renewable Energy 46 23
24 India: Feed- In Tariffs (Launched ) Cost plus profit model: Examples: West Bengal: Solar $0.25/kWh; PPA for 15 years Haryana: Solar $0.34/kWh; PPA for 5 years Rajasthan: Solar $0.35/kWh; $0.31/kWh Tamil Nadu: $0.27/kWh; $0.08/kWh Average grid-supplied domestic electricity price: $0.08/kWh 47 China: Feed- In Tariffs BIPV capital subsidy (> 50 kw): PHASING OUT Roof- top $ 2.26/Watt BIPV $3.01/Watt Golden Sun capital subsidy (> 300 kw): PHASING OUT Grid- connected 50% of total project cost Off- grid 70% of total project cost FIT for Solar PV Auction- based price discovery - Wind tariffs based on resource intensity $ /kWh - Average grid-supplied domestic electricity price: $0.05/kWh 48 24
25 Japan: Feed- In Tariffs Residential Solar - Net" feed-in tariff - A variant of netmetering where only excess generation receives payment Year 2009 (USD/kWh) Year 2010 (USD/kWh) Rooftop PV - "Net" FIT Large scale PV Wind Term: years - Average grid-supplied domestic electricity price: $0.23/kWh 49 Thailand: Feed- In Tariffs (Launched 2006) Avoided cost + Premium (called an adder ): Energy Source Adder Additional for diesel offsetting areas Additional for 3 southern provinces Duration (Years) Wind [USD/kWh] [USD/kWh] [USD/kWh] <= 50 kw > 50 kw Solar Total FIT = = $0.46/kwh - Average grid-supplied domestic electricity price: $0.12/kWh 50 25

26 Feed- In Tariffs Best PracAces - Payments based on the cost of generation - Payments differentiated by technology type, project size, location, and resource quality - Contracts are based on lifetime of the project - Policy stability is as important to investors as initial price - Clear interconnection rules and cost allocation procedures (e.g. for T&D) - Larger projects need to provide daily/hourly forecasts to facilitate grid balancing Source: NREL, A Policymaker s Guide to FIT Policy Design 51 Key Market Strategies n Price Support/Policies Tax Subsidies Min Fixed Payment Prices Mandates (Renewable Portfolio Standards) n Cost Reductions/Balance of Systems n New Technologies 26


27 12/29/10 Thank You Saifur Rahman 53 Thank You Saifur Rahman