ChonBuk Nat. Univ. See Hoon Lee
|
|
|
- Pamela McDonald
- 5 years ago
- Views:
Transcription

1 ChonBuk Nat. Univ. See Hoon Lee
2 CONTENTS Introduction Objective Concept Result & Discussion Conclusion


3 01 Introduction
4 01 Introduction Economic analysis methods
5 02 Objective To perform the economic evaluation of domestic biomass resources to ethanol conversion process with dual fluidized bed gasifier. To analyze the effect of delivery cost, investment cost, equipment cost, ethanol price and other operation cost on payback period, internal rate of return (IRR) and net present value(npv) Raw Material Costs 5,000Won/ton 10,000Won/ton 15,000Won/ton 20,000Won/ton Investment Costs Processing Costs Operating Costs Ethanol Price [-25% ~ 25%]
6 03 Concept Assumption A biomass to ethanol process which have recently developed in Korea and of which configuration might similar to methanol conversion process was chosen to estimate capital and operating costs. A discounted cash flow rate of return(dcfror) analysis was used to calculate PB, IRR and NPV. Domestic biomass resources which could be free were used for the assessment of biomass to ethanol conversion. A 2,000 dry ton/day BTE process were chosen and its conversion ratio and material balance were calculated by using previous research results(nrel/tp , 2007) All By products from BTE process should be used for electricity production. 3% investment inflation and 1,154Won/L ethanol price are used for assessment. Depreciation costs for the repayment of total investment might be equal during plant operation period(15 years).
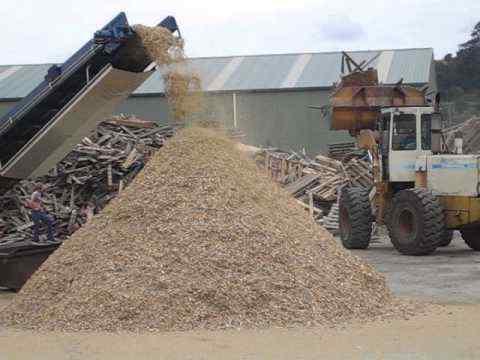
7 03 Concept 01 Bio-Ethanol production process Biomass waste Dryer Gasifier Reformer Gas Clean Up Conveyor Flue gas cooler, Blower Rotary Biomass Dryer Indirectly-heated Biomass Gasifier Cyclone Combustor Syngas Compressor Tar Reformer Catalyst Regenerator Tar Reformer Syngas Quench Chamber Syngas Venturi scrubber Ethanol Alcohol Separation Alcohol synthesis Gas Conditioning By product alcohol Molecular Sieve Ethanol Product Storage Tank Splitter Mixed Alcohol Reactor Purge Gas Expander Mixed Alcohol Gas Compressor Acid Gas scrubber Amin/ Lo-cat process
8 03 Concept Gasification Table. 1. Gasifier Operating Parameters, Gas Compositions, and Effciences Technical report NREL/TP This section of the process converts a mixture of dry feedstock and steam to syngas and char. The gasifier was modeled using correlations based on run data from the Battelle Columbus Laboratory (BCL) 9 tonne/day test facility
9 03 Concept Gas Clean Up & Conditioning This section of the process cleans up and conditions the syngas so that the gas can be synthesized into alcohol. - Particulates are removed by quenching. - The tars in the syngas are reformed to additional CO and H2. - Acid gases (CO2 and H2S) are removed. - The syngas is compressed. ü The scrubber also removes impurities such as particulates, residual ammonia, and any residual tars.


10 03 Concept Gas Clean Up & Conditioning Table. 1. Current and Target Design Performance of Tar Reformer Table. 1. Target Design Tar Reformer Conditions and Outlet Gas Composition
 would be used.")
11 03 Concept Gas Clean Up & Conditioning To meet design specification of 50 ppmv H2S and 5 mol% CO2 at the synthesis reactor inlet because sulfided catalysts were used for alcohol synthesis, the acid gas scrubber with MEA(monoethanol amine) would be used. To meet design pressure for alcohol synthesis, 5 stage centrifugal compressor with interstage cooling would be used in this calculation.
.")
12 03 Concept Alcohol synthesis It is further compressed and heated to the synthesis reaction conditions of 1,000 psia and 570 F (300 C). The syngas is converted to the alcohol mixture across a fixed bed catalyst(molybdenum-disulfide-based, MoS2). The product gas is subsequently cooled, allowing the alcohols to condense and separate from the unconverted syngas. Table. Process Conditions for Mixed Alcohols Synthesis


13 03 Concept Alcohol synthesis Table. Mixed Alcohol Reaction Performance Results Table. Mixed Alcohol Product Distributions *Prior to alcohol purification and methanol recycle
14 03 Concept Alcohol separation The mixed alcohol stream is three streams : methanol, ethanol, mixed higher-molecular weight alcohols. Alcohol separation is separated using a distillation column. The methanol stream is used to back-flush the molecular sieve drying column and then recycle. The ethanol and mixed alcohol streams are cooled and sent to product storage tanks.
15 03 Concept Investment cost includes direct cost(material, equipment, piping, electrical systems, building, yard improvement) and indirect cost(engineering, construction, legal works, project contigency) Investment Costs Operating Costs Total Cost ü Construction Costs ü Technology Costs ü Working funds ü Raw material Costs ü Catalyst, Labor Costs ü Variable Costs, etc.
16 03 Concept Capital cost by using plant index(pi) Table. Scale factor values Process Scale factor Drying 0.75 Gasification 0.65 Reforming 0.8 Synthesis Process 0.6 Separation Process 0.79 Heat & Power 0.71 Other Process 0.68 Chemical engineering magazine s plant cost indices The plant cost index and scale factor were used to calculate the capital cost of each equipment.
17 04 Result & Discussion Basic Data Sector Data Institution Forestry products Annual report of forestry products Korea Forest Service Seoul Agricultural byproducts Annual report of Agricultural byproducts Agricultural research report Statistics Korea (KOSTAT) Livestock waste Annual report of Livestock Statistics Korea (KOSTAT) Daejeon Daegu Gwangju Busan Radius of Major City (%) Urban waste Ratio of Area Annual report of Waste Generation and Treatment Ministry of Environment Seoul Daegu Daejeon Gwangju Busan Land Sea Land Sea Land Sea Land Sea Land Sea 30km km km different types of biomass, including forestry biomass, agricultural products and wastes, livestock wastes, urban wastes, were analyzed in this study. Metropolitan Cities in KOREA, which are Seoul(including Incheon), Deajeon, Daegu, Gwangju and Busan(including Ulsan), are the fiducial points of this study. Biomass resources potential is calculated by using TOE(ton of oil equivalent) for easy comparing. Space energy density(toe/km 2 ) is a factor for the concentration of biomass resources
 2x10 5 10 5 5.")
18 04 Result & Discussion Regional Energy Potential 2.5x10 6 Forestry products 2x10 5 Agricultural byproducts 2.0x10 6 Energy potential(toe) 1.5x x10 6 Total Biomass Energy potential(toe) 2x x10 5 5x km 60km 90km Daejeon Radius of Major City(km) Daegu Gwangju Busan Seoul Energy potential(toe) 3x10 6 2x km 60km 90km Daejeon Radius of Major City(km) Daegu Gwangju Busan Seoul x10 6 Energy potential(toe) 7x10 5 6x10 5 5x10 5 4x10 5 3x10 5 2x10 5 Livestock waste 0 30km 60km 90km Daejeon Daegu Gwangju Busan Seoul Radius of Major City(km) Energy potential(toe) 2x10 6 2x10 6 1x10 6 1x x10 5 6x10 5 4x10 5 2x10 5 Urban waste km 60km 90km 0 30km 60km 90km Radius of Major City(km) Daejeon Daegu Gwangju Daejeon Daegu Gwangju Busan Seoul Radius of Major City(km) Busan Seoul
19 04 Result & Discussion Regional Space Energy Densities 120 Forestry products 12 Agricultural byproducts Space energy density(toe/km 2 ) km 60km 90km Daejeon Daegu Gwangju Busan Seoul Radius of Major City(km) Livestock waste Space energy density(toe/km 2 ) Total Biomass Space energy density(toe/km 2 ) km 60km 90km Daejeon Daegu Gwangju Busan Seoul Radius of Major City(km) Urban waste 24 Space energy density(toe/km 2 ) km 60km 90km Daejeon Daegu Gwangju Busan Seoul Radius of Major City(km) Space energy density(toe/km 2 ) km 60km 90km 30km 60km 90km Daejeon Daegu Gwangju Busan Seoul Radius of Major City(km) Daejeon Daegu Gwangju Busan Seoul Radius of Major City(km)

20 04 01 Result & Discussion


21 04 Concept 80km Table. 3. Transport costs table according to distance
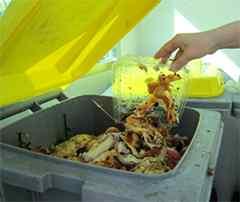
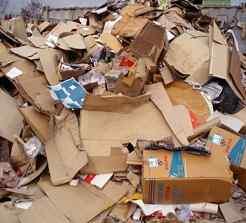
22 04 Result & Discussion Table. Biomass wastes input for the BTE process Biomass Drying Input (ton/day) Moisture Content (%) Input (ton/day) Food Waste ,632 Waste Paper 1, ,053 Waste Wood Sum 2,000 4,296 Transport Costs = 4,296ton X $ = 42,960$/day

23 04 Result & Discussion
24 04 Result & Discussion Base Condition v Plant Size v Operation period v Investment Costs v Operating Costs v Raw material Costs v Ethanol Price = 2,000dry ton /day = 15years = 246 million$ = 18.7 million$ = 10$ /ton = 1.1$/L Table. Base conditions in the Payback Period, IRR, NPV Base Payback Period 6.18 (year) IRR 13.9 (%) NPV (million $)
25 04 Result & Discussion Table. Sensitivity analysis of the raw material costs Raw material Costs Payback Period IRR NPV (Won/ton) (Year) (%) (million $) Payback Period [year] IRR [%] NPV [100 million Won] Transfer Cost [Won/ton] Transfer Cost [Won/ton] Transfer Cost [Won/ton] Figure. Sensitivity analysis od the raw material costs
26 04 Result & Discussion Analysis of investment costs and ethanol prices Base Payback Period (Year) IRR (%) NPV (million $) Investment Costs Ethanol Price +25% % % % % Base +25% Ethanol Price Ethanol Price Ethanol Price Direct Investment Cost Direct Investment Cost Direct Investment Cost Payback Period [year] IRR [%] NPV [100 million Won]
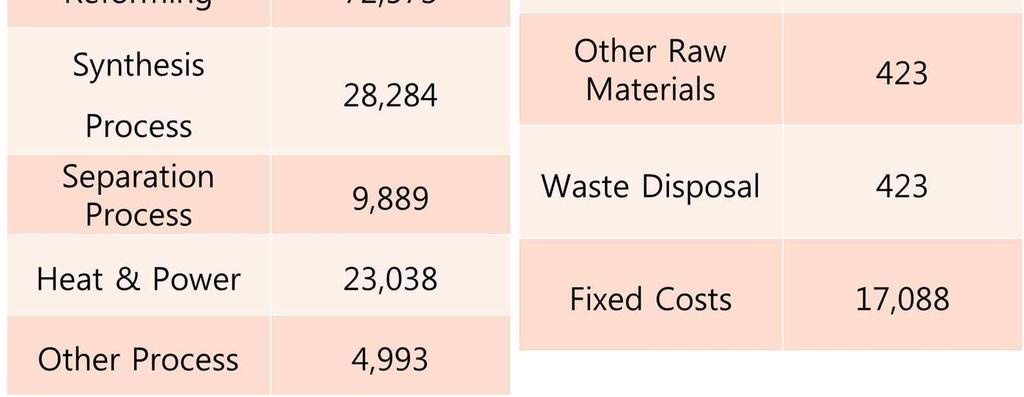
27 04 Result & Discussion Table. Sensitivity analysis of process equipments Payback Period IRR NPV Base (Year) (%) (million $) Drying Gasification Reforming Synthesis Process Separation Process Heat & Power Other Process +25% % % % % % % % % % % % % %
28 04 Result & Discussion Other Process Other Process Other Process Heat & Power Heat & Power Heat & Power Separation Process Separation Process Separation Process Synthesis Process Synthesis Process Synthesis Process Reforming Reforming Reforming Gasification Gasification Gasification Drying Drying Drying Payback Period [Year] IRR [%] NPV [100 million Won] Figure. Sensitivity analysis of process equipments
29 04 Result & Discussion Table. Sensitivity analysis of the Operating Costs Payback Period IRR NPV Base (Year) (%) (million $) Operating Costs +25% % Operating Costs Operating Costs Operating Costs Payback Period [Year] IRR [%] NPV [100 million Won] Figure. Sensitivity analysis of operating costs
30 05 Conclusion Biomass to ethanol process (2,000dry-ton/day) with dual fluidized bed gasifier might be possible in Korea because there are plenty of biomass resources. ü ü ü In normal condition, the payback period of BTE process is 6.18 years and IRR is 13.9% with billion Won NPV, because biowastes used in this assessment are assumed to be free. If delivery cost increases up to 15$/T and ethanol prices decreases down to 0.85$/L, the BTE process might have negative economic values. The cost of reforming unit, which would include reforming of tar, compressing syngas and so on, is key to develop BTE process.
31