Towards an Integrated Multi-Model Regional Air Quality Forecast System in Africa
|
|
|
- Ashley Hood
- 5 years ago
- Views:
Transcription
1 Towards an Integrated Multi-Model Regional Air Quality Forecast System in Africa Previous Experiences in Asia and South America Guy P. Brasseur Max Planck Institute for Meteorology, Hamburg, Germany and National Center for Atmospheric Research, Boulder, CO, USA and Rajesh Kumar National Center for Atmospheric Research, Boulder, CO, USA

2 New York Times, 8 November 2017: A toxic cloud has descended on India s capital, delaying flights and trains, causing coughs, headaches and even closing 4,000 schools for nearly a week. Courtyard of the JamaMasjid mosque in Delhi Sajjad Hussain/Agence France-Presse
3 An Integrated Perspective: From Drivers to Societal Impacts
4 MAP-AQ Prediction (Multi-scale shortterm weather and air quality predictions to protect public health) Monitoring (In situ and space observations of weather and atmospheric composition) International System for Monitoring, Analysis, and Prediction of Air Quality Managemen t (Translate technical details into actionable information and disseminate to public) Scenario Analysis (Design permanent air pollution control strategies to protect public health in long-term) Capacity building (Train local students, scientists and public in developing countries)


5 Developing a Predictive Understanding of the Complex Atmospheric System and its Interactions with the Whole Earth System 5 07/02/2018
6 Important Ingredients to Air Quality Models Weather Forecast: Determines the specific air quality for a particular day. Surface Emissions: Determines the level of primary pollutants Boundary Layer Formulation: Determines vertical exchanges near the surface Chemical Scheme: Determines the production of secondary pollutants


7 Comparison of emissions from 1960 to 2015 from different inventories for Africa CO Emissions in the South African region: Left: CO Right: SO 2 Very large differences between datasets C. Granier, CNRS, France SO 2
8 Comparison of emissions from 1960 to 2015 from different inventories for Africa BC Emissions in different African regions: Left: BC in northern Africa Right: OC in Western Africa Very large differences between datasets and different trends with time OC C. Granier, CNRS, France


9 African Anthropogenic Emissions Inventories for gases and particles from 1990 to 2016 S. Keita 1, C. Liousse 2, T. Doumbia 3, E. N DatchochTouré 1,2, L. Roblou 2, V. Yoboué 1, E. Assamoi 1 Detailed regional estimates of BC, OC, SO2, NOx, CO, NMVOC for the period in yearly x0.125 maps Main results for emissions Global increase of anthropogenic emissions expect for flaring emissions Biofueland open Waste Burning are main contributors of anthropogenic pollutant emissions in Africa For Biofuel particle emissions, fuel wood is the main contributor mainly used in residential sector. For Fossil Fuel particle emissions, Dieselis the main contributor mainly used in traffic sector and other combustion engine.


10 A Spectrum of Coupled Scales How do global and hemispheric patterns influence regional and local events? Global Scales Continental Scales Regional Scales Influences of local pollution sources on the regional and global scales From Xuemei Wang Long Island Local Scales Urban Scales
11 OBSERVATIONS ANCILLARY DATA Activity Information traffic, energy production Surface Emissions natural and anthropogenic Satellite Observations weather and atmospheric composition In-situ Measurements surface, ground-based profiles, onboard aircraft, ships Dataa ssimilati on GLOBAL AND REGIONAL FORECASTS Weather temperature, winds, convection, precipitation, fronts, boundary layer height, etc. Air Quality Concentration of primary and secondary chemical species incl. PM2.5, PM10, NOx, CO, VOCs, ozone Evaluation Of Products Downscaling Uncertainty Quantification SUB-REGIONAL AND LOCAL FORECASTS Urban Weather Urban Air Quality Data assimilati on Local Activity Information traffic, energy production Local Surface Emissions natural and anthropogenic Local in-situ Measurements surface, ground-based profils Improvements and Product Innovation OBSERVATIONS ANCILLARY DATA CUSTOMISATION AND DELIVERY Products Generation Concentrations, AQ indices, deposition, health impacts, alerts for intense air pollution, odors, allergenic products, fire smoke, etc. Product Dissemination Web, APIs, smartphone apps, etc.

12 The Global Dimension The Copernicus Project
")


13 The Copernicus Atmosphere Monitoring Service (CAMS) Forecasts and informs on impacts Detects emissions and estimate surface fluxes Quantifies transport, removal and transformations of atmospheric constituents Air quality Ozone layer Climate forcing Radiation CAMS in three figures 280 million observations processed every 12 hours Data from 70 satellite instruments are received and used Delivers everyday 14,000 maps online 13 Emissions


14 Forecast of Surface CO for 4 December 2017


15 Forecast of Surface CO for 4 December 2017
16 Using CAMS Global Forecasts for Regional Downscaling in Africa


17 PAPILA Predic on of Air Pollu on in La n America and the Caribbean The Regional Dimension The Panda MarcoPolo Projects in Asia The Papila Project for Latin America


18 People are directly affected by air pollution
19 An Ensemble Forecast involving 9 Models (in Europeand in China) IFS ECMWF/Copernicus (Global model) CHIMERE 2013 KNMI, The Netherlands WRF-Chem-MPI Max Planck Institute for Meteorology, Germany SILAM Finnish Meteorological Institute, Finland EMEP Met-Norway, Norway LOTOS-EUROS TNO, The Netherlands WRF-Chem-SCUEM Shanghai Meteorological Service, China WRF-Chem NJU Nanjing University, China WARMS-CMAQ Shanghai Meteorological Service, China
 www.marcopolo-panda.")
20 Schematic Overview Data Flow Forecast model #1 Postprocessing... Forecast Retrieval hourly model #9 station measurements Postprocessing Retrieval from local server Central database (KNMI) Calculation ensemble Generation images (time series and maps) Publication on webserver
 6pm (LT) NCEP GFS")
 WRF Meteo spinup KNMI www.")
: 10pm (LT) 3d Forecasts Chem.")
21 Operational Forecasting System at MPI-M with WRF-Chem (DKRZ, Hamburg, Germany) 6pm (LT) NCEP GFS Meteorol. Forecasts 10pm (LT) WRF Meteo spinup KNMI 00:00 (LT): 10pm (LT) 3d Forecasts Chem. BC: ECMWF CAMS Dissemination aqicn.org/forecast Chem. IC: Day -1 Forecast HTAPv2 FINN Emissions


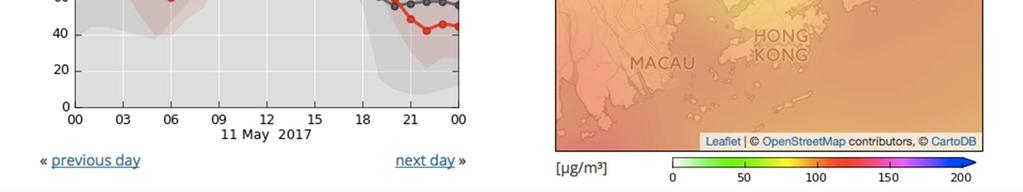
22 NO 2 NO 2 Shenzhen 11 May 2017 O 3 O 3 22


23 Ensemble Median for Guangzhou PM November 2017


24 C-IFS ECMWF WRF-CHEM SMS


25 EMEP LOTOS EUROS

26 MEDIAN Beijing 10 March 11 March PM March NO 2 O 3


27 MEDIAN Beijing 10 March 11 March PM March NO 2 O 3
28 NO 2 and O 3: Mirrors of each other. 11 March 2017 Beijing CHIMERE WRF-Chem SCUEM WRF-Chem MPI CHIMERE WRF-Chem MPI WRF-Chem SCUEM


29 Clear Clear N PM2.5 N SBeijing N S Haze Ice Fog -3C Sunny 9C NO 2 Beijing Median Values 6 December 2016 O 3 Beijing 7 December December 2016
30 Model Evaluation: 7 models for 38 Chinese cities 1-15 March 2017

31 Model Evaluation: 7 models for Shanghai 1-15 March 2017
32 Objective of the Papila Project Prediction of Air Pollution in Latin America and the Caribbean To establish a sustained networkof partners with complementary expertise that develops and implements an analysis and forecast system for air quality with downscaling capability for Latin America and the Caribbean region; to assess the impactof air pollution (background and peaks) on public healthand on the economy. This system will help decision-makers improve air quality and public health, and avoid the occurrence of acute air pollution episodes, particularly in urban areas.
33 The Structure of Papila Meteorological Input and Weather Forecast Economic Input WP-3 Surface Emissions WP-5 Groundbased Observations and Model Evaluation WP-2 Development of Modelling Framework Daily Forecast Reanalysis Initial and Boundary Conditions WP-4 Space Observations in Support of Air Pollution Forecasts Air quality Indices Crop damage Population exposure Health Communication Education WP-6 Transfer of Knowledge, Education and Capacity Building Dissemination Exploitation WP-1 Management and Coordination
34 The Papila Consortium Coordination: MPG and UCL 1. MPG Germany 2. CNRS France 3. MET Norway 4. FMI Finland 5. INERIS France 6. KNMI Netherlands 7. SU Sweden 8. UGA France 9. TROPOS Germany 1. UCL Chile 2. USP Brazil 3. UNAL Colombia 4. CNEA Argentina 5. UMSA Bolivia 6. USM Chile 7. IVIC Venezuela 8. UNAM Mexico 9. UPR-RP Puerto Rico
35 Working as an International Team and Highlighting Complementarities MPG-Germany MPG-Germany CNRS-France MetNO-Norway UGA-France MPG-Germany FMI-Finland KNMI-The Netherlands MetNO-Norway INERIS-France ECMWF-UK Coordination of the Network Management Education and Knowledge Transfer Interactions with users Courses and training, summer schools Modeling Model development Air Quality Forecasts Downstream applications Impacts(Health) UCL-Chile USP-Brazil UCL-Chile CNEA-Argentina USP-Brazil UCL-Chile UPR-PR-Puerto Rico CNRS-France INERIS- France KNMI-The Netherlands SU-Sweden UGA-France Surface Emissions Evaluation of proxies and input data Regional Inventory for Latin America Space and Ground Observations Estimate of surface concentrations and trends Establishment of a common database Top-down emission inventories Assimilation of observations Analysis of pollution episodes UCL-Chile CNEA, Argentina UNAL, Columbia USM, Chile USP-Brazil UMSA-Bolivia UNAM-Mexico IVIC-Venezuela UPR-RP-Puerto Rico

36 The Local Dimension


37 The Local Dimension

38 The physical modeling system: ----A spectrum of coupled scales Current technology for operational weather and climate prediction Global Scales Continental Scales Regional Scales Long Island Local Scales Urban Scales
 Building energy models Indoor-outdoor")
39 Challenge in representing multi-scale urban microclimate Mesoscale models New technology for coupling fine-scale models Urban Scale models (CFD, LES) Building energy models Indoor-outdoor exchange


40 Flow, turbulence, and pollutant dispersion in urban atmospheres From Fernando et al. (2010)


41 MEIC inventory Downscaling Emissions (VITO) µg/m 3 Open source GIS data Local sector split Missing pollutants Downscaling proxy data MarcoPolo Standard resolution inventory MarcoPolo High resolution inventory Satellite based emission estimates
42 Chemical Transport Models (CTMs)

")
43 Chemical Transport Models (CTMs)
44 Direct Numerical Simulations in Convective Boundary Layer with Simple Chemistry 3D Direct Numerical Simulation with simple chemistry scheme (NO + O 3 NO 2 ) NOis emitted at the surface with constant flux O 3 is entrained from the free troposphere as the boundary layer grows in height. Chemical time constant = turbulence time constant Ozone 16 km (512) 12 km 12 km ( grid points) NO
45 Reaction NO + O 3 NO 2 Same time constant for turbulence and chemistry Production of NO 2 is given by the product kno O 3 Evolution of the concentration of NO 2 in the PBL

 in street canyons interact")
.")


46 Downscaling Chemical Concentrations to sub-urban Scales Large Eddy Simulations NOx Ozone Locally emitted pollutants (e.g., NOx, VOCs) in street canyons interact chemically with background atmospheric species (e.g., ozone). Reaction rates are affected by turbulence mechanically and thermally generated in the urban canopy Large eddy simulation (LES) models coupled to regional mesoscalemodels (e.g., WRF) will be used to simulate the turbulent transport and chemical transformations of pollutants in the urban environment.


47 Ozone Flow NO + O 3 NO 2 + O 2 Production of NO 2 Source of NO Model of Chun-Ho Liu Hong Kong University
48 Suggestions Identify which quantities we would like to forecast operationally (PM, O 3, CO, NOx, VOCs?) Select 1 or 2 regions for pilot studies, and define for each of them the target of the forecast. Establish for each pilot region a multi-institutional team that will work together and develop the monitoring, analysis and forecast system. Develop an emission inventory for the needs, connect with the best weather forecast, link with space observations Link this regional activity with the CAMS global forecast Develop a validation system to check the performance of the forecasts, based on observations and monitoring


49 Using CAMS Global Forecasts for Regional Downscaling in Africa


50 Thank You