FRESNO LOCAL AGENCY FORMATION COMMISSION (LAFCO) EXECUTIVE OFFICER S REPORT
|
|
|
- Leonard Wiggins
- 5 years ago
- Views:
Transcription
1 DATE: October 9, 2013 FRESNO LOCAL AGENCY FORMATION COMMISSION (LAFCO) EXECUTIVE OFFICER S REPORT AGENDA ITEM NO. 13 TO: FROM: Local Agency Formation Commission David E. Fey, AICP, Executive Officer SUBJECT: Report Progress on the Fresno Council of Governments Regional Transportation Plan Recommendation: Receive Report, Provide Direction If Needed Background RTPs are planning documents developed by Metropolitan Planning Organizations (MPOs) and Regional Transportation Planning Agencies (RTPAs) in cooperation with Caltrans and other stakeholders. They are required to be developed by MPOs and RTPAs per State legislation (Government Code Section et seq.) and Federal regulation (Title 23 USC Section 134). The RTP establishes regional goals, identifies present and future needs, deficiencies and constraints, analyzes potential solutions, and estimates available funding and proposed investments. Fresno COG's Regional Transportation Plan (RTP) has a 25-year horizon but must be updated every four years. With the approval of SB 375 in 2008 comes a requirement that RTPs include a Sustainable Communities Strategy (SCS) that considers land uses, housing allocation goals, the regional transportation network, farmland conservation, and a forecasted development pattern for the region, which, when integrated with the transportation network and other transportation measures and policies, will achieve greenhouse gas emission reduction targets established by the Air Resources Board for the San Joaquin Valley (5% by 2020 and 10% by 2035). LAFCo Participation in the RTP Process Fresno COG formed a RTP Roundtable committee to support the Fresno COG staff and COG standing committees in their development and preparation of the 2014 Regional Transportation Plan and Sustainable Communities Strategy. The 35-member Roundtable is comprised of a representative from each of our local member agencies, the San Joaquin Valley Air Pollution Control District, LAFCo, Caltrans, public transportation, transportation planners, agriculture, building/development, environment, the Environmental Justice Task Force, Bicycle/Pedestrian advocates, banking/finance or real estate, health, affordable housing, goods movement, broadbased business, Federally recognized tribal governments, and includes three positions for those who represent the public-at-large. The Roundtable has been meeting monthly since August The Commission has been receiving updates on Roundtable activities on a periodic basis. The Roundtable comments support the final decision on the RTP by the Fresno Council of Governments Policy Board. 1
2 COG is obliged by SB 375 to model forecasted development patterns to ensure that they meet the greenhouse gas (GHG) reduction targets set by the Air Resources Board. The Roundtable has assisted COG staff to develop a range of development pattern scenarios to be modeled to determine compliance with the ARB s GHG reduction targets. These are: Scenario A was based on public input from the November 2012 workshop that was conducted by the COG. Participants were encouraged to vote for their preferred land uses by way of voting clickers and stickers on maps. Scenario B was developed to reflect current planning assumptions; it was developed after extensive outreach to the cities and the county about their growth plans and planning assumptions for land uses likely to be developed in the 2020 and 2035 horizons. Scenario B also included land uses based on the draft General Plan updates for Fresno and Clovis, both heavily influenced by the Valley-wide Blueprint goals. Scenario C was developed by the Roundtable largely at the request of the communitybased organizations who expressed that Fresno and Clovis plans were not ambitious enough to make a significant impact on environmental issues. A fourth scenario, D, was recently proposed by the community-based organizations and determined initially that the new Scenario D did less well overall compared with Scenario C. The activists asked for more time to debug the program and fine-tune it feeling that this would improve its performance. At the September 18 meeting, the Roundtable did not support Scenario D though COG staff will continue to refine its model results as directed by the TTC/PAC at its September 13th meeting. Recent Action by the RTP Roundtable At its September 18, 2013, meeting, after over a year of meetings, the RTP Roundtable voted 11-6 to endorse Scenario B for inclusion in the SCS. All four scenarios achieved the GHG reduction targets set by the ARB. Handouts from this meeting are attached to this report. A color version of the PowerPoint presentation is available on the LAFCo website at Your Executive Officer supported Scenario B because it was based on current or proposed general plans, was grounded in realistic planning assumptions, and was consistent with adopted spheres of influence. There is some disagreement or lack of understanding on the part of the committee members as to the effect of recommending a scenario that is not consistent with cities and the county s current or updated general plans. Prior to the Roundtable s recent vote, a committee member asked an air quality activist how adopting a scenario (A, C, or D) that wasn t based on current and proposed plans could affect Fresno County s transportation planning. The response was: if the scenarios don t match the (city or county) plan, then all you have to do is change the plan. The community based organizations have yet to articulate to the member agencies satisfaction how recommending a scenario that is not consistent with cities and the county s current or updated general plans won t have a negative effect on future transportation funding or achieving a certified housing element. Your Executive Officer believes it was this possibility that the COG s RTP could have a direct effect on local agency planning and impair local land use authority that influenced the Roundtable s recommendation of Scenario B. 2
3 Though the issue above have not been resolved directly, based on discussion with senior COG staff, it is likely that though a SCS scenario that is inconsistent with general plans wouldn t require a member agency to change its general plan, it could preclude funding for transportation projects that weren t consistent with the RTP/SCS. A recommendation on the scenarios will be presented to the TTC/PAC at a joint meeting on October 4 th, prior to consideration by the Policy Board. COG staff will attend the Commission meeting to respond to any questions about the TTC/PAC action. Technical Transportation Committee/Policy Advisory Committee (TTC/PAC) Discussion There was a question raised during the September 13 th TTC/PAC meeting as to why LAFCo and the school districts weren t more active on the RTP process. In response to this comment staff notes that the interests of the Commission as expressed in Cortese-Knox-Hertzberg Act have been represented in this process, and since the Commission is prohibited by statute from exercising land use authority, it may not be appropriate for the Commission to directly participate on scenarios that may alter adopted and locally-originated plans. Your previous and current Executive Officers have been charter members of this committee and have participated in the scenario development. The Commission has been briefed periodically and has had the opportunity to ask questions and provide direction as necessary. Further, representatives of all Fresno County cities and the County have been invited to participate in this process from the beginning, even as far back as the COG s Greenhouse Gas Reduction Target Setting Committee that predates the RTP roundtable by two years. TTC/PAC suggested that staff convene a workshop for member agencies, LAFCo and the school districts to discuss the SCS scenarios and their implications. COG staff has tentatively planned that joint workshop for October 23rd at 10:00 a.m. in COG s Sequoia conference room. Your Executive Officer will attend and participate in this workshop. If the Commission seeks a larger presence in the process, it may consider selecting a member to attend and participate in this workshop. 3
4 Scenario > A B C D Central Theme Public input from November 2012 workshop Current planning assumptions Foothill growth to City of Fresno Proposed By Public Member Agencies RTP Round Table Defining Characteristics Communities with Significant Changes in Growth Allocation* Considers public input from November 2012 workshop Growth in the metro area conforms to historical trend Some rural communities receive much higher growth Less Growth Clovis, Coalinga, Parlier, Sanger Auberry, Friant Ranch, Millerton, Shaver Lake More Growth Firebaugh, Fresno, Huron, Kerman, Kingsburg, Orange Cove, San Joaquin Caruthers, Easton, Lanare, Laton, Raisin City, Riverdale, Squaw Valley Follows current general and specific plan updates Growth allocation follows historical trend Includes development in Friant Ranch, Millerton, and the proposed pharmacy school Each city/community receives growth based on historical trend Additional 4% of countywide growth allocated to City of Fresno along corridors and activity centers Unincorporated growth constrained to 10 existing communities; little change in incorporated cities Development in Friant Ranch, Millerton, and the proposed pharmacy school not included No Growth Auberry, Friant Ranch, Millerton, Raisin City, Squaw Valley More Growth Fresno Foothill growth to existing communities Coalition of Community Organizations Developed by coalition of community organizations Growth reduced from the foothill communities and the City of Clovis and reallocated to existing cities and communities Development in Friant Ranch, Millerton, and the proposed pharmacy school not included No Growth Friant Ranch, Millerton Less Growth Clovis Auberry More Growth Fowler, Fresno, Kingsburg, Parlier, Reedley, Sanger, Selma Laton, Riverdale *Compared to planning assumptions based on historical trend. Cities/communities not listed will receive growth approximately consistent with historical trend.
5 Fresno COG's Sustainable Communities Strategy Scenario Performance Indicator Comparisons Performance Measure/Indicator Definition Scenario A Scenario B Scenario C Scenario D Status Quo Greenhouse Gas emission reduction Percentage of per person greenhouse gas reduction against : -8.15% 2035: % 2040: % 2020: -7.86% 2035: % 2040: % 2020: -8.36% 2035: % 2040: % 2020: -7.91% 2035: % 2040: % 2020: -6.59% 2035: -7.97% 2040: -8.56% Housing Percent of housing by types Single Family: 44.1% Town Homes: 9.0% Multi-Family: 46.9% Single Family: 53.1% Town Homes: 9.1% Multi-Family: 37.8% Single Family: 45.1% Town Homes: 8.3% Multi-Family: 46.6% Single Family: 52.4% Town Homes: 8.2% Multi-Family: 39.4% Single Family: 77.7% Town Homes: 7.3% Multi-Family: 15.1% Residential density Average housing units per acre of new growth 7.8 Housing Units per acre 7.1 Housing Units per acre 8.2 Housing Units per acre 8.1 Housing Units per acre 4.5 Housing Units per acre Compact development Average number of people per acre 32.9 people per acre 27.2 people per acre 31.5 people per acre 30.8 people per acre 16.2 people per acre Transit-oriented development Share of the region's growth in households and employment within half-mile of Bus Rapid Transit (BRT) Housing Units: 27,475 (28.0%) Employment: 35,805 (43.7%) Housing Units: 20,389 (21.3%) Employment: 29,958 (36.6%) Housing Units: 26,416 (27.1%) Employment: 34,646 (42.3%) Housing Units: 18,245 (19.4%) Employment: 37,024 (44.0%) Housing Units: 5,787 (6.4%) Employment: 9,969 (12.2%) Land consumption Acres of land consumed due to new development 11,226 acres 14,675 acres 12,542 acres 12,578 acres 22,308 acres Important farmland consumed Total acres of important farmland (prime, unique and statewide importance) consumed due to new growth 90.6 acres 37.6 acres 27.4 acres 109 acres 352 acres Vehicle Miles Traveled (VMT) Total Vehicle Miles Traveled (VMT) on a typical day in 2035 Total VMT: 19,789,601 miles Per capita VMT: 15.2 miles Per capita reduction: -11.1% Total VMT: 19,924,347 miles Per capita VMT: 15.3 miles Per capita reduction: -10.5% Total VMT: 19,638,153 miles Per capita VMT: 15.1 miles Per capita reduction: -11.8% Total VMT: 19,768,138 miles Per capita VMT: 15.2 miles Per capita reduction: -11.2% Total VMT: 20,743,263 miles Per capita VMT: 15.9 miles Per capita reduction: -6.8% Criteria pollutants emissions Tons of pollutants released per a typical day in 2035: Carbon Monoxide, Reactive Organic Gases, Nitrogen Oxide, Particulate Matter 10, Particulate Matter 2.5 Carbon Monoxide: 40 tons Reactive Organic Gases: 4.6 tons Nitrogen Oxide: 11.3 tons Particulate Matter 10: 7.9 tons Particulate Matter 2.5: 1.0 tons (All Pass Conformity) Carbon Monoxide: 40 tons Reactive Organic Gases: 4.6 tons Nitrogen Oxide: 11.4 tons Particulate Matter 10: 7.9 tons Particulate Matter 2.5: 1.0 tons (All Pass Conformity) Carbon Monoxide: 40 tons Reactive Organic Gases: 4.6 tons Nitrogen Oxide: 11.3 tons Particulate Matter 10: 7.8 tons Particulate Matter 2.5: 1.0 tons (All Pass Conformity) Carbon Monoxide: 40 tons Reactive Organic Gases: 4.6 tons Nitrogen Oxide: 11.3 tons Particulate Matter 10: 7.9 tons Particulate Matter 2.5: 1.0 tons (All Pass Conformity) Carbon Monoxide: 41 tons Reactive Organic Gases: 4.8 tons Nitrogen Oxide: 11.6 tons Particulate Matter 10: 8.2 tons Particulate Matter 2.5: 1.0 tons (All Pass Conformity) Active Transportation and transit travel Weekday person trips by transit, walk and bike modes Transit: 49,155 trips Walk: 180,009 trips Bike: 57,065 trips Transit: 47,202 trips Walk: 175,316 trips Bike: 56,213 trips Transit: 48,765 trips Walk: 177,172 trips Bike: 56,743 trips Transit: 49,117 trips Walk: 177,761 trips Bike: 57,127 trips Transit: 40,650 trips Walk: 138,033 trips Bike: 48,715 trips Central Theme of Scenario - Proposed by Public Input from November 2012 Public Workshop Current planning assumptions - member agencies Foothill growth to City of Fresno - RTP Roundtable Foothill growth to existing communities - Coalition of Community Organizations 9/18/2013

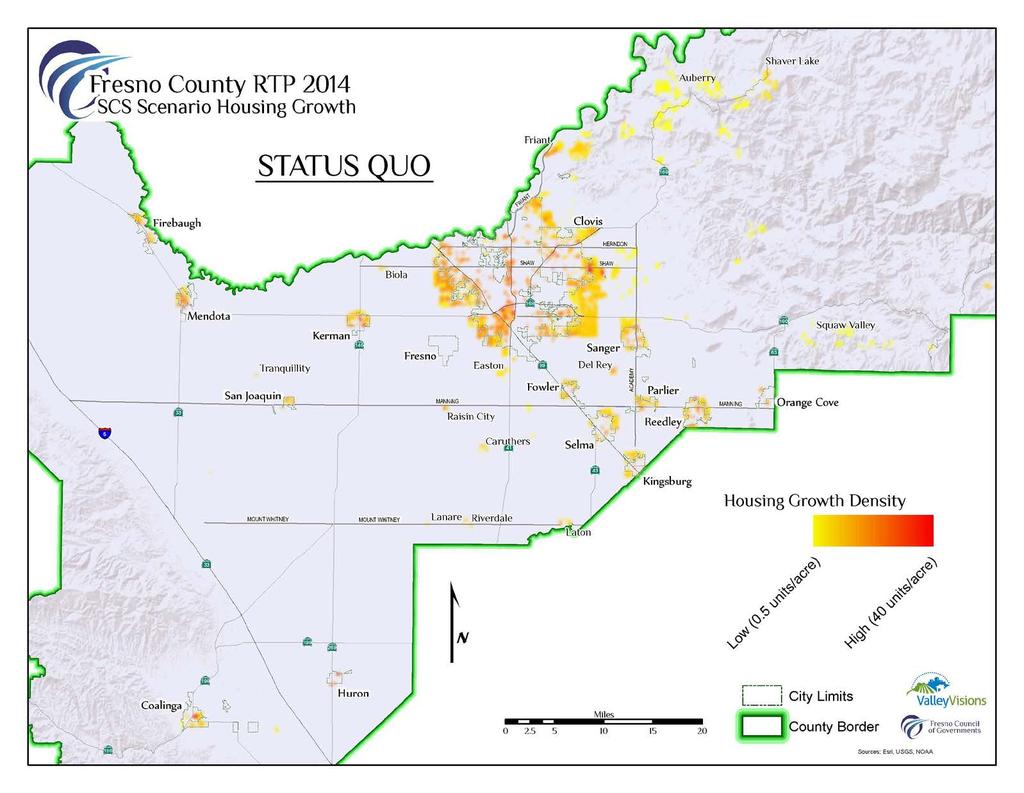
6 Fresno Council of Governments Sustainable Communities Strategy Scenarios
7 3 SCS Scenario Scenarios: A Scenario A Based on the input collected at the community workshop in November 2012 Metro vs. nonmetro growth ratio controlled More growth allocated to some small rural communities than historical trend 2

8 3 SCS Scenarios: Scenario B Based on the existing general plans, general plan updates, proposed land uses, and latest planning assumptions Growth allocation among cities takes into account historical trend Include development in Millerton New Town, Friant Ranch, and the proposed pharmacy school 3
9 3 SCS Scenarios: Scenario C Additional 4% of growth (compared to scenario B) allocated to City of Fresno along corridors and activity centers Growth for rural county areas allocated to 10 unincorporated communities: Biola, Caruthers, Del Rey, Easton, Friant, Lanare, Laton, Riverdale, Shaver Lake, and Tranquility Not included: Millerton New Town, Friant Ranch and the proposed pharmacy school 4
10 3 SCS Scenarios: Scenario D Developed by a Coalition of community organizations Growth reduced from the foothill communities and the City of Clovis and reallocated to existing cities and communities Not included: Millerton New Town, Friant Ranch and the proposed pharmacy school 5


11 SCS Scenarios-Transportation Projects Project Funding by Mode 43% 25% 30% 2% Transit Bike & Pedestrian Operations & Management Capacity Increasing 6

12 Growth Projection (From 2008 through 2035) Population growth: 378,140 more people Employment growth: 81,912 more jobs 7
13 8
14 9
15 10
16 11
17 12
18 13
19 14
20 15
21 What is a Performance Indicator? Performance indicators provide quantified evidence of the consequences of a decision or action In the SCS process, performance indicators are used to measure the impacts of different planning scenarios 16
22 Greenhouse Gas Emission Reduction (Per capita percent reduction against 2005) 14.0% 12.0% 12.6% 11.9% 11.9% 11.3% 13.2% 12.4% 12.5% 11.8% 10.0% 8.0% 6.0% 6.6% 8.6% 8.0% 8.2% 7.9% 8.4% 7.9% % % 0.0% Status Quo Scenario A Scenario B Scenario C Scenario D 17
23 Housing (New Housing Growth from ) 100% 90% 15% 80% 70% 7% 47% 38% 47% 39% 60% 50% 40% 30% 20% 78% 9% 44% 9% 53% 8% 45% 8% 52% Multi-family Town Homes Single Family 10% 0% Status Quo Scenario A Scenario B Scenario C Scenario D 18
24 Residential Density (new growth from ) (housing units per acre of land) Status Quo Scenario A Scenario B Scenario C Scenario D 19
25 Compact Development (new growth from ) (Average number of people per acre of land) Status Quo Scenario A Scenario B Scenario C Scenario D 20
26 Transit Oriented Development (Percent Growth within ½ mile of Bus Rapid Transit for the growth from ) 50.0% 45.0% 40.0% 35.0% 43.7% 36.6% 42.3% 37.0% 30.0% 25.0% 20.0% 28.0% 21.3% 27.1% 18.2% Housing Employment 15.0% 10.0% 5.0% 6.4% 12.2% 0.0% Status Quo Scenario A Scenario B Scenario C Scenario D 21
27 Land Consumption (new growth from ) 25,000 20,000 22,308 In acres of land consumed due to new development 15,000 11,226 14,675 12,542 12,578 10,000 5,000 0 Status Quo Scenario A Scenario B Scenario C Scenario D 22
 consumed due to new growth 90.6 37.6 27.")
28 Important Farmland Consumed (by new growth from ) Acres of important farmland (Unique, Prime and State-wide importance) consumed due to new growth Status Quo Scenario A Scenario B Scenario C Scenario D
29 Vehicle Miles Traveled (VMT) (in millions of miles per day in 2035) Status Quo Scenario A Scenario B Scenario C Scenario D 24
30 Criteria Pollutants Emissions (CO, ROG,NOX,PM2.5,& PM10) (tons per day in 2035) Status Quo Scenario A Scenario B Scenario C Scenario D CO ROG NOx PM10 PM2.5 25
31 Active Transportation & Transit Travel (non-private auto trips per day in 2035) (in thousand person trips) Status Quo Scenario A Scenario B Scenario C Scenario D Transit Walk Bike 26

32 Scenario Indicators/Performance Measures Why are these important to me? If any of these issues are important to you, you should consider the indicators to the right Criteria Pollutants Emissions Transit Oriented Development Vehicle Miles Traveled Greenhouse Gases Land Consumption Compact Development Residential Density Important Farmland Consumed Housing types Active Transportation & Transit Travel Air quality & health Transportation choices Housing type options Farmland & resource conservation 27

33 Fresno Council of Governments