MARAMA Webinar August 7, Angelos Kokkinos Chief Technology Officer Babcock Power, Inc.
|
|
|
- Julius Logan
- 5 years ago
- Views:
Transcription


1 MARAMA Webinar August 7, 2014 Angelos Kokkinos Chief Technology Officer Babcock Power, Inc.
2

3 Rankine cycle is a thermodynamic cycle which converts heat into work. The heat is supplied externally to a closed loop, which usually uses water as the working fluid.

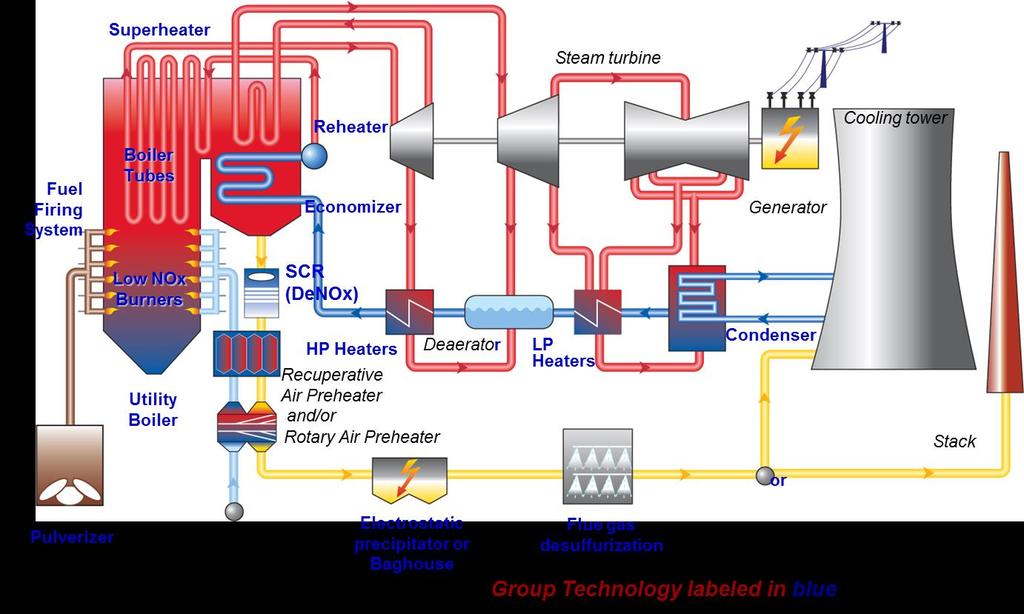
4 Typical power steam generation cycle has four main components: Boiler Turbine Condenser Feed Pump Process Steps 1-2: Increase pressure of condensate, then increase temperature through economizer 2-3: Increase energy by adding heat to get water to steam and superheated steam 3-4: Expand steam through HP turbine 4-5: Reheat steam through Reheater 5-6: Expand steam through IP and LP turbine 6-1: Condense steam in condenser
5 Thamir K. Ibrahim, M. M. Rahman, "Effect of Compression Ratio on Performance of Combined Cycle Gas Turbine", International Journal of Energy Engineering, Vol. 2 No. 1, 2012, pp doi: /j.ijee

6 Combines a combustion turbine with a steam generator Combines Brayton and Rankine cycles 30 50% typical efficiency improvement over Rankine steam generation
7 Definition Measures the combined performance of the turbine cycle, boiler cycle and associated power auxiliaries The amount of energy input (consumed) to generate electricity Btu/kWh Formula Heat Rate = (Fuel consumed x Fuel Heating Value)/ Power output Plant efficiency rate As the fuel input increases, for the same plant output, the heat rate increases therefore the system efficiency decreases
8 Controllable Loses Controllable losses are those that are impacted by plant operation. Operating load Steam conditions Temperatures Pressures Condenser pressure Final feedwater temperature Steam attemperation flows Auxiliary steam and power consumption Boiler exit gas temperature and excess oxygen
9 Impact on Heat Rate 10,000 Btu/kWh plant Parameter Change Heat Rate Change, % Main Steam Temperature -10 F 0.17 Hot Reheat Temperature -10 F 0.16 Main Steam Pressure -1% 0.06 Condenser Pressure +0.5 in Hg 0.6 Feedwater Temperature -10 F 0.27 Superheater Spray Flow +1% of steam flow Reheat Spray Flow +2% of steam flow 0.4 Auxiliary Steam Flow + 0.5% of Cold Reheat 0.35 Excess O 2-1% 0.2 Auxiliary Power 1 MW 0.2 APH Exit Temperature + 10 F 0.25
10
11 Typical boiler efficiency is 85 90% Typical losses (coal) : Dry gas 4.5 Hydrogen and Water in fuel 5.7 Unburned combustibles 0.1 Moisture in air 0.1 Radiation 0.15 Unaccounted 1.5 TOTAL 12.05% 1% in boiler efficiency loss is approximately 1 % increase in heat rate
12 Regulatory operating constrains Dry gas loss Quantity and temperature of flue gas Excess air Maintain proper exit gas temperature Hydrogen and water in fuel High hydrogen fuels High moisture fuels Unburned carbon Boiler degradation Surface fouling Air preheater leakage Pulverizer performance Off design fuel Heating value Moisture content Hydrogen content Slagging/fouling characteristics Sulfur content
13 Typical power plant turbine efficiencies: High pressure: 78-84% Inter. pressure: 87-92% Low pressure: 86-91% Turbine cycle heat rate: Similar calculation to the net heat plant rate Turbine heat rate = energy input/power output Net plant heat rate = turbine rate/boiler efficiency
14 Turbine degradation Deposition Erosion Mechanical damage Internal leakage Variable pressure operation Sliding pressure for low load Partial arc admission

15 Converts steam to water so it can be pumped back to the boiler Reduces pressure at the turbine outlet to below atmosphere increasing available energy to the turbine About 60% of the energy from the steam generated is transferred to the condenser so it is lost. Largest single loss of the energy to generate electricity Important that condenser operates in sync with turbine due to its impact on heat rate
16 Any of the areas below causes the heat rejection to be less efficient causing an increase in condenser pressure: Cooling water inlet temperature Heat load Circulating water flow Tube fouling Air in-leakage Condenser degradation
17 Feedwater heaters Feedwater heaters out of service Tube leaks Cooling tower Water distribution Fill Air flow

18 Maintaining current equipment to the as designed condition is advisable Achieving as designed efficiency on a daily basis is difficult due to: Fuel quality variations Equipment malfunction(s) Weather conditions Equipment maintenance Load dispatch impacts heat rate Ramp rate Peaking vs baseloaded Fuel costs being the major operating cost force operators to operate at optimum heat rate Achieving the proposed 6% heat rate improvement would require major equipment modifications