China PV Market Trends in China
|
|
|
- Vanessa May King
- 5 years ago
- Views:
Transcription


1 China PV Market Trends in China Lv Fang China Renewable Energy Society Electrical Engineering Institute of Chinese Academy of Sciences Sep, 2013, Paris 1

2 Content 1. China RE Utilization 2. Current PV industry & Market 3. New PV FIT Policies, Business Model & Market Trend RE & PV Scenarios 2
3 3 China Renewable Energy Utilization China Renewables Utilization(Data resource:china National RE Center, Jul,2013 ) All renewables 10^8 tce Non-fossil energy 10^8 tce ratio-renewables to primary energy ratio-non-fossil to primary energy 7.0% 6.7% 7.0% 8.0% 7.9% 8.9% 8.5% 10.3% 7.8% 7.5% 7.7% 8.8% 8.7% 9.5% 9.3% 11.3% China Renewables Utilization All renewables 10^8 tce ratio-renewables to primary energy 11,3% 7,8% 7,5% 7,7% 8,8% 8,7% 9,5% 9,3% 10,3% 7,0% 6,7% 7,0% 8,0% 7,9% 8,9% 8,5% 1,67 1,76 1,97 2,35 2,46 2,93 3,00 3,
4 China Renewable installed Capacity (10^7 Watt)and power generation China Renewable installed Capacity (10^7 Watt) RE Hydropower Wind on-grid Biomass Solar on-grid Geothermal & Ocean Total ratio of renewables to total installed capacity 23% 22% 22% 24% 25% 26% 27.5% 28.2% ratio of renewables power generation to total power 16.1% 14.9% 14.9% 17.1% 16.8% 18.0% 16.3% 20.1% 4
5 光伏电池产量 (MW) 总产量 (MW) China PV Cell Production Statistics( ) 中国光伏电池分类历年产量统计 薄膜电池 (MW) 晶硅电池 (MW) 合计 (MW) (E) 公历年 Year (E) Silicon Solar Cells (MW) Thin-film Solar Cell(MW) Total(MW)
6 组件价格 ( 元 /Wp) Review of the History Module Price Fell in China 中国光伏组件价格下降历史回顾 中国光伏组件价格下降回顾 公历年 Unit:Yuan(RMB)/Wp Year Module Price 组件价格 Descend Range 下降幅度
7 售价 ( 元 /Wp) Review of China PV Development 中国光伏近 7 年发展历史回顾 组件价格 系统价格 公历年 Year Cumul. Inst. 累计装机 (GWp) Module Price 组件价格 (Yuan/Wp) System Price 系统价格 (Yuan/Wp) Component life 组件寿命 (Year)

8 PV Market Development in China( ) Annual new installation Cumulative installation 8
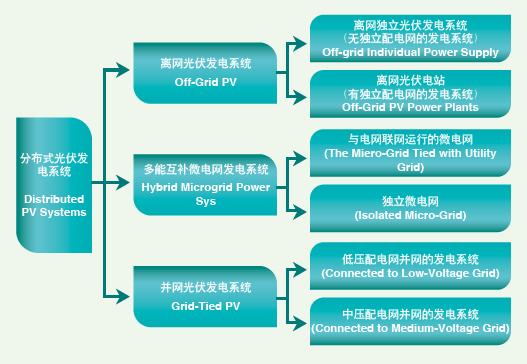
9 Distributed PV 9
10 Distributed PV Market Spring Coming Distributed PV developed rapidly, by the end of 2012, 3775 MWp distributed PV cumulative installation in 32 province (autonomous regions) total, a big jump increase of MWp over Of which, the accumulated capacity of the Golden Sun Demonstration accounted for 3044MWp, while that of PV Building Projects was 525MWp. The provinces of Jiangsu, Shangdong and Guangdong are among the top three in terms of the capacity of distributed PV, with constructed capacities of 591MWp 283MWp and 276MWp and accumulated market share of 15.65%, 7.51%, and 7.3% respectively. In 2012, distributed PV market share 37%, In the development plans target of 2015 and 2020, the market share of distributed PV will both account for over 50%. 10
11 PV Related Main Policies in China 中国光伏发电主要政策 Law 法律 Cost- sharing/fund 费用分摊 / 基金 Full purchase 全额保障性收购 Economic stimulation policies 经济激励政策 Investment subsidies 投资补贴 FIT 固定电价 Plan 规划 Mid and Long-term plan 中长期规划 12th Five-Year Plan 十二五规划 New mechanism 新机制 Quota 配额 Carbon Tax 碳税 11
12 New PV FIT in Aug, 2013 (utility scale ) Resource 资源分区 FIT 标杆电价 Typical Regions 典型地区 yuan/kwh Ⅰ 0.90 Qinghai (Haixi, Xinjiang, Ningxia, Inner Mongolia Ⅱ 0.95 Beijing, Tianjin, Heilongjiang, Jilin, Liaoning Ⅲ 1.00 Other regions besides the above Ⅰ Ⅱ Ⅲ 类地区外的其他地区 Set 3 class of regional FITs according with accordance of 3 different resources conditions and construction costs The higher part to local coal-fired benchmark price will be subsidized by RE fund RE fund based on the tariff surcharge with new level on 1.5 cent/ kwh from 0.8 cent/kwh to solved the big gap about ten thousands million each year. 20 Yeas PPA and Low down FIT and subsidy standards reasonably according to costs 12


13 Encourage self-consumption All Distributed PV kwh produced will have a fixable additional subsidy with 0.42 yuan/kwh 13


14 Scenario set-up Three RE scenarios to 2050 Reference RE Max RE Optimised
15 Scenario set-up Definition and objectives Objective Reference RE Max RE Optimized To give a reference for evaluation of the RE scenarios To show the maximum potential use of RE resources in the Chinese energy system To illustrate an ambitious but achievable RE development Definition Existing policies are maintained and the trend is continued High utilization of renewable energy in the power sector, more electricity consumption in transportation and industry sector. Different policy measures analyzed High share of RE in the energy sector, taking cost into consideration and using a mix of policy measures Output Reference RE Max RE Optimized 15
16 TWh 100 Mtce Primary energy and power mix in 2050 Primary energy Renewable: 52% Non-fossil:62% Power Renewable:82% Non-fossil:97% Reference: Primary Energy Ideal: Primary Energy Reference: Electricity Ideal: Electricity Solar Biomass Wind Hydro Nuclear Gas Oil Coal Solar Biomass Wind Hydro Nuclear Gas Oil Coal 16
17 Solar resources: rooftop potential (MW) and utility scale potential (MW) Roof-top potential (MW) The Solar PV resources are divided into rooftop potentials and utility scale potential. The total resource potential is estimated to over 2200 GW, The rooftop potential is mainly in the South, Centre and East regions while the utility scale potential is mainly in the North, North West and West regions. Utility scale potential (MW)
18 光伏累计装机 PV 2050 Roadmap Target 光电装机基本目标 ( 亿 kw) 光电装机高目标 ( 亿 kw) 公历年 Year Reference scenarios(gw) Ideal scenarios(gw)

19 Thank you and Further discussion 19