MEMORANDUM. January 30, 2014
|
|
|
- Joshua Crawford
- 5 years ago
- Views:
Transcription

1 MEMORANDUM January 30, 2014 TO: FROM: SUBJECT: CMAQ Working Group RTC of Southern Nevada (RTC) FFY CMAQ Program CMAQ Program Information Please reference the most recent Interim Program Guidance issued on November 12, 2013 ( dex.cfm) for general questions into program purpose, relationship to air quality regulations, project eligibility, and federal prioritization and reporting requirements mandated of the RTC. Generally, each CMAQ project must meet three basic criteria: Must be a transportation project; Must generate an emissions reduction; and Must be located in or directly benefit an air quality nonattainment or maintenance area. A map of Southern Nevada s air quality areas is included in Attachment #1. Application Process All Federal aid projects, including CMAQ funded projects, must be included in RTC s current transportation plan and Transportation Improvement Program (TIP). All applicants must submit a standard TIP project form with accompanying emissions reduction estimates (in MS Excel or MS Word format) to be considered for CMAQ funding. Project sponsors must perform and submit their own project-level emissions reduction analysis. Guidance on conducting emissions reductions for various project types can be found in Attachment #2. CMAQ projects are eligible for a 95% federal participation rate in Nevada. 1

2 Project Selection Process To ensure that the most efficient projects are programmed for early implementation in the TIP, the RTC s CMAQ Project Selection Process (Process), has been developed in accordance with federally mandated metropolitan planning processes under 23 U.S.C The Process involves NDOT, local transportation agencies, the Clark County Department of Air Quality, and both the Las Vegas and Moapa Band of Paiutes. Public participation is continuing and cooperative throughout project selection. The Process provides an opportunity for stakeholders to present a case for the selection of eligible projects that will best use CMAQ funding to meet the requirements and advance the goals of the Clean Air Act (CAA). 2
3 Throughout the Process, projects will be evaluated based on their cost-effectiveness. Priority consideration will be given to those projects that create the greatest emissions reductions for the least amount of CMAQ funds expended. MAP-21 places special emphasis on cost-effectiveness when selecting CMAQ projects. Illustrative examples of the cost effectiveness of previously funded CMAQ projects in Southern Nevada are included as Attachment #3. This information may be used by project sponsors as a guidepost when developing projects for potential CMAQ funding. However, the actual costeffectiveness ultimately will depend on local conditions and project specific factors that affect emission reductions and costs. The Process will also ensure timely implementation of Transportation Control Measures (TCMs) in the State Implementation Plans (SIPs) developed by the Clark County Department of Air Quality by granting eligible projects funding priority. Section 176(c) of the CAA requires that the FHWA and FTA ensure timely implementation of transportation TCMs. Attachment #4 contains a current listing of applicable TCMs in Southern Nevada. 3
4 Attachment #1 Southern Nevada Air Quality Map 4
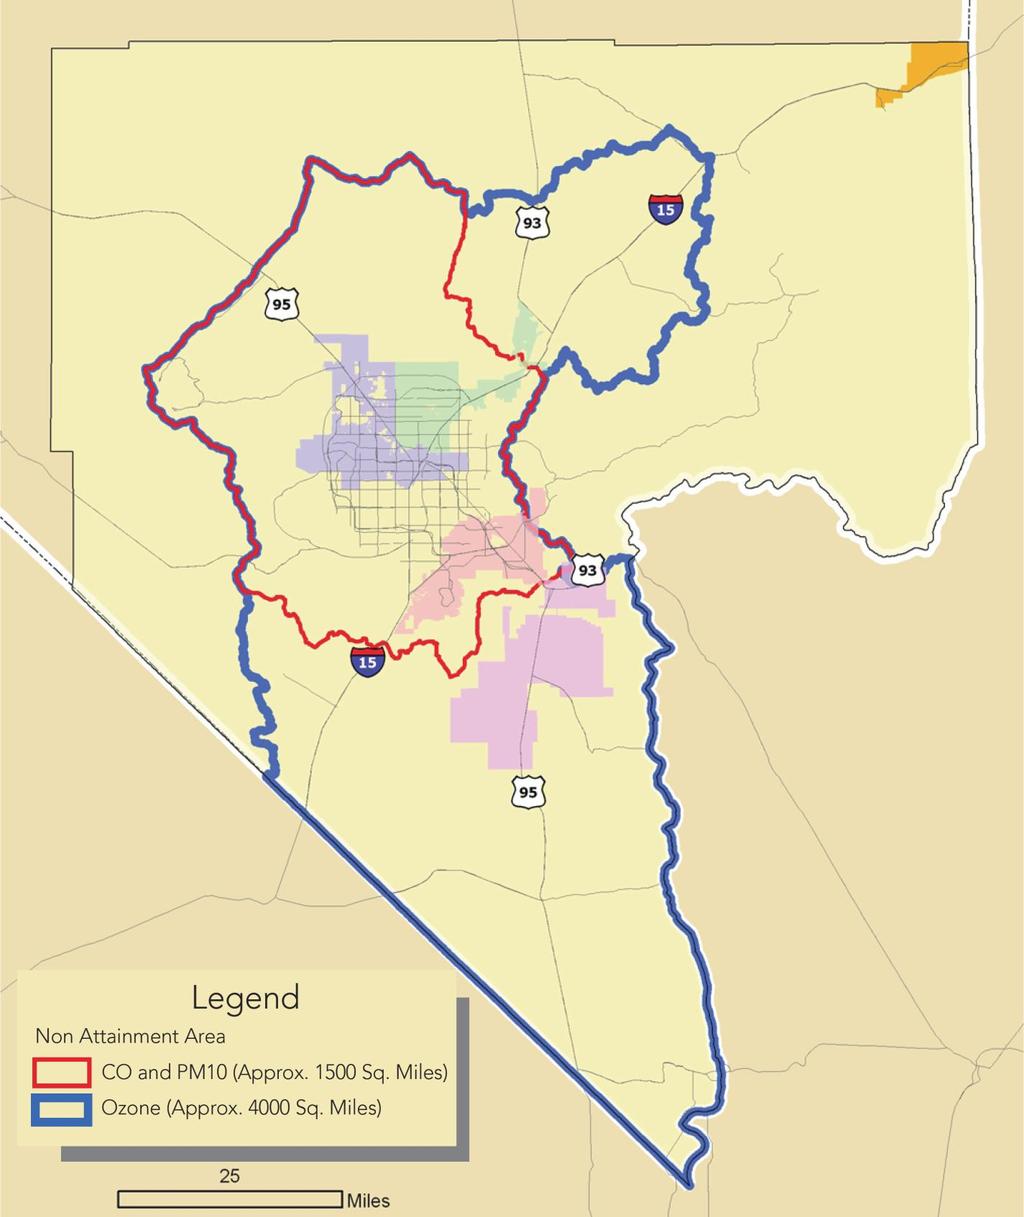
5 5
6 Attachment #2 Methodology for Calculating Emission Reductions with Emission Factor Matrix 6
7 This section clusters projects into typologies and outlines the process to calculate emission reductions. Project sponsors may use and/or develop other methods for calculating emissions benefits if supporting documentation is provided to the RTC. Emission Reduction Calculation Guidelines 1) The estimated emission benefits are undertaken to determine a cost per KG/day of pollutant removed. 2) Use averages where actual approach volume numbers are not readily available. As an example, intersections can be divided into (1) a.m. peak 6:00-9:00, (2) p.m. peak 3:00-6:00, midday peak 11:00-1:00, (4) daytime off-peaks, and (5) all other non peak periods (summing 24 one hour time periods). For simplicity, you can calculate the idle emissions for a time slice, then multiply times the number of hours per period and sum for a 24-hour period. While weekends approach demand may differ, if everyone agrees to multiply the average by 7 days in a week, then the approach is the same and we can avoid having to conduct a weekend analysis. 3) Please include some form of working calculations as backup. Since most of the work will be performed using the 2010 Highway Capacity Manual (HCM) Volume III: Chapter 18, Signalized Intersections, inclusion of an average days emission reduction will suffice. Simply show the calculations or HCM output for the week, month and year for each pollutant being eliminated and provide a total for all pollutant reductions for the specific project. CMAQ Project Category Types 1) Intersection Modification Projects Various Geometric Improvements a. Intent: To reduce vehicle idling time by improving one or more aspects of the operation of the intersection, thereby eliminating related tailpipe emissions by reducing average delay time. b. Emissions Reduction Analysis Tool HCM Methodology Recommended Approach: Use HCM to define total average delay (by approach information) for the intersection under existing conditions. Redefine the intersections with the proposed design modification. Rerun the HCM to determine average idle time reduction per vehicle, apply the pollutant s gram per hour emission factor and multiply by the total approach volume by hour associated with the project modification to get an hourly total of emission reductions. Extrapolate as necessary for the time periods that make up a 24-hour cycle. Calculate the estimated cost per KG/day reduction for all pollutants removed by the project. 7
8 2) Roadway Operational Improvements Installation of Bus Turnouts a. Intent: To reduce the impediment of free flow of traffic by removing a loading transit vehicle from the curbside travel lane. b. Emission Reduction Analysis Tool Calculation of delay (idle) reductions based on transit headways, average coach dwell time, and average automobile travel demand on the facility. CMAQ guidance indicates that these types of project analyses can be clustered (by roadway name); however, a specific calculation will have to be conducted for each proposed bus turnout installation, before they can be grouped by roadway to be expressed as cost per KG/day of total emission reduction. Recommended Approach: Per proposed bus turnout based on the approach volume data, assume an equal distribution of demand by lane for averaging. Use the RTC supplied headway and time of day operation information to determine the number of times per hour the proposed turnout may benefit a reduction in idling automobiles. Apply the RTC s average loading/dwell time for the system by coach, estimate the number of vehicles queued behind the bus (from the land approach average), along with the delay linked to the bus s total dwell time. Multiply the number of vehicles times the length of delay to establish idle emissions in grams per hour by pollutant. 3) Traffic Signal Coordination and Communication Improvements ITS Communication Infrastructure, Signal Interconnects, and Upgrades to Roadway ITS and Signal Timing a. Intent: Generally to improve the flow of traffic by eliminating unnecessary delays associated with outdated communication hardware/software and poorly designed signal progression. b. Emissions Reduction Analysis Tool Brian Hoeft may assist in refining the methodology. 4) Non-motorized facility improvements Construction of dedicated facilities for bicycle and pedestrian travel. a. Intent Bicycle and pedestrian improvements can positively impact air quality by providing an alternative mode of transport to the automobile. b. Emission Reduction Analysis Tool The emissions benefits result from a transport mode shift; from automobiles to bicycle or pedestrian trips. This mode shift results in less automobile usage and lower emissions of criteria pollutants. Quantifying the level of emissions reductions requires a two step process; 1) quantifying the level of automobile VMT reduction, and 2) assigning emission factors to the VMT reduced to determine air quality benefits. 8
9 Recommended Approach: The number of vehicle trips replaced by bicycle and/or pedestrian trips will be estimated based on the level of street traffic (AADT), or the nearest parallel arterial for a bicycle/pedestrian path. The vehicle trips reduced will be estimated using the adjustment factors from Table 1 below. The adjustment factors are dependent upon the length of the bicycle/pedestrian project and the roadway AADT (or nearby parallel street). Estimates of the VMT reduced are based on the average number of vehicle trips reduced, multiplied by average non-motorized trip lengths. The usefulness of a bicycle/pedestrian facility is also dependent upon its location in Southern Nevada. Usage estimates for bicycle/pedestrian facilities will take into consideration the number of activity centers near the proposed bicycle/pedestrian facility. Table 1: Adjustment Factors Table 2: Activity Center Credits Formulas: Trips Reduced (TR) = AADT * (A + C) Where: A = the adjustment factor from Table 1 C = the activity center credit from Table 4 AADT = Annual average daily traffic on the street or nearest parallel arterial 9
10 VMT Reduced = TR * trip length Where: trip length = the length of a bicycle trip is assumed to be 4.0 miles and the length of a pedestrian trip is assumed to be 0.5 miles. For a multi-use path, it is assumed that the average trip length is 2.25 miles. When referencing the Emission Factors in Table 3 below, assume a speed of 30 miles per hour to estimate CO, NOx, and VOC. Emission Factor Matrix provided by the Clark County DAQ Emission factors represent the average vehicle fleet composition in Southern Nevada. Emission factors are expressed as emissions per vehicle in grams/hour (for idling) or grams/mile by travel speed. For all emission reduction analyses, calculations may include the pollutants CO, VOC, and NOx. PM10 is not a primary factor for non-transit project emission reduction analysis, since these emissions are associated with running speed re-entrainment. Projects targeting diesel emissions should include an analysis of PM10 reductions. Project sponsors should identify the total reduction for each pollutant in KG/day. Table 3: Emission Factors (Grams/Mile) Speed (MPH) CO VOC (Ozone) NOX (Ozone) Idle (grams/hour) (grams/hour) 5.07 (grams/hour) Ramp CO VOC (Ozone) NOX (Ozone)
11 Attachment #3 RTC CMAQ Program Historical Cost Effectiveness 11

12 RTC CMAQ Program Project Types RTC CMAQ Program Cost Efficiency by Project Type 12
13 Attachment #4 Transportation Control Measures in Southern Nevada 13
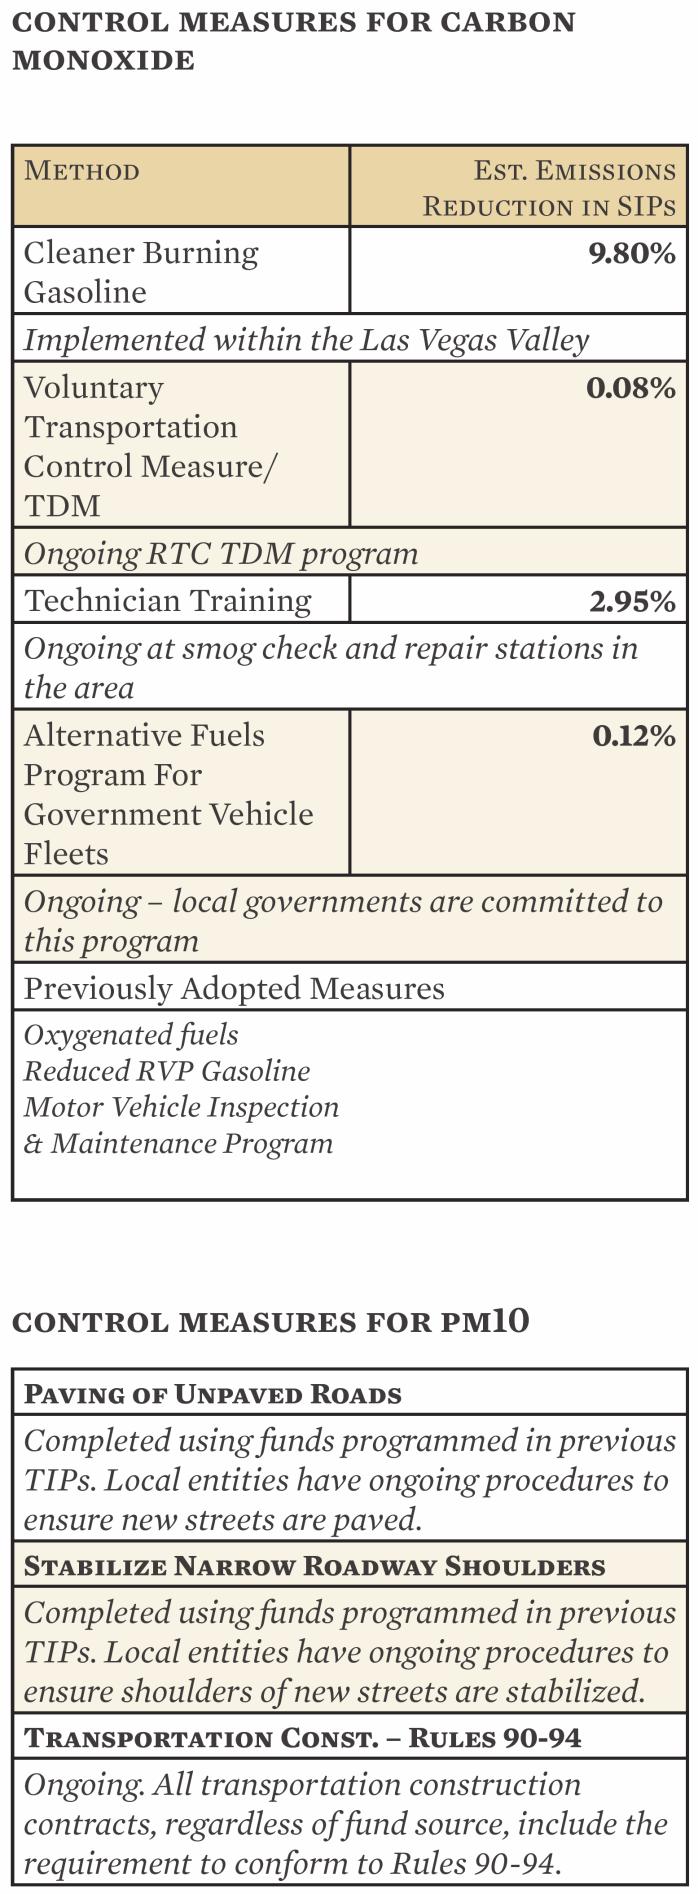
14 14