Community Development Department
|
|
|
- Sydney Barton
- 5 years ago
- Views:
Transcription
1 City of Safety Harbor Community Development Department TO: CHAIRMAN AND MEMBERS, PLANNING AND ZONING BOARD FROM: MATT McLACHLAN, AICP, COMMUNITY DEVELOPMENT DIRECTOR DATE: MARCH 3, 2011 RE: ANNUAL UPDATE TO CAPITAL IMPROVEMENTS ELEMENT Staff is recommending approval of City initiated amendments to the Capital Improvements Element as summarized in this memo and detailed in Attachments "A" of Ordinance No CAPITAL IMPROVEMENTS ELEMENT The schedule of projects of the Capital Improvements Element of the City of Safety Harbor Comprehensive Plan is required to be updated annually. The Planning and Zoning Board is required to make a recommendation to the City Commission on all proposed changes to the Comprehensive Plan. State law requires that the Schedule of Capital Projects be financially feasible per Florida Statute (s (32)): "(S (32), F.S.) Financial feasibility means that sufficient revenues are currently available or will be available from committed funding sources for the first 3 years, or will be available from committed or planned funding sources for years 4 and 5, of a 5 year capital improvement schedule for financing capital improvements, such as ad valorem taxes, bonds, state and federal funds, tax revenues, impact fees, and developer contributions, which are adequate to fund the projected costs of the capital improvements identified in the comprehensive plan necessary to ensure that adopted level of service standards are achieved and maintained within the period covered by the 5 year schedule of capital improvements. The requirement that level of service standards be achieved and maintained shall not apply if the proportionate share process set forth in s (12) and (16) is used. REQUIREMENTS OF THE CIE SCHEDULE OF PROJECTS PLAN AMENDMENT: The Florida Department of Community Affairs (DCA) requires the following support documentation for the annual CIE schedule of projects plan amendment: 1. Provide an analysis identifying existing level of service deficiencies and projected deficiencies for the five year planning timeframe. 2. Identify the capital improvements needed to reduce existing deficiencies and to expand or replace existing facilities to ensure that the adopted level of service standards are achieved and maintained over the five year planning period and include those improvements in the Five Year Schedule of Capital Improvements. 1
2 3. Demonstrate how the revenue amount projected to fund the project over the five year timeframe will be generated by the revenue source. 4. Demonstrate that funding is committed for the first three years, or will be available from committed or planned funding sources for years four and five to fund the projected costs of the capital improvements. 5. Identify alternate committed revenues that will replace planned revenue sources used in the last two years of the schedule that require referenda or other actions to secure, in the event the planned revenue sources are not approved. 6. Demonstrate coordination between the Five Year Schedule of Capital Improvements and the Metropolitan Planning Organization s 2025 Long Range Transportation Plan and update the Capital Improvements Schedule to include the transportation projects in the Pinellas County Metropolitan Planning Organization s Transportation Improvement Program that will be relied upon for concurrency and demonstration of financial feasibility. The City's Level of Service Review in support of Ordinance No is attached to this memo. 2
3 LEVEL OF SERVICE REVIEW The City is currently operating at an acceptable level of service for all LOS related facilities. The 5 Year Capital Improvements Element is based on the 2015 population projection of 20,775 residents. Sanitary Sewer: The City of Safety Harbor owns and maintains those sanitary sewer lines located within its municipal boundaries. The age of the sewer lines varies from more than 30 years in the downtown area and less than 30 years in the central and northern sections of the City. The existing sewer lines are in good condition. The City has an ongoing replacement program for sewer lines which is funded by a water and sewer fund made up of ten percent of the revenue from water and sewer billings. Local option sales tax (Penny for Pinellas) can also be used. The City has a sewer master plan that identifies needed longrange improvements. Sewage treatment takes place at the City of Clearwater Northeast Wastewater Treatment Plant. The City of Safety Harbor has executed an agreement with the City of Clearwater for the joint ownership and utilization of this facility. The plant has a design capacity of 13.5 mgd, and is designed to provide for Advance Waste Improvement to the treatment and disposal process. The City is allocated 4.0 mgd of treatment capacity. The City's level of service standard for sanitary sewer service is set at 119 GPCD. According to data provided by the City's Public Works Department, the annual sewer flow totaled 527,532,800 gallons which represents a 2.6% decline over the previous year and a 6.1% drop compared to the 2008 total usage. On average, the City utilized 36.1% of the available 4.0 mgd of treatment capacity at the Northeast Wastewater Treatment Plan. Based on the City's 2009 population estimate prepared by the University of Florida, Bureau of Economic and Business Research (BEBR) of 17,708 residents, the City generated gallons per capita per day which is 31% below the City's adopted level of service threshold. 3
4 Potable Water: The City of Safety Harbor is included within the Pinellas County Water Demand Planning Area as a wholesale customer of Pinellas County Utilities. Safety Harbor is responsible for the distribution system south of SR 580. There are two properties within the City of Safety Harbor municipal boundary, but outside the City's current planning area boundaries, that are served as retail customers by the City of Clearwater. These properties are isolated cases, and given the current agreed upon planning area for the City of Safety Harbor, no additional demand is expected upon the City of Clearwater potable water supply system. Pinellas County receives its potable water supply from Tampa Bay Water, Inc., the regional water supply utility. Tampa Bay Water is under an agreement with its member governments to supply potable water to meet all member governments water demands. Tampa Bay Water's Long Term Water Supply and Master Plan, which considers every project in the SWFWMD Regional Water Supply Plan, provides for sufficient water supply projects to meet the member governments' water needs over the 20 year planning horizon. Section , F.S., requires assurance that water suppliers coordinate their water supply planning with the Regional Water Supply Plans, where appropriate. The 10 Year Water Supply Facilities Work Plan prepared by Pinellas County Utilities reflects the long term funding commitment to the facilities required to support the potable water needs of Pinellas County Utilities' retail and wholesale customers. According to Pinellas County, Safety Harbor's projected water demand in 2020 is 2.30 mgd based on a projected population of 20,040. The City is allocated 2.50 mgd based on its water service agreement with Pinellas County. In 2010, the City used 509,552,000 gallons of potable water (1.4 mgd) or approximately 60 percent of its available water supply. The City continued to see a dramatic decline in water consumption with a 7.0% drop over the previous year and a 20% decline from the 2008 total. Based on an estimated water service area population of 15,052, the level of service was gpcd which is acceptable. 4
5 Solid Waste: The City provides solid waste collection service using six collection trucks with a combined capacity of 12,500 tons. The City's enterprise fund will cover the cost of future replacement vehicles. By ordinance, the City's solid waste is disposed of at the Pinellas County refuse to energy plant site. The operating capacity of the solid waste disposal system is 997,287 tons per year. In 2010, the City used 1.5% of the overall capacity by contributing 14,827 tons of solid waste. According to the County's most recent concurrency test statement (Ordinance #09 64), the County is able to dispose of the solid waste for which it is responsible (current generation rate is 0.91 tons/person/year). Based on a current population of 17,708, the City generated 0.70 tons of solid waste per person in 2010 which is well below the County's level of service standard of 1.30 tons/person/year. On a national level, the United States Department of Environmental Protection estimated that Americans produced about 4.3 pounds of waste per person per day in The City, by comparison, produced 3.9 pounds per person per day which is 0.44 pounds or 9% lower than the national average. In 2010, the City's recycling program generated 947 tons of recyclable material of which 74% was collected curbside. This represents 7% of the overall waste total. The City should set a recycling target of 10% of waste material in future years as part of its "going green" campaign
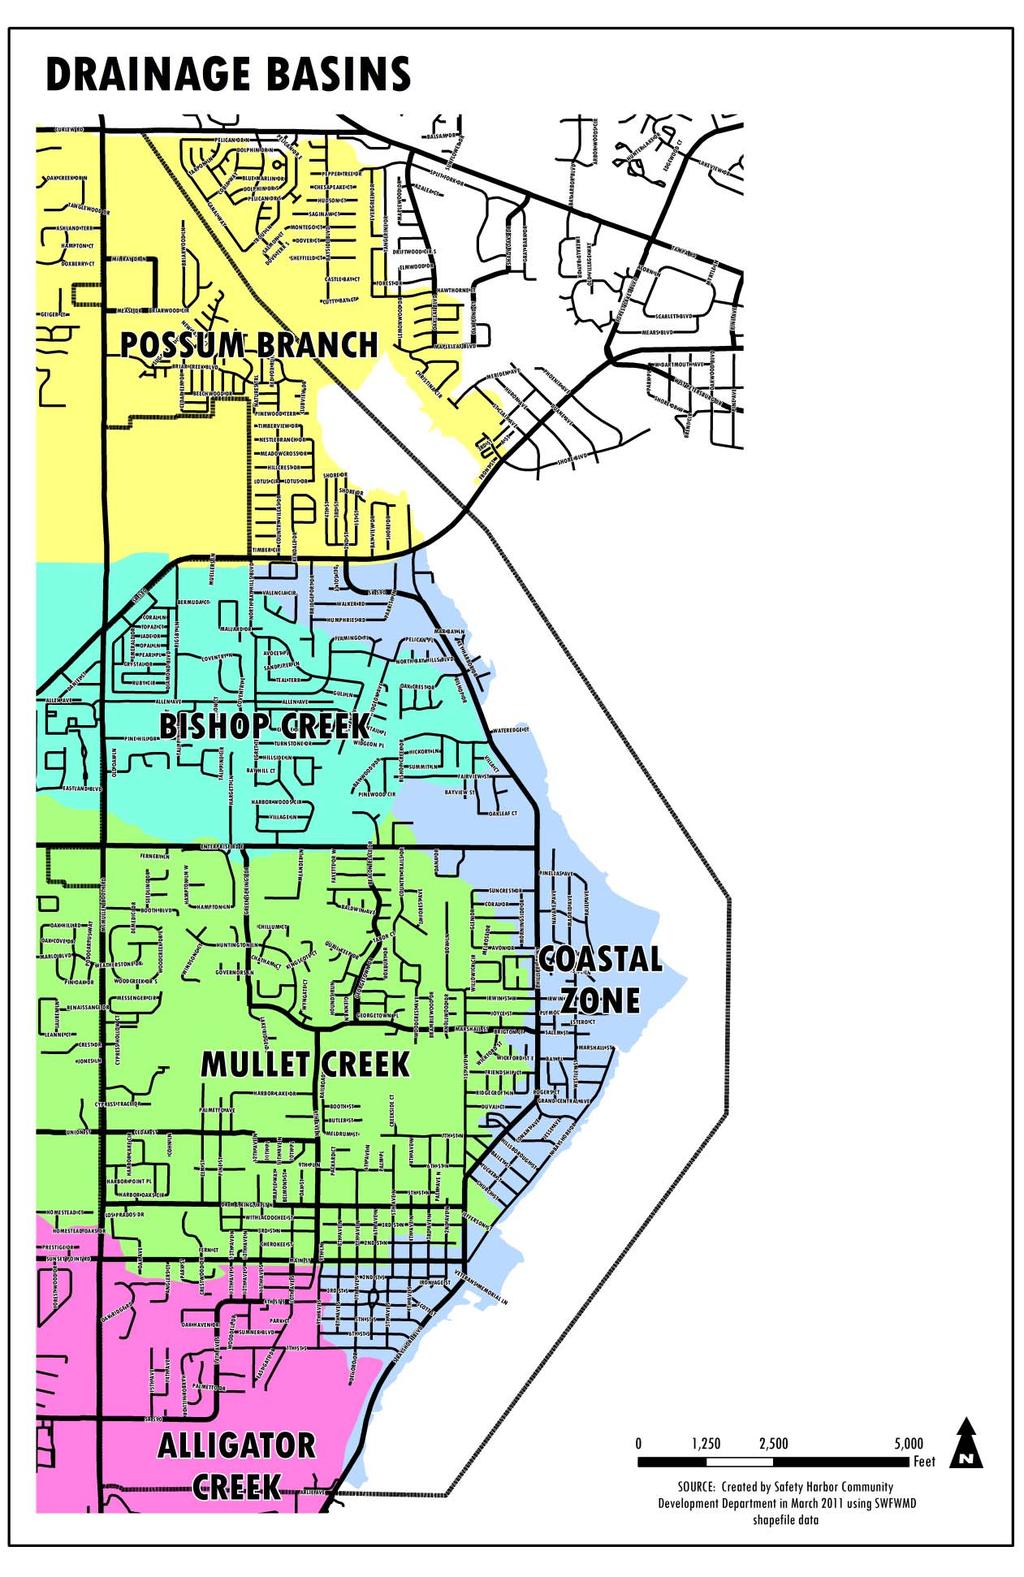
6 Drainage: The City of Safety Harbor has two major drainage corridors that discharge into Old Tampa Bay: Bishop Creek and Mullet Creek. The City has recently completed erosion control/water quality projects along two sections of Bishop Creek. There are four major drainage projects scheduled in the City's Capital Improvements Element to address new water quality limits for stormwater entering Old Tampa Bay: Upper Mullet Creek, Lower Mullet Creek, North Bayshore Drive and South Bayshore Boulevard. The first two projects are designed to improve water quality and erosion control in the Mullet Creek drainage basin.. In the 09/10 fiscal year, the City completed slope stabilization along the upper portion of Mullet Creek. In 12/13 fiscal year, the detention area located northeast of the 5th Street N and Palm Avenue intersection will be converted to an on line bio retention pond that will treat the runoff entering into it from the entire 1,358 acre Mullet Creek drainage basin (it is currently treating the 97 acre basin along Martin Luther King, Jr. St. N). The project also includes erosion protection from 9th Avenue North to 5th Avenue North which will help reduce sediment and other pollution from entering Old Tampa Bay. It is estimated that these projects will remove 28,000 pounds of polluting material each year. The South Bayshore Boulevard (FY 10/11) and North Bayshore Drive (FY 11/12) projects within the Coastal Zone will feature a 5,300 linear foot shallow swale to intercept and treat water flow into Old Tampa Bay by incorporating nutrient uptake, ground percolation and swale sedimentation. The swale will be created by an embanked berm/dam. Catch basins equipped with debris trapping bmps will be reconstructed along both roadways. The regrading of shoulders and right of way will improve drainage flow. It is estimated that these projects will remove a combined 20,200 pounds of polluting material from the stormwater runoff on an annual basis. In addition to the above projects, the City has allocated $125,000 annually for miscellaneous minor stormwater improvements. Projects usually involve installing short runs of pipes, insertions of catch basins or the regrading of slopes. The City has adopted SWFWMD requirements for its level of service for stormwater drainage. Development projects that obtain a SWFWMD exemption must provide the City's Engineering Department with an acceptable drainage scheme with the building plans. 6
7 7
8 Transportation: The Pinellas County Metropolitan Planning Organization (MPO) prepares a Level of Service Report for thoroughfare roads throughout Pinellas County on an annual basis. Only the peak hour condition is analyzed by the MPO. Conditions are estimated during the 100th highest hour of traffic using the K 100 factor provided by the Florida Department of Transportation (FDOT) generalized service volumes tables by incorporating actual operating conditions into the roadway analysis. In some cases, the roadway links (segments) are aggregated with adjacent segments to establish a level of service which is more representative of the actual operating conditions of the roadway. A volume to capacity (V/C) ratio is also provided as an indication of the extent of congestion on the roadways. A V/C ratio of over 1.00 can be used as an indication of congestion with the understanding that there are other factors (i.e., signal timing, travel speeds, adjacent land uses) which can affect level of service for a particular roadway. The matrix below shows the 2010 level of service for collector and arterial roadways in Safety Harbor. All facility segments except for McMullen Booth Road and S.R. 580 (Philippe Parkway to Forest Lakes Boulevard) are operating at LOS "D" or better thereby meeting the City's minimum concurrency requirement. McMullen Booth Road has been identified by Pinellas County as a constrained corridor because of its limited right of way. The floor area ratio of adjacent development is generally limited to 50% of the allowable intensity MPO LEVEL OF SERVICE REPORT ADOPTED 9/8/2010 FACILITY JURIS FAC TYPE ROAD TYPE LOS STD LENGTH (mi) AADT VOLUM E PHYSICAL CAPACITY V:CAP RATIO FAC LOS Bayshore Blvd. (Main St. to SR 60) SH/CL NMC 2U D , , C Enterprise Rd. (McMullen Booth Rd. to Philippe Pkwy.) CR SMC 2U D , D Philippe Pkwy. (Enterprise Rd. to Main St.) SH SA 2U D , C Philippe Pkwy. (SR 580 to Enterprise Rd.) SR SA 2U D , C Main Street (Bayshore Drive to McMullen Booth Rd) SH SA 2U D , C McMullen Booth Rd. (Gulf-to-Bay Blvd. to Main St.) CR SA 6D D , , F McMullen Booth Rd. (Main St. to SR 580) CR SA 6D D , , F McMullen Booth Rd. (SR 580 to Curlew Rd) CR SA 6D D , , F SR 580 (McMullen Booth Rd. to Philippe Parkway) SR SA 6D D , , B SR 580 (Philippe Parkway to Forest Lakes Blvd) SR SA 4D D , , F SR 590 (Main Street to McMullen Booth Road) SR NMC 2U D , , B Jurisdiction: SR = State Roadway; CR = County Roadway; SH = Safety Harbor; CL = Clearwater Facility Type: SA = Signalized Arterial; SMC = Signalized Major Collector; NMC = Non-Signalized Major Collector 8
9 9
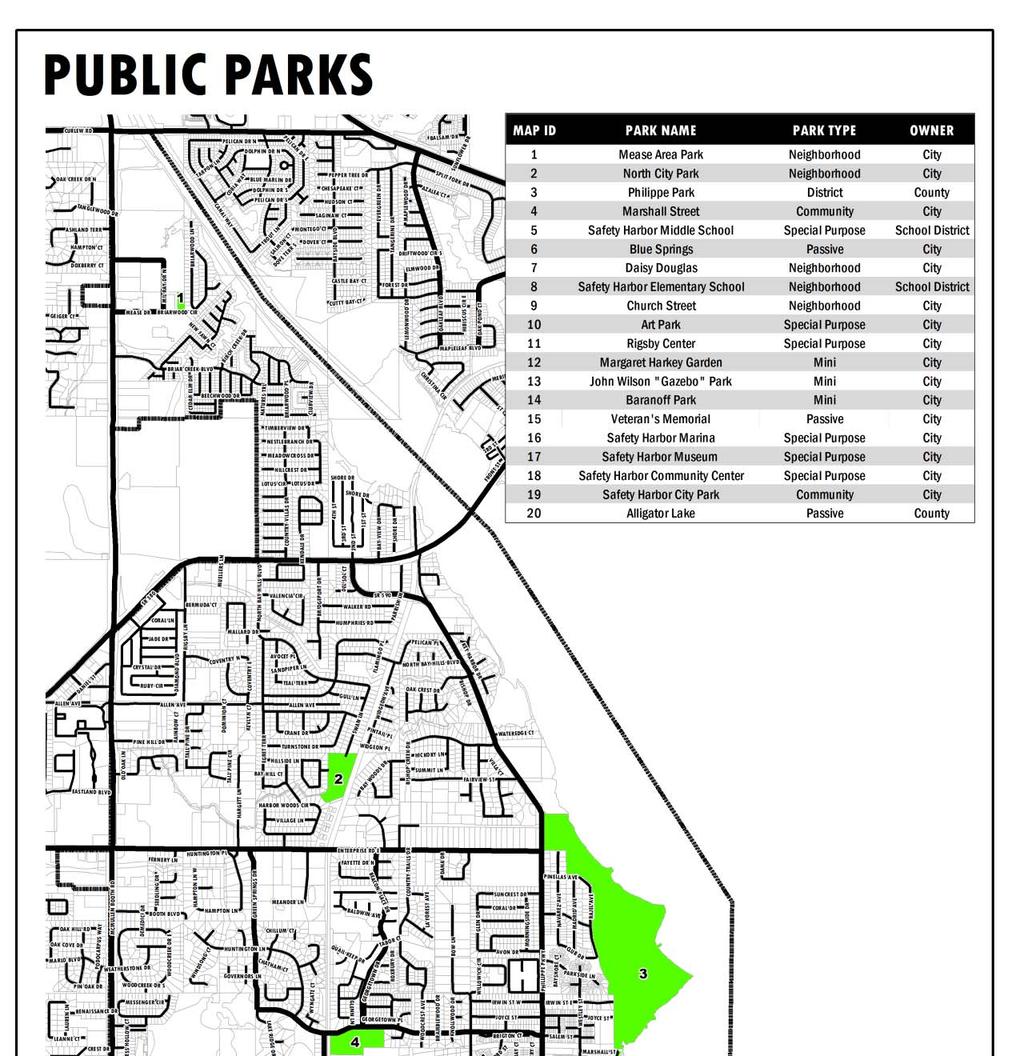
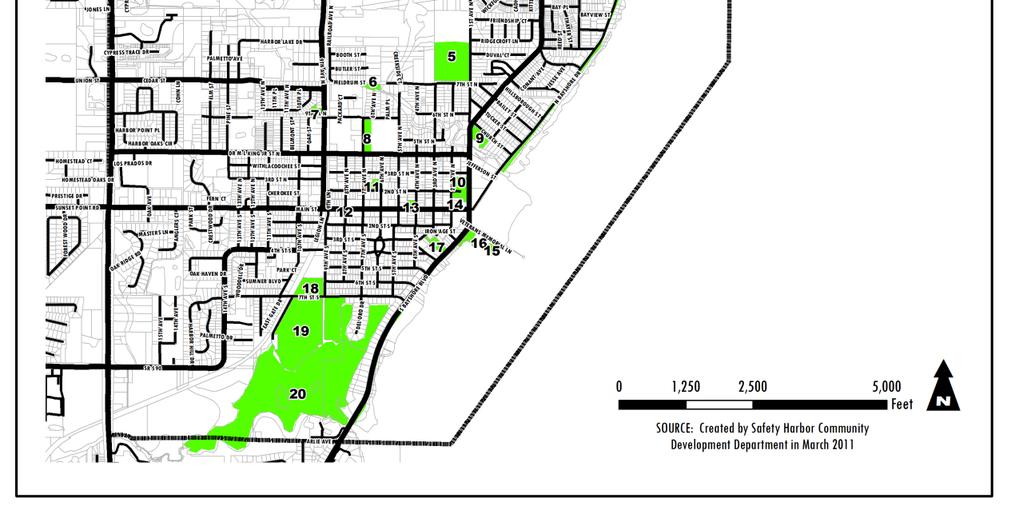
10 Recreation and Open Space: The current and projected level of service for park and recreation facilities is shown in the tables on the following page. The analysis is based on a parks and recreation inventory performed in October 2008 and current and projected population data. The vast majority of City owned parks are located south of Enterprise Road. The park system was generally developed concurrent with the residential growth that took place during the 1970 s and 1980 s. Based on this analysis, the City of Safety Harbor is currently meeting the population based thresholds for all park types except for mini parks and neighborhood parks. The Comprehensive Plan notes that the need for these facilities is mitigated by the surplus of community parks, special purpose facilities, and the amount of acreage (122) provided by the Pinellas County District Park, Philippe Park (Table 4, Analysis of Current Recreational Needs by Park Type, City of Safety Harbor). In terms of recreation facilities, the City meets or exceeds the adopted level of service standard for all facility types. In terms of future facility needs, there may be a need for one additional boat ramp. A swimming pool to serve the current and projected population is likely cost prohibitive and will remain a deficiency. LEVEL OF SERVICE ANALYSIS PARKS PARK NEEDS (2008) POPULATION PARKS SURPLUS / PARK NEEDS PARK TYPE SERVED PROVIDED DEFICIENCY (2015) MINI 2, SURPLUS / DEFICIENCY NEIGHBORHOOD 5, COMMUNITY 10, DISTRICT 50, OPEN SPACE 1, LEVEL OF SERVICE ANALYSIS RECREATION FACILITIES NEEDS ANALYSIS Existing Surplus/ Surplus/ FACILITY TYPE LOS STANDARD Facilities 2008 Deficiency 2015 Deficiency Tennis Courts 1 court per 7,500 population Basketball Courts 1 court per 5,000 population Baseball Field 1 field per 4,000 population Boat Ramps 1 lane per 5,000 population Football/Soccer Fields 1 field per 15,000 population Swimming Pools 1 pool per 25,000 population Bicycle Trails 1 mile per 10,000 population Hiking/Nature Trails 1 mile per 10,000 population Picnic Areas 1 acre per 6,000 population Handball/Raquetball 1 court per 10,000 population
11 11