Improve Green Building via Clean Energy. Aiming Zhou Senior Energy Specialist 7 June Asian Development Bank
|
|
|
- Christina Palmer
- 5 years ago
- Views:
Transcription

1 Improve Green Building via Clean Energy Aiming Zhou Senior Energy Specialist 7 June Asian Development Bank
2 Why

3 Energy Efficiency Matters


4 Building Lifecycle Costs Building life cycle costs = capital investment + operation costs Energy management minimizes ongoing costs, which is 75% of the life cycle cost of the building.


5 Cheapest Low-Carbon Solution: Energy Efficiency


6 A Huge Opportunity Industry Transport Power Buildings Two-thirds of the global economic potential of energy efficiency remains untapped to 2035, mostly due to non technical barriers Economically viable efficiency measures can halve world energy Energy efficiency: a huge opportunity going unrealised demand growth to 2035 and delay lock-in of CO 2 emissions permitted under a 2 C warming trajectory by five years EE creates net economic gains estimated at $18 trillion to 2035, after additional investments of $11.8 trillion, concentrated in Asia. Energy efficiency potential used by sector in the New Policies Scenario 100% 80% 60% Unrealised energy efficiency potential Realised energy efficiency potential 40% 20%

7 How
8
9 Net Zero Energy Where Are We Today? Net-Zero Source: R. Anderson, NREL
10 Energy Audit For Buildings Walk-Through Audit Utility Cost Analysis Standard Energy Audit Detailed Energy Audit
11 Payback Green Building Measure %Savin Cost period g increase (yr) Action Window to wall ratio 8.0% Negative 0 Include Solar Shading Devices 17.3% 7.2% 25.0 Consider Reflectivity - Wall 0.5% 0.0% 4.8 Include Thermal Conductance (Wall U-Value) 0.3% 0.5% 98.6 Exclude Reflectivity Roof 0.2% Negligible - Include Thermal Conductance (Roof U-value) 0.1% 0.0% 18.1 Consider Glazing Assembly Properties (U-value, SHGC, VLT) 7.3% 0.1% 0.9 Include COP of air conditioning equipment 11.4% 1% 5.4 Include Variable Speed Drives for cooling towers 9% 0% 0 Include Heat recovery on extract air 2% Cost awaiting 26.2 Consider Solar collectors for Hot water NA NA --- Exclude Photo electric control perimeter lighting 18% 2% 7.4 Include Exterior lighting controls NA NA --- Exclude Low energy lighting [CFL, T5, LEDs etc] 7% 0.12% 1.0 Include Electronic Ballast 2% Negligible 0.0 Include Sub-metering benefits 3% NA NA Consider Water efficient fittings 40% 0.35% 6.0 Include Rainwater harvesting 15% Cost awaiting 26.2 Consider Recycling onsite Sewage T plant 67% Cost awaiting 7.4 Consider Water metering NA Negligible NA Include Storm water attenuation and ground water recharge Payback Period by Selected Building EE Technology NA Minimal impact NA Include The energy saving potential of each measure has been correlated with the cost impact and therefor the simple payback.
12 Why Low Hanging Fruits Unpicked


13 Labor intensity ADB s Demand-Side Energy Efficiency Investment High Residential $43m Individual Retail $0 Offices $167m Education 0 Hospitals 0 Light Industry 0 Low opportunities are being overlooked Low Capital Intensity Process Industry $363m District Heating $449m High

14 GB Barriers and Drivers Green Building Market Report, BCI Asia 2008
15 Sample Projects


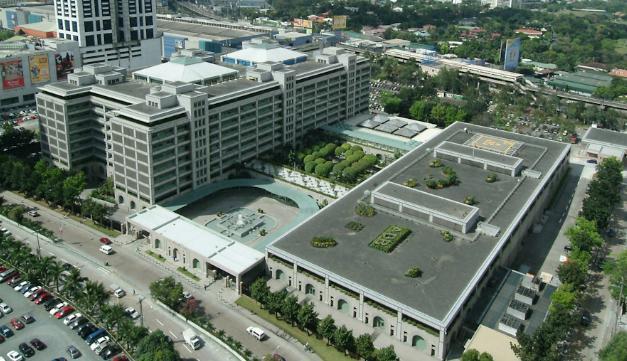
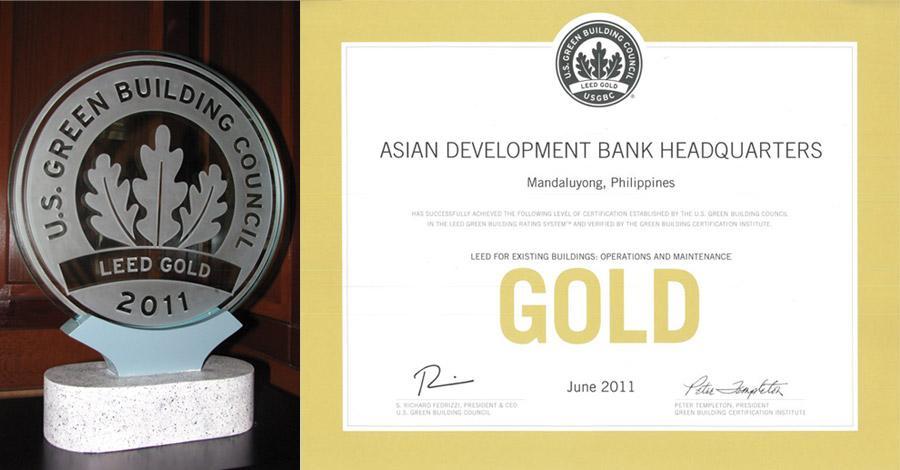
16 ADB HQ Showcases Sustainability OAS at Work 2002 ADB Environment Policy 2003 Environment, Health and Safety Policy 2004 Six Sigma Program 2007 Sustainability Report 2009 LEED Certification Process (Gold in 2011) 2011 beyond Sustainability at ADB HQ 2012 Energy Management 50001

17
18 Before


19 After Photo Credit: OAS, ADB

20
21


22 Sustainable Infrastructure Financing in ADB ADB s Sector Policies and Operational Plans Operations Departments FPFs TAs Grants Resources OCR ADF Investments (Financing + +)
23 Structure of CEFPF Clean Energy Financing Partnership Facility (CEFPF) Grant Resources Non-Grant Resources Trust Funds* Clean Energy Fund future trust funds Framework agreements with partners** Investment / financing frameworks Risk sharing arrangements Knowledge provision and exchange Other arrangements for non-grant uses (i.e. non-grant trust fund) Grant Component of Investment Technical Assistance Innovative Financing Mechanism Guarantees Risk Transfer Products (i.e. reinsurance) Loans