Accumulation and Mitigation of Metals on Plastic and Cement-Lined Pipe
|
|
|
- Kellie Chase
- 5 years ago
- Views:
Transcription

1 Accumulation and Mitigation of Metals on Plastic and Cement-Lined Pipe AWWA PNWS Annual Conference Bellevue, WA May 1, 2015 Presented By: Andrew Hill, P.E. Confluence Engineering Group, LLC
2 Presentation Overview Issue of metals accumulation and release Why the focus on cement and plastic pipe? Park City s experience WaterRF 4509 Main Cleaning Evaluation Conclusions
 Releases are not easy to control (or always identify) Ignored by current IOC monitoring & regulatory")
3 Overview of Issue Regulated trace metals can accumulate in DS Fe/Mn occurrence significantly increases accumulation risk Accumulated metals can be released Potential for elevated tap concentrations (> MCLs) Releases are not easy to control (or always identify) Ignored by current IOC monitoring & regulatory framework
 - Steel (4%) - Galvanized (<1%)")
 Approx.")
4 Pipe Classification Scheme Scale-Forming - Unlined Cast and _Ductile iron (19%) - Steel (4%) - Galvanized (<1%) Non Scale-Forming - Cement-lined (34%) - Plastic (18%) - Asbestos Cement (15%) Approx. pipe distributions per USU, 2012
5 Why the focus on plastic and cement-lined pipe? Scale-Forming Non Scale-Forming Primary Substrate Corrosion Scale Settled Precip./Biofilm Mass Inventory (lb/mile) High -12,000 lb/mi (UCI median)* Low -150 lb/mi (median)* T IC Occurrence (mg/kg = ppm) Release Potential Low -Dilution effect of scale -Potentially high at surface Relatively immobile -Adherent -Low interfacial A:V High -Strong relationship to WQ _ and Fe/Mn loading Relatively mobile -Loose or cohesive -High interfacial A:V * From WaterRF #3118
 Unlined Cast Iron Pipe Cement and Plastic Pipe Supporting data and figure from Lytle et al.")
6 Sample Percentile Role of Pipe Classification on TIC Occurrence 100% 80% PVC Pipe Specimen Arsenic = 13.6 mg/mg 60% 40% 20% 0% As:Fe in Deposits (mg/mg) Unlined Cast Iron Pipe Cement and Plastic Pipe Supporting data and figure from Lytle et al. (2004)
7 Recent Research WaterRF #4509: Metals Accumulation and Release within the Distribution System: Evaluation of Mechanisms and Mitigation Tailored Collaboration Project Park City Municipal Corporation, Utah (PCMC) Confluence Engineering Group, LLC Utah State University (USU) Final Report expected Summer 2015
8 Tailored Collaboration Team Research Team Park City: Michelle DeHaan, Kyle McArthur, Ken Mitchell Confluence: Melinda Friedman, Andrew Hill, Michael Hallett, Stephen Booth USU: Laurie McNeill, Darwin Sorensen, Joan McLean, David Stevens, Tiana Hammer, William Kent WaterRF/PAC Jian Zhang; WaterRF Brian Lakin; Jacobs Associates Anne Camper; Montana State University John Consolvo; Philadelphia Water Dan Giammar; Washington University
 Elevated Fe and Mn levels Persistent elevated As, Pb, and Tl")
9 Project Motivation Metals excursion events in Park City s distribution system Dec days Nov days Destabilization of legacy deposits Event symptoms Colored tap water (initially) Elevated Fe and Mn levels Persistent elevated As, Pb, and Tl Even after water cleared up Despite daily zone-wide UDF

10 Project Motivation Excursion events occurred despite Dedicated Fe/Mn filtration process (20 years) Low (but measurable) TIC levels at zone POE Proactive semi-annual UDF program UDF conducted 2 months prior to the 2010 event Flush discharge visually clear and metals levels similar to background = flushing is at its limit Source: Park City Municipal Corporation


 Source: Park City")
11 Stubborn Legacy Deposits Pipes are cement-lined, AC, and plastic Thin, slimy films with cohesive sludge Legacy Fe/Mn precipitates Co-precipitated trace metals Biofilm (organic carbon) Source: Park City Municipal Corporation
12 Field Investigation of Mitigation Task Objective Develop guidance on effectiveness and costs of main cleaning techniques for removal of legacy deposits and contaminants Task Approach Conduct full - scale main cleaning demonstrations 1. UDF 3 fps and 6 fps sequentially 2. Foam Swabbing 3. Ice Pigging 12
13 Sites for Cleaning Trials Site Zone Rationale for Selection AST 8 CLDI Thaynes Zone of metals excursion events Low flow, moderate ATP (biofilm) UPA 8 CLDI Old Town Historically served from unfiltered mine --tunnel source with Fe, Mn, As, and Pb Numerous pipe samples with black slime

14 Cleaning Loop Development Legend UDF Loop Swabbing Loop Ice Pigging Loop Pipe Specimen Removal Representative loop lengths of 500 1,500 ft Mass removed normalized to length (lb/mile)

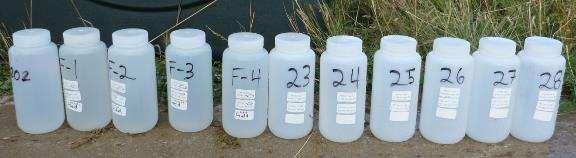

15 Unidirectional Flushing (UDF) Grab samples for AST Peak TSS = 10 mg/l


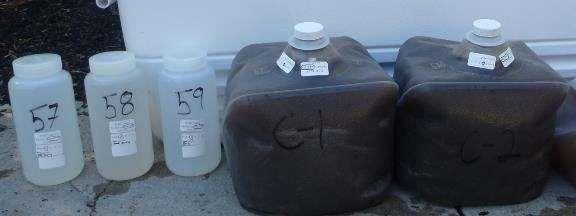
16 Foam Swabbing/Cubing Grab samples for AST Peak TSS = 1,000 mg/l

17 Foam Swabbing/Cubing of Non-Scale Forming Pipe


18 Ice Pigging Grab samples for AST Peak TSS = 900 mg/l


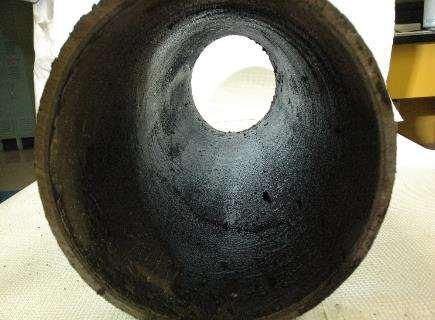
19 Pre- and Post-Cleaning Pipe Conditions After UDF at 6 fps After Ice Pigging
20 Total Solids Removed (mg/ft 2 ) Comparison of Cleaning Performance 1,000 AST Site UPA Site % 59% 95% 88% % 7% 7% 12% UDF Ice Pig Swab UDF Ice Pig Swab For UDF: 3 fps 6 fps For Swab: 1 run 2 runs % = Relative Cleaning Effectiveness
21 Occurrence (wt%) Occurrence (mg/kg) Contaminant Occurrence Trends Composition of solid removed also differs by technique Preferential vs. impaired removal Flushed mass is not simply a subset of the whole 100% 25,000 80% 20,000 60% 15,000 40% 10,000 20% 5,000 0% UDF 6 fps Ice Pigging 2-pass Swab 0 UDF 6 fps Ice Pigging 2-pass Swab Total Unidentified Mn Na Fe Ca+Mg+Al+Si Total TIC Arsenic Thallium Lead Copper
22 Flushing Ice Pigging Swabbing Conceptual Deposit Layering Bulk Water Loose Solids Fe(OH) 3 As + CaCO 3 + SiO 2 Cohesive Solids MnO 2 Pb/Tl /Cu + Biofilm Biofilm + FeOx Post-Swab Residual Pipe Wall (Lining)

23 So What Does This Mean for Utilities? Should I be swabbing or ice pigging instead? Is it even worthwhile to flush? and how frequently?
24 Routine (Unidirectional) Flushing Still Plays a Key Role Preferential removal of certain metals At AST, flushing removed: 50% of Fe and 40% of As vs. just 7% of total solids Removal of hydraulically-mobile metals Reduces risk of frequent low-level releases Helps address other system WQ issues Relatively low application cost UDF ~$1,000 per mile Swabbing/Ice Pigging ~ $6,000 per mile
25 Swab Flush Flush Flush Flush Swab but UDF cannot mitigate certain risks More aggressive cleaning needed for effective removal of Mn, biofilm, and co-occurring metals Use an integrated main cleaning strategy instead of an either/or Supports objective of meeting level-of-service goal with the lowest life-cycle cost Frequency depends on local conditions and rate of loading Example Schedule for Low-Level Loading Year
26 Conclusions Plastic and cement pipe are not clean or risk-free Current or historical Fe/Mn loading can lead to metal-rich deposits Main cleaning is critical to reduce legacy metals inventory and customer exposure risk Utilities will likely need to use a variety of cleaning techniques based on site-specific conditions Main cleaning is expensive and labor intensive prioritize locations and frequency based on risk factors and system-specific monitoring WaterRF 4509 report to be published this summer!

27 Questions? Presented By: Andrew Hill, P.E. Confluence Engineering Group, LLC
28 Reference Slides
![Exposure Risk due to Hydraulic Release Simulated Fe-As Particle Mobilization Total [As] mg/l Source: Hill et al, 2010 Mobilized [Fe] 0.02 mg/l 0.37 mg/l 0.](/docs-images/90/101591635/images/29-1.jpg "72 mg/l 1.1 mg/l 5.1 mg/l 10 mg/l 20 mg/l 1,000 100 10 MCL = 10 mg/l 1 Soluble [As] = 1.0 mg/l q = 9.6 mg As per mg Fe Soluble [As] = 3.0 mg/l q = 31.")
29 Exposure Risk due to Hydraulic Release Simulated Fe-As Particle Mobilization Total [As] mg/l Source: Hill et al, 2010 Mobilized [Fe] 0.02 mg/l 0.37 mg/l 0.72 mg/l 1.1 mg/l 5.1 mg/l 10 mg/l 20 mg/l 1, MCL = 10 mg/l 1 Soluble [As] = 1.0 mg/l q = 9.6 mg As per mg Fe Soluble [As] = 3.0 mg/l q = 31.5 mg As per mg Fe
 Pumped like a liquid Behaves like a solid once the pig is formed in the pipe Proprietary process Slurry is generated onsite")
30 How Does Ice Pigging Work? An ice pig is a semi-solid material (slurry) Pumped like a liquid Behaves like a solid once the pig is formed in the pipe Proprietary process Slurry is generated onsite using utility water and specialized eqpmt. NSF-approved NaCl is used as freezing point depressant Source: Confluence Engineering Group, LLC 34
31 7-Nov 8-Nov 9-Nov 10-Nov 11-Nov 12-Nov 13-Nov 14-Nov 15-Nov 16-Nov 17-Nov 18-Nov 7-Nov 8-Nov 9-Nov 10-Nov 11-Nov 12-Nov 13-Nov 14-Nov 15-Nov 16-Nov 17-Nov 18-Nov Manganese (mg/l) Not Speciated Thallium (mg/l) Not Speciated 7-Nov 8-Nov 9-Nov 10-Nov 11-Nov 12-Nov 13-Nov 14-Nov 15-Nov 16-Nov 17-Nov 18-Nov 7-Nov 8-Nov 9-Nov 10-Nov 11-Nov 12-Nov 13-Nov 14-Nov 15-Nov 16-Nov 17-Nov 18-Nov No Data Iron (mg/l) Arsenic (mg/l) No Data Metals Releases and Correlations SMCL = MCL = Dissolved Particulate POE = 0.05 mg/l Dissolved Particulate POE = mg/l SMCL = MCL = Dissolved Particulate POE = mg/l Dissolved Particulate POE = mg/l
32 Manganese Occurrence (wt%) Pipe Volume Displaced Occurrence Profiling UDF 6 fps Ice Pigging Ice Pig Exit Period Conductivity Alarm 10.0% UPA Site 8.0% 6.0% 4.0% 2.0% 0.0% Pipe Volume Displaced UDF 3 fps Swab #1 Swab Exit Period (Sample C8 + C9)

33 TIC Removal Heat Map Site AST Technique Total Solids (TS) Common Matrix Elements Trace Inorganic Contaminants Fe Mn Al TUEs 1 As Pb Tl TTICs 2 UDF 3 fps 4% 30% 5% 6% 2% 23% 5% 4% 8% UDF 6 fps 7% 48% 7% 11% 4% 34% 9% 8% 15% Ice Pigging 56% 57% 110% 92% 48% 98% 86% 89% 77% Swab 1 run 59% 64% 92% 87% 58% 90% 89% 88% 78% Swab 2 runs 100% 100% 100% 100% 100% 100% 100% 100% 100% UDF 3 fps 7% 11% 5% 6% 7% 29% 8% 4% 5% UDF 6 fps 12% 19% 7% 10% 11% 44% 12% 7% 7% UPA Ice Pigging 95% 70% 49% 54% 99% 54% 39% 48% 55% Swab 1 run 88% 84% 95% 92% 87% 93% 95% 96% 93% Swab 2 runs 100% 100% 100% 100% 100% 100% 100% 100% 100%
34 Comparison of Scale-Forming vs Non Scale Forming Pipe Relatively low solids inventory (lb/mile) due to absence of scale and recent high-velocity flushing But solids are relatively concentrated (ug i /g) with certain trace metals (As, Pb) due to co-precipitation with iron and manganese Why this distinction matters: Deposited co-precipitates tend to be more mobile Lower mass, but could be more concentrated Release of concentrated deposits presents an increased risk of exposure to elevated TIC levels with less obvious visual indication or discoloration
 Cement-Lined (WaterRF 4509) Solids Inventory lb/mile 250 20.")

35 PCMC Same-Zone Comparison Parameter Units Galvanized Iron (WaterRF 3118) Cement-Lined (WaterRF 4509) Solids Inventory lb/mile Fe Occurrence wt% As:Fe mg/mg Mn Occurrence wt% Tl Occurrence mg/kg Note: both pipe samples collected from Thaynes
36 The Attempted Approach Ambient Bulk Water Discharge Stream Grab Sample Particle Capture Hydrant Nets Stage 1: Initial Stage 3: Final Characterize the remaining deposit Close the Mass Balance: F= I R Discharge Stream Composite Characterize initial deposit (ref. point) Pre-Cleaning Pipe Specimen Post-Cleaning Pipe Specimen Stage 2: Removed Characterize solids removed