Perth Long Term Ocean Outlet Monitoring Program (PLOOM) Annual Report: Ocean Reef
|
|
|
- Martha Palmer
- 5 years ago
- Views:
Transcription
 2015 2016 Annual Report:")
1 Perth Long Term Ocean Outlet Monitoring Program (PLOOM) Annual Report: Ocean Reef
2


3 This report has been prepared for Water Corporation by BMT Oceanica Pty Ltd, October 2016, Report Number 1120_01_001/3_Rev0. Document history Distribution Revision Author Recipients Organisation A B 0 G Cummins C Hanson G Cummins C Hanson G Cummins C Hanson No. copies & format Date G Shiell BMT Oceanica 1 x docm 21/07/16 M Nener Water Corporation 1 x docm 05/08/16 M Nener Water Corporation 1 x pdf 2 x hard copy 06/10/16 Review Revision Reviewer Intent Date A G Shiell Technical & editorial review 25/07/16 B M Nener Client review 01/09/16 Quality Assurance BMT Oceanica Pty Ltd has prepared this report in accordance with our Health Safety Environment Quality Management System, certified to OHSAS 18001, AS/NZS 4801, ISO and ISO 9001: Status This report is 'Draft' until approved for final release, as indicated below by inclusion of signatures from: (i) the author and (ii) a Director of BMT Oceanica Pty Ltd or their authorised delegate. A Draft report may be issued for review with intent to generate a 'Final' version, but must not be used for any other purpose. Approved for final release: Author Director (or delegate) Date: 06/10/2016 Date: 06/10/2016
4
5 Contents Acronyms... iv Executive Summary... v 1. Introduction Document purpose Wastewater treatment plant infrastructure and discharge Potential stressors in treated wastewater Toxicants Physico-chemical stressors Nutrients Microbial contaminants Environmental management approach Environmental Quality Management Framework (EQMF) 'Maintenance of Ecosystem Integrity' EQO 'Maintenance of Seafood Safe for Human Consumption' EQO 'Maintenance of Primary and Secondary Contact Recreation' EQOs Maintenance of Ecosystem Integrity Environmental Quality Objective Toxicants in treated wastewater Comprehensive treated wastewater characterisation (CTWWC) Whole of effluent toxicity (WET) testing Water quality monitoring receiving environment Nutrient enrichment Phytoplankton blooms Physical-chemical stressors Monitoring summary Maintenance of Seafood for Human Consumption Environmental Quality Objective Microbiological contaminants and algal biotoxins Thermotolerant coliforms Toxic phytoplankton species Monitoring summary Maintenance of Primary and Secondary Contact Recreation Environmental Quality Objective Microbiological contaminants and algal biotoxins Faecal streptococci (Enterococci spp.) Phytoplankton cell concentrations Compliance summary i Perth Long Term Ocean Outlet Monitoring Program (PLOOM) Annual Report: Ocean Reef
6 List of Figures Figure 1.1 Location of the Beenyup WWTP and Ocean Reef ocean outlets... 1 Figure 1.2 Ocean Reef ocean outlets notional ecological protection boundaries... 5 Figure 2.1 Comparison of whole effluent toxicity TWW dilution results to artificial seawater control Figure 2.2 Median chlorophyll-a concentrations obtained at fixed monitoring sites above and down-current of the Ocean Reef outlets during the summer monitoring period Figure 2.3 Median light attenuation coefficient obtained at fixed distances downcurrent of the Ocean Reef outlets during the summer monitoring period Figure 2.4 Median phytoplankton biomass during the summer monitoring period, pooling data from fixed sites 100 m down-current of the Ocean Reef ocean outlets Figure 2.5 Median nutrient and chlorophyll-a concentrations obtained at fixed monitoring sites above and down-current of the Ocean Reef ocean outlets during the summer monitoring period Figure 2.6 Median dissolved oxygen for defined periods of 6 weeks during the summer monitoring period Figure 2.7 Median salinity compared to the 20 th and 80 th percentile of reference site data during the summer monitoring period List of Tables Table 1.1 Environmental Values and Environmental Quality Objectives for the marine waters of Western Australia... 3 Table 1.2 Levels of ecological protection... 4 Table 2.1 Environmental Quality Criteria for the EQO of Maintenance of Ecosystem Integrity (EQO1)... 7 Table 2.2 Toxicants in the Ocean Reef TWW stream compared with relevant guideline trigger levels after initial dilution Table 2.3 Total toxicity of treated wastewater (TWW) at the edge of the initial mixing zone associated with the Ocean Reef ocean outlets Table 2.4 Calculated parameters from whole of effluent toxicity tests Table 2.5 Water quality monitoring dates near the Ocean Reef ocean outlets between December 2015 and March Table 2.6 Compliance against EQC relevant to the EQO 'Maintenance of Ecosystem Integrity' (EQO1) Table 3.1 Environmental Quality Criteria for the EQO 'Maintenance of Seafood for Human Consumption' (EQO2) Table 3.2 Median thermotolerant coliform concentration at the fixed monitoring sites for the Ocean Reef outlets for and comparison to the EQC Table 3.3 Estimated cell densities of phytoplankton species known to produce toxins.. 22 Table 3.4 Compliance against EQC relevant to the EQO 'Maintenance of Seafood for Human Consumption' Table 4.1 Environmental Quality Criteria for the EQOs of 'Maintenance of Primary and Secondary Contact Recreation' (EQO4 and EQO5) Table 4.2 The 95 th percentile of Enterococci spp. concentrations at the boundary of the observed zone of influence for the Ocean Reef ocean outlets and comparison to the EQC Table 4.3 Estimated phytoplankton total cell densities at one of the fixed monitoring sites for contact recreation down-current of the Ocean Reef outlets Table 4.4 Compliance against EQC relevant to the EQO 'Maintenance of Primary and Secondary Contact Recreation' ii Perth Long Term Ocean Outlet Monitoring Program (PLOOM) Annual Report: Ocean Reef
7 List of Appendices Appendix A Beenyup wastewater treatment plant License conditions and Ministerial Statement Appendix B Analytical laboratories and methods Appendix C Comprehensive treated wastewater characterisation results Appendix D Initial dilution output Appendix E National Measurement Institute laboratory results Appendix F Detailed methodologies Appendix G Ecotox Australasia laboratory results Appendix H Marine and Freshwater Research Laboratory results Appendix I Site locations and coordinates Appendix J PathWest Microbiological Laboratory results Appendix K Dalcon Environmental Laboratory results iii Perth Long Term Ocean Outlet Monitoring Program (PLOOM) Annual Report: Ocean Reef
8 Acronyms ANZECC ARMCANZ CFU CTWWC DO DoF DoH EPA EQC EQG EQMF EQO EQS EV HEPA LAC LEPA LOEC MPN NATA NHMRC NOEC OZI PLOOM TTC TTM TWW WASQAP WET WWTP Australian and New Zealand Environment and Conservation Council Agriculture and Resource Management Council of Australia and New Zealand Colony-forming unit Comprehensive treated wastewater characterisation Dissolved oxygen Western Australian Department of Fisheries Western Australian Department of Health Environmental Protection Authority Environmental Quality Criteria Environmental Quality Guideline Environmental Quality Management Framework Environmental Quality Objective Environmental Quality Standard Environmental Value High ecological protection area Light attenuation coefficient Low ecological protection area Lowest observed effect concentration Most probable number National Association of Testing Authorities National Health and Medical Research Council No observed effect concentration Observed zone of influence Perth Long Term Ocean Outlet Monitoring Thermotolerant coliforms Total toxicity of the mixture Treated wastewater Western Australian Shellfish Quality Assurance Program Whole of effluent toxicity Wastewater treatment plant iv Perth Long Term Ocean Outlet Monitoring Program (PLOOM) Annual Report: Ocean Reef
9 Executive Summary This report documents the findings of the Ocean Reef ocean monitoring program. Results are reported in the context of the Environmental Quality Management Framework (EQMF) described in EPA (2015). The results are summarised in Report Card format (Table ES.1). The report cards contain colour-coded results, with the individual colours representing the extent to which the Environmental Quality Criteria (EQC) were met (Table ES.1). Table ES.1 Management response 1 Summary report card legend Colour Monitor: EQG met (continue monitoring) Investigative: EQG not met (investigate against the EQS), EQS met (continue monitoring) Action: EQS not met (management response required) Note: 1. The required response following an exceedance of either the Environmental Quality Guideline (EQG) or Environmental Quality Standard (EQS) is shown in parentheses. v Perth Long Term Ocean Outlet Monitoring Program (PLOOM) Annual Report: Ocean Reef
10 Table ES.2 Summary report card for the Environmental Quality Objective 'Maintenance of Ecosystem Integrity' Environmental quality indicator EQC Comments Compliance Toxicants in treated wastewater (TWW) Nutrient enrichment Phytoplankton blooms Physicalchemistry Bioaccumulating toxicants Non-bioaccumulating toxicants and initial dilution Total toxicity of the mixture (TTM) Whole of effluent toxicity testing Chlorophyll-a Light attenuation coefficient (LAC) Phytoplankton biomass (measured as chlorophyll-a) Organic enrichment Salinity EQG EQG EQG EQS EQG EQG Cadmium and mercury in the undiluted TWW stream were measured at concentrations well below the ANZECC/ARMCANZ (2000) values for 80% species protection The rate of initial dilution on (1:79) was sufficient to reduce contaminant concentrations to values lower than the ANZECC/ARMCANZ (2000) values for 99% species protection The TTM for the additive effect of ammonia, copper and zinc after initial dilution (0.61) was below the ANZECC/ARMCANZ (2000) guideline value of 1.0 The lowest NOEC recorded during the reporting period was 25% TWW. Only 4 dilutions are required to achieve this NOEC, which is lower than the dilutions typically achieved at the LEPA boundary The overall median chlorophyll-a concentration within the high ecological protection area (HEPA) was greater than the 80 th percentile of historical reference site data The overall median LAC within the HEPA was lower than the 80 th percentile of historical reference site data 1. Median chlorophyll-a levels in the HEPA exceeded 3-times median of reference sites on one occasion 2. Chlorophyll-a samples at any site (and at any time) exceeded 3-times reference levels on 6.25% of occasions There was no exceedance of chlorophyll-a levels in two consecutive sampling years At monitoring sites, dissolved oxygen saturation remained above 90% saturation at all times Within the HEPA, median salinity was within the 20th and 80th percentile of reference site data Notes: 1. Green ( ) symbols indicate the Environmental Quality Criteria (EQC) were met; amber ( ) and red ( ) symbols represent an exceedance of the Environmental Quality Guideline (EQG) or Environmental Quality Standard (EQS), respectively. 2. NOEC = no observed effect concentration; the highest concentration of TWW at which there is no statistically significant observed effect on gamete fertilisation. 3. EQO = Environmental Quality Objective. vi Perth Long Term Ocean Outlet Monitoring Program (PLOOM) Annual Report: Ocean Reef
11 Table ES.3 Summary report card for the Environmental Quality Objective 'Maintenance of Seafood for Human Consumption' Environmental quality indicator Microbiological contaminants Algal biotoxins Thermotolerant coliforms (TTC) Toxic phytoplankton species EQC Comments Compliance 1 EQG EQG EQS EQG The median value for TTC concentrations derived from 120 samples collected over the , and sampling seasons was at the limit of detection (<10 CFU/100 ml) 2 There were 14.2% ( 10%) of TTC samples that exceeded 21 CFU/100 ml over the 3-season pooled dataset (n=120) There were 6.7% ( 10%) of TTC samples that exceeded 85 CFU/100 ml over the 3-season pooled dataset (n=120) Results of the monitoring program found no instances where toxic phytoplankton species were recorded in excess of WASQAP guideline values (DoF 2007) Notes: 1. Green ( ) symbols indicate the Environmental Quality Criteria (EQC) were met; amber ( ) and red ( ) symbols represent an exceedance of the Environmental Quality Guideline (EQG) or Environmental Quality Standard (EQS), respectively. 2. TTC results below the analytical detection limit (<10 CFU/mL) were halved (= 5 CFU/mL) to calculate median values. Table ES.4 Summary report card for the Environmental Quality Objective 'Maintenance of Primary and Secondary Contact Recreation' Environmental Quality Indicator Comments EQC Compliance Faecal streptococci Enterococci spp. The 95 th percentile of Enterococci spp. concentrations was 10 MPN/100 ml EQG (primary contact) EQG (secondary contact) Algal biotoxins Phytoplankton (cell concentration) The median total phytoplankton cell concentration was 21.9 cells/ml EQG Note: 1. Green symbols ( ) indicate the Environmental Quality Criteria (EQC) were met; amber ( ) and red ( ) symbols represent an exceedance of the Environmental Quality Guideline (EQG) and Environmental Quality Standard (EQS), respectively. vii Perth Long Term Ocean Outlet Monitoring Program (PLOOM) Annual Report: Ocean Reef
12
. 1.")
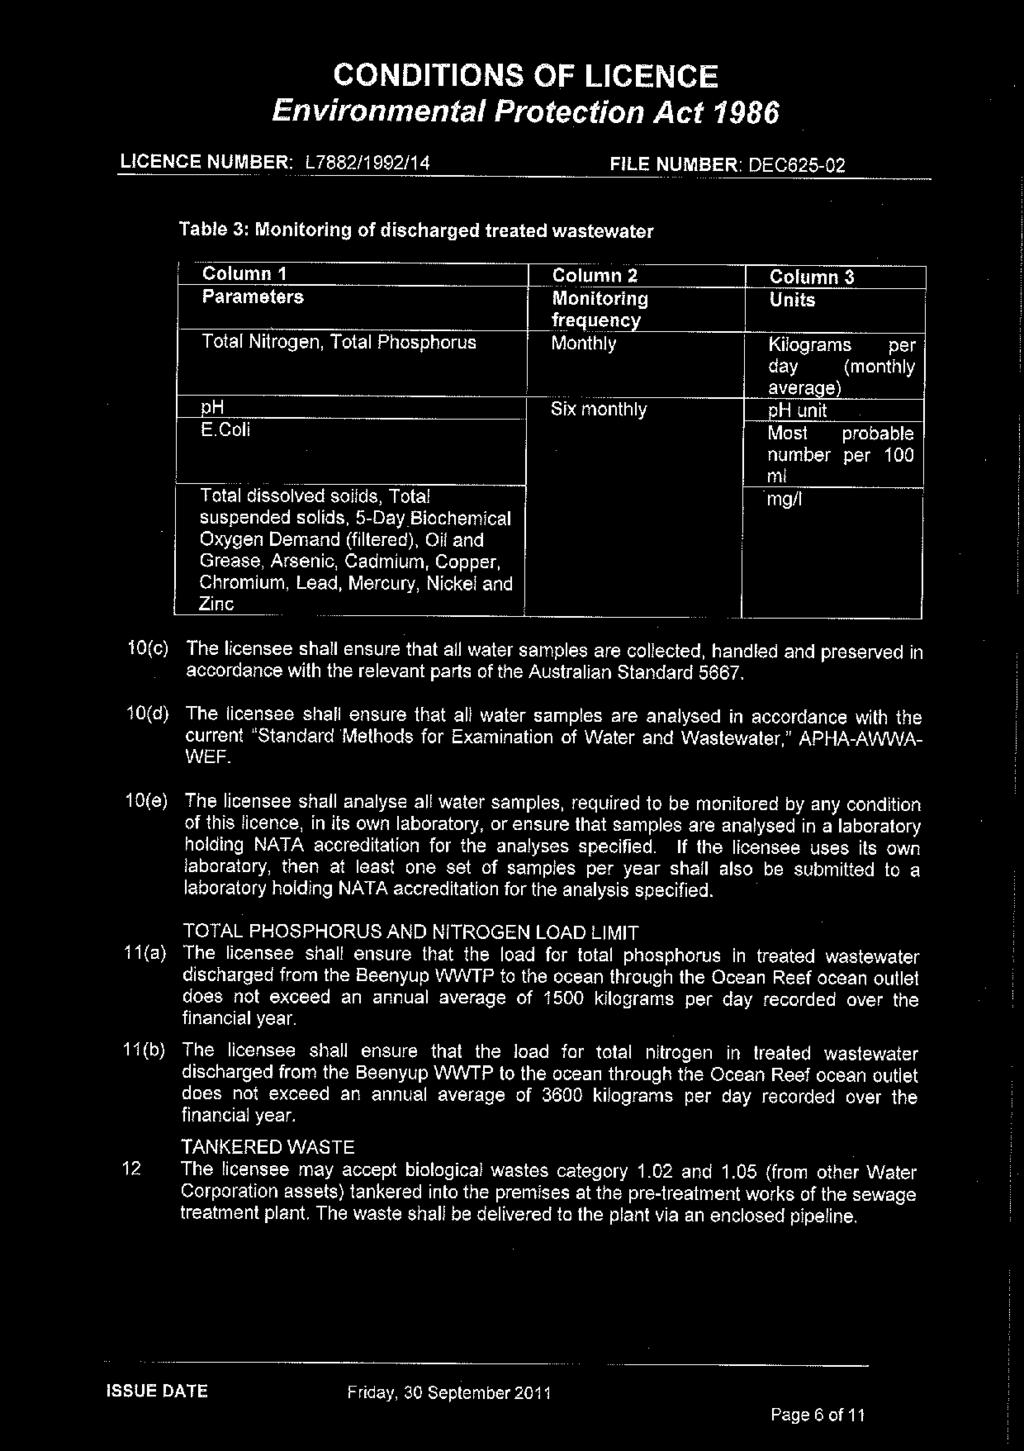
13 1. Introduction 1.1 Document purpose This annual report documents the findings of the ocean monitoring around the Ocean Reef ocean outlets. Monitoring was completed according to Western Australia's Environmental Quality Management Framework (EQMF; EPA 2015). 1.2 Wastewater treatment plant infrastructure and discharge Water Corporation operates the Beenyup wastewater treatment plant (WWTP) in metropolitan Perth, which produces advanced secondary treated wastewater (TWW) discharged to the sea through two ocean outlets at Ocean Reef (Figure 1.1). The Beenyup WWTP treats predominantly domestic wastewater from Perth's northern suburbs. The WWTP comprises ~98% domestic wastewater and less than 2% light industrial wastewater. The Beenyup WWTP discharges ~116 ML/day of secondary TWW to the sea through the two outlets at Ocean Reef. The outlets are 1.65 km (Outlet A) and 1.85 km (Outlet B) in length and located in ~10 m of water (Figure 1.1). Discharge commenced from Outlet A in 1978 and Outlet B in Figure 1.1 Location of the Beenyup WWTP and Ocean Reef ocean outlets 1.3 Potential stressors in treated wastewater Toxicants Metals and persistent organic compounds may be toxic to marine species or accumulate in biota at concentrations sufficient to pose a risk to humans when consumed. TWW is 1 Perth Long Term Ocean Outlet Monitoring Program (PLOOM) Annual Report: Ocean Reef
14 screened for bioaccumulating and non-bioaccumulating toxicants prior to discharge. To account for synergistic effects of multiple toxicants and toxicants without guidelines, the overall toxicity of the discharge is determined using whole of effluent toxicity (WET) testing (also known as direct toxicity assessment) Physico-chemical stressors TWW contains organic matter, decomposition of which by microorganisms uses oxygen. If more dissolved oxygen (DO) is consumed than is produced, DO levels decline. Measurements of DO saturation in receiving waters near the outfalls, relative to measurements at reference sites, provides an indication of the risk posed by deoxygenation. Reduced salinity near the outfalls, resulting from freshwater in the TWW plume, may cause osmotic stress in marine biota. Similar to DO, measurements of salinity in receiving waters near the outfalls are compared to the salinity at appropriate reference sites. The comparison allows evaluation of whether any reduction in salinity near the outfalls is within the range of natural variability, as recorded at the reference sites Nutrients TWW contains elevated concentrations of biologically available nutrients, including ammonia, nitrite, nitrate and orthophosphate. At times, the addition of nutrients may stimulate phytoplankton growth beyond natural levels, which under some circumstances may lead to shading of photosynthetic organisms such as seagrasses and/or macroalgae. The potential for shading is measured using in-water measures of chlorophyll-a (a measure of phytoplankton biomass) and light attenuation (a measure of water clarity). Although most algal blooms are harmless, some contain species that produce toxins that may be harmful to swimmers (via ingestion or skin contact) or to seafood. For this reason, phytoplankton species composition and cell concentrations are monitored to ensure concentrations are within acceptable limits Microbial contaminants Disease-causing organisms in the TWW pose a risk to humans if exposed during primary and/or secondary contact activities (i.e. swimming and boating). The same organisms if ingested by marine fauna may reduce their suitability for human consumption. To assess the risk, numbers of indicator organisms are routinely compared to the Environmental Protection Authority's (EPA) criteria for primary and secondary contact, and the criteria for seafood safe for human consumption. 1.4 Environmental management approach Formal monitoring and management at Ocean Reef is regulated by the Department of Environment and restricted to a number of in-line monitoring components (Appendix A). However, to maintain the best practice approach applied at other major metropolitan ocean outfalls, the Ocean Reef ocean outlets are also monitored under the Perth Long Term Ocean Outlet Monitoring (PLOOM) program, which first commenced in the mid- 1990's. The ocean monitoring program is consistent with the approach advocated under the State Government's EQMF, which is applied to Western Australia's coastal waters under EAG 15 (EPA 2015). 2 Perth Long Term Ocean Outlet Monitoring Program (PLOOM) Annual Report: Ocean Reef
15 1.4.1 Environmental Quality Management Framework (EQMF) The EQMF is based on: Identifying Environmental Values (EVs) (Table 1.1) Establishing and spatially defining Environmental Quality Objectives (EQOs) that need to be maintained to ensure the associated EVs are protected (Table 1.1) Monitoring and managing to ensure the EQOs are achieved and/or maintained in the long-term in the areas they have been designated Establishing Environmental Quality Criteria (EQC), which are quantitative benchmarks or 'trigger values' against which monitoring results can be compared. There are two levels of EQC: 1. Environmental Quality Guidelines (EQGs) are quantitative, investigative triggers which, if met, indicate there is a high degree of certainty that the associated EQO has been achieved. If the guideline is not met a more detailed assessment against the EQS is triggered. 2. Environmental Quality Standards (EQSs) are management triggers which, if exceeded, signify that the EQO is at risk of not being met and that a management response may be required. Table 1.1 Environmental Values Ecosystem Health (ecological value) Fishing and Aquaculture (social use value) Recreation and Aesthetics (social use value) Industrial Water Supply (social use value) Cultural and Spiritual (social use value) Source: EAG (2015) Environmental Values and Environmental Quality Objectives for the marine waters of Western Australia Environmental Quality Objectives EQO 1: Maintain ecosystem integrity at a maximum level of ecological protection. EQO 1: Maintain ecosystem integrity at a high level of ecological protection. EQO 1: Maintain ecosystem integrity at a moderate level of ecological protection. EQO 1: Maintain ecosystem integrity at a low level of ecological protection. This means maintaining the structure (e.g. the variety and quantity of life forms) and functions (e.g. the food chains and nutrient cycles) of marine ecosystems to an appropriate level. EQO 2: Seafood (caught or grown) is of a quality safe for eating. EQO 3: Water quality is suitable for aquaculture purposes. EQO 4: Water quality is safe for primary contact recreation (e.g. swimming and diving). EQO 5: Water quality is safe for secondary contact recreation (e.g. fishing and boating). EQO 6: Aesthetic values of the marine environment are protected. EQO 7: Water quality is suitable for industrial use. EQO 8: Cultural and spiritual values of the marine environment are protected. 3 Perth Long Term Ocean Outlet Monitoring Program (PLOOM) Annual Report: Ocean Reef
16 1.4.2 'Maintenance of Ecosystem Integrity' EQO The objective of this EQO is to maintain a healthy and diverse ecosystem. This EQO has four EQOs with each applied depending on the designated level of ecological protection: low, moderate, high or maximum (Table 1.2). Table 1.2 Levels of ecological protection Level of Ecological Protection Low Moderate High Maximum Definition Allows large changes in abundances and biomass of marine life, biodiversity and rates of ecosystem processes, but only within a confined area. Applied to relatively small areas within inner ports and adjacent to heavy industrial premises where pollution from current and/or historical activities may have compromised a high level of ecological protection. Allows for small measurable changes in the quality of water, sediment and biota, but not to a level that changes ecosystem processes, biodiversity or abundance and biomass of marine life beyond the limits of natural variation. Activities to be managed so that there were no changes beyond natural variation in ecosystem processes, biodiversity, abundance and biomass of marine life or in the quality of water, sediment and biota. In the absence of mandated management zones, a notional low ecological protection area (LEPA) has been established at the Ocean Reef outfall, as per the guidance in EAG 15 (EPA 2015). The notional LEPA occupies the area within a 100 m radius of the diffuser. Waters outside the LEPA are maintained to a high level of ecological protection (HEPA; Figure 1.2) 'Maintenance of Seafood Safe for Human Consumption' EQO The objective of this EQO is to maintain seafood safe for human consumption (a social value) with the exception of a small area surrounding the ocean outlets where EQO 2 may not apply and seafood may be unsafe to eat. Formal management zones have not been established for the Ocean Reef outlet. However, an informal zone has been established at Ocean Reef based on observations of microbiological organisms from ten years of ocean monitoring data. The zone represents the area where microbiological organism counts are most likely to exceed the EPA's criteria for seafood safe for human consumption under worst case conditions 'Maintenance of Primary and Secondary Contact Recreation' EQOs The objectives of the primary and secondary contact EQOs are to support swimming and boating activities, respectively. The EQOs apply throughout Perth's coastal waters with the exception of areas around ocean outlets, where water quality may not be suitable for swimming. A formal area where primary contact recreation is not recommended has not been established for the Ocean Reef outlet. However, an informal zone has been developed for the Ocean Reef outlet encompassing the area containing elevated microbiological concentrations. The zone was derived from ten years of field data. As the EQO for the maintenance of primary contact recreation uses a higher water quality standard than secondary contact recreation, by default it is assumed that if the primary contact criteria are met, then the secondary contact criteria are also met. 4 Perth Long Term Ocean Outlet Monitoring Program (PLOOM) Annual Report: Ocean Reef

17 Figure 1.2 Ocean Reef ocean outlets notional ecological protection boundaries 5 Perth Long Term Ocean Outlet Monitoring Program (PLOOM) Annual Report: Ocean Reef
18 2. Maintenance of Ecosystem Integrity 2.1 Environmental Quality Objective The EQO for the EV 'Ecosystem Health' is aimed at maintaining ecosystem integrity and biodiversity, and ensuring the continued health and productivity of Perth's coastal waters (EPA 2015). The EQC for the EQO 'Maintenance of Ecosystem Integrity' are outlined in Table Perth Long Term Ocean Outlet Monitoring Program (PLOOM) Annual Report: Ocean Reef
19 Table 2.1 Environmental quality indicator Toxicants in treated wastewater ammonia metals pesticides herbicides other chemicals Receiving water physical-chemical measures nutrient enrichment organic enrichment salinity Receiving water direct biological measures (algal growth potential) phytoplankton biomass (chlorophyll-a) Environmental Quality Criteria for the EQO of Maintenance of Ecosystem Integrity (EQO1) Environmental Quality Guideline Treated wastewater characterisation bioaccumulating toxicants Concentrations of contaminants will not exceed the ANZECC/ARMCANZ (2000) 80% species protection guideline trigger levels for bioaccumulating toxicants in the wastewater stream. Treated wastewater characterisation non-bioaccumulating toxicants The information on wastewater quality, in conjunction with the results from the initial dilution modelling, will be evaluated to determine whether: The ANZECC/ARMCANZ (2000) 99% species protection guideline trigger levels for toxicants (with the exception of cobalt, where the 95% guideline trigger level will apply), are being achieved at the boundary of the low ecological protection area (LEPA) (i.e. a high level of protection is met beyond a 100 m radius of the diffuser). The total toxicity of the mixture (TTM) for the additive effect of ammonia, copper and zinc, calculated as per ANZECC/ARMCANZ (2000), will not exceed the trigger value of 1.0 (refer to Section 2.2.1). Note that for metals, the assessment is to be based on bioavailable concentrations of metals in the wastewater (i.e. concentrations after filtering through a 0.45 µm filter). If any EQGs are exceeded, assessment against the EQS will commence. Whole of effluent toxicity (WET) testing The EQG will be exceeded if following the 1-hour sea urchin test: TDA DRNOEC <1.0 where TDA = Typical Dilutions Achieved (constant based on 100-fold dilution) DRNOEC = number of dilutions required to achieve the no observed effects concentration (NOEC). Breaching the above triggers investigations against the EQS, which would comprise the full suite of WET tests (minimum of five species from four trophic groups). Nutrient enrichment 1. Ambient value 3 of defined area 4 during non-river flow period 5 not to exceed chlorophyll-a: 80 th percentile of reference sites data. 2. Ambient value 3 of defined area 4 during non-river flow period 5 not to exceed light attenuation: 80 th percentile of reference sites data. Organic enrichment Ambient value 3 for dissolved oxygen in bottom waters (0 0.5 m above the sediment surface) greater than 90% saturation at any site for a defined period of not more than 6 weeks. Salinity Median salinity (0.5 m below the water surface) at an individual site over any period not to deviate beyond the 20 th and 80 th percentile of natural salinity range over the same period. Phytoplankton blooms 1. Ambient value 3 for phytoplankton biomass measured as chlorophyll-a not to exceed times median chlorophyll-a concentration of reference sites, on any occasion during non-river flow period Phytoplankton biomass measured as chlorophyll-a at any site does not exceed 3 times median chlorophyll-a concentration of reference sites, on 25% or more occasions during the non-river flow period 5. If either of these EQGs are exceeded, assessment will proceed against the EQS. Environmental Quality Criteria (EQC) 2 Environmental Quality Standard Sentinel mussel monitoring The median concentrations of metals that may bioaccumulate (cadmium and mercury) within mussel tissue from sites at the boundary of the low/high ecological protection areas will not exceed the 80 th percentile of reference site data. Whole of effluent toxicity (WET) testing Undertake the full suite of WET testing of the waste stream in accordance with ANZECC/ARMCANZ (2000) guidelines. The EQS will be exceeded where: DALEPA 1 DR99% BurrliOZ where DALEPA = dilutions achieved at the boundary of the LEPA; DR99%BurrliOZ = number dilutions required to achieve the 99% species protection guideline specific to treated wastewater that is calculated with BurrliOZ software using the results of the full suite of WET tests, as per ANZECC/ARMCANZ (2000). Whole of effluent toxicity (WET) testing As per EQS above. Not applicable. No suitable EQS available. Organic enrichment Ambient value 3 for dissolved oxygen in bottom waters (0 0.5 m above the sediment surface) greater than 60% saturation at any site for a defined period of not more than 6 weeks. No deaths of marine organisms resulting from de-oxygenation. Salinity No deaths of marine organisms resulting from anthropogenically-sourced salinity stress. Phytoplankton blooms 1. Ambient value 3 for phytoplankton biomass measured as chlorophyll-a not to exceed 3 times median chlorophyll-a concentration of reference sites, on more than one occasion during non-river flow period 5 and in two consecutive years. 2. Phytoplankton biomass measured as chlorophyll-a at any site does not exceed 3 times median chlorophyll-a concentration of reference sites, on 25% or more occasions during the non-river flow period 6 and in two consecutive years. Notes: 1. Based on the EQC Reference Document for Cockburn Sound ( ) (EPA 2005a). 3. Where there is more than one EQC for an indicator, each one is to be considered individually. If any one of these is exceeded then the guideline or standard for that indicator has not been met. 4. Ambient value = median value of individual sample data for a defined area. 5. Defined area = area to be characterised for environmental quality against pre-determined Environmental Quality Objectives and levels of ecological protection. 6. Non-river flow period = summer period December March inclusive, when river flows are weak. 7 Perth Long Term Ocean Outlet Monitoring Program (PLOOM) Annual Report: Ocean Reef
20
21 2.2 Toxicants in treated wastewater Comprehensive treated wastewater characterisation (CTWWC) TWW (final effluent) from the Beenyup WWTP is analysed for a suite of parameters comprising the major contaminants of concern for the Ocean Reef ocean outlets: nutrients (total nitrogen, ammonia, nitrate+nitrite, total phosphorus, orthophosphate) microbiological contaminants bioavailable metals (arsenic, cadmium, chromium, copper, lead, mercury, nickel, selenium, silver and zinc) pesticides and herbicides (organophosphate pesticide, organochlorine pesticides, triazine herbicides) polyaromatic hydrocarbons phthalates polychlorinated biphenyls benzene, toluene, ethylbenzene, and xylenes petroleum hydrocarbons surfactants dissolved organic carbon. A discrete sample was obtained from the Beenyup WWTP on 9 February The bulk sample was homogenised (agitated), split into individual sample containers and sent to a National Association of Testing Authorities (NATA)-accredited laboratory for analysis. Samples for bioavailable metals were filtered through a 0.45 µm filter prior to analysis (EPA 2005b). Analyses were completed using NATA-accredited methods (Appendix B). Bioaccumulating toxicants Concentrations of cadmium and mercury (i.e. bioaccumulating toxicants) in the TWW sample were both below the analytical limit of reporting <0.1 µg/l; Appendix C), and consequently below their respective 80% species protection guidelines (ANZECC/ARMCANZ 2000), thus meeting the EQG. Non-bioaccumulating toxicants Modelling predicted average initial dilution of 1:91 at Outlet A and 1:79 at Outlet B (Appendix D). The worst-case scenario initial dilution of 1:79 was used in calculations. Contaminant concentrations after the initial dilution of 1:79 (a conservative estimate of the dilution expected at the LEPA boundary) were below the ANZECC/ARMCANZ (2000) 99% species protection guidelines (Table 2.2), thus meeting the EQG. Results for analytes with relevant triggers are provided in Table 2.2, while results for analytes without triggers are provided for contextual purposes in Appendix C and Appendix E. 9 Perth Long Term Ocean Outlet Monitoring Program (PLOOM) Annual Report: Ocean Reef
22 Table 2.2 Toxicants in the Ocean Reef TWW stream compared with relevant guideline trigger levels after initial dilution Toxicant 1 Nutrients (µg/l) Ocean Reef TWW 2 TWW value after initial dilution 3 Trigger 4 Ammonia-N Dissolved metals (0.45 µm filtered) (µg/l) Chromium 5 < (Cr VI) Copper Lead <1-2.2 Nickel Silver < Zinc Organophosphate pesticides (µg/l) Chlorpyrifos 6 < Organochlorine pesticides (µg/l) Endrin < Endosulfan sulfate 7 < BTEX (µg/l) Benzene < Poly aromatic hydrocarbons (µg/l) Naphthalene < Benzo(g,h,i)perylene < Notes: 1. Assessment against ANZECC/ARMCANZ (2000) 99% species protection guideline values was undertaken only for those toxicants where trigger levels were available. 2. TWW = treated wastewater. 3. Initial dilution = 1:79 (predicted average value for Ocean Reef outlets). Contaminant dilution calculations were not performed ( ) on any toxicants where concentrations were below the analytical limit of reporting. 4. The trigger values for marine waters are from Table in ANZECC/ARMCANZ (2000). The EPA has provided advice that in WA waters where a high level of protection applies, the 99% species protection levels should be used. 5. Measured values are total chromium (Cr) while dissolved Cr in TWW is predominantly Cr III, a conservative approach was taken and assessment is against the Cr VI trigger. 6. Analytical limits for chlorpyrifos were not low enough to confirm exceedance of, or compliance with, the ANZECC/ARMCANZ (2000) guidelines. Until detection limits required for direct comparison can be attained by commercial laboratories, WET testing will provide a test of the toxicity of the wastewater stream (see Section 2.2.2). 7. Trigger values are for endosulfan, not endosulfan sulfate (Table 3.4.1; ANZECC/ARMCANZ 2000). Total toxicity of the mixture (TTM) The potential for cumulative toxic effects on marine organisms is assessed after initial dilution as per ANZECC/ARMCANZ (2000), based on the effects of ammonia, copper and zinc (the contaminants of concern based on those most likely to exceed their respective guidelines). The calculated TTM following initial dilution (0.61; Table 2.3) was less than the ANZECC/ARMCANZ (2000) guidelines value of 1.0, and thus met the EQG. 10 Perth Long Term Ocean Outlet Monitoring Program (PLOOM) Annual Report: Ocean Reef
23 Table 2.3 Total toxicity of treated wastewater (TWW) at the edge of the initial mixing zone associated with the Ocean Reef ocean outlets Natural concentrations in Perth's coastal waters (µg/l) Ammonia 1 Copper 1 Zinc 1 Initial dilution of TWW with seawater Total toxicity of the mixture (TTM) : Notes: 1. Background concentrations for copper and zinc from McAlpine et al. (2005); Perth marine waters (pp. 19; Table 12). Surface background concentration for ammonia calculated as median of reference site data from (BMT Oceanica, unpublished data). 2. Initial dilution at Outlet B was used as a conservative estimate (Appendix D). 3. TTM = [ammonia]/guideline + [copper]/guideline + [zinc]/guideline Whole of effluent toxicity (WET) testing WET testing is useful for assessing toxicity in the absence of guidelines, or where the effects may be cumulative. Fertilisation success in sea urchins (Heliocidaris tuberculata) exposed to salt adjusted dilutions (1.0, 1.6, 3.1, 6.3, 12.5, 25, 50 and 100%) of TWW was used to calculate a No Observed Effect Concentration (NOEC; the highest concentration where no significant effect is observed). Detailed methods are provided in Appendix F. There were no significant differences in fertilisation success between the artificial seawater control and any TWW dilutions of 24-hr flow-weighted composite samples collected in July 2015 and April 2016 (Figure 2.1). Significantly lower fertilisation was reported for the 50% and 100% TWW concentrations in October 2015, and the 100% TWW concentration in January 2016 (with all other concentrations not significantly different to the control; Figure 2.1). The NOEC was greater than 1% TWW in all four samples (Table 2.4; Appendix G), and thus the EQG for WET testing was met. 11 Perth Long Term Ocean Outlet Monitoring Program (PLOOM) Annual Report: Ocean Reef
24 120 July October 2015 Artificial seawater (brine) control Mean fertilisation (%) Mean fertilisation (%) % TWW 1.6% TWW 3.1% TWW 6.3% TWW 12.5% TWW 25% TWW 50% TWW 100% TWW 0 1% TWW 1.6% TWW 3.1% TWW 6.3% TWW 12.5% TWW 25% TWW 50% TWW 100% TWW Mean fertilisation (%) Notes: 1. Error bars are ± 1 standard deviation. 2. Light grey bars represent concentrations of treated wastewater (TWW) at which there is no observed significant effect on fertilisation. Dark grey bars represent concentrations of TWW that acted to significantly reduce the success of sea urchin fertilisation compared to the control. Figure 2.1 January % TWW 1.6% TWW 3.1% TWW 6.3% TWW 12.5% TWW 25% TWW 50% TWW 100% TWW Mean fertilisation (%) April Comparison of whole effluent toxicity TWW dilution results to artificial seawater control % TWW 1.6% TWW 3.1% TWW 6.3% TWW 12.5% TWW 25% TWW 50% TWW 100% TWW Table 2.4 Calculated parameters from whole of effluent toxicity tests Indicator July 2015 October 2015 January 2016 April 2016 NOEC 100% 25% 50% 100% Dilutions required to meet the NOEC Dilutions require/dilutions achieved Yes Yes Yes Yes Notes: 1. NOEC = no observed effect concentration. 2.3 Water quality monitoring receiving environment Nutrients, phytoplankton biomass and physical and chemical stressors were monitored along a down-current gradient approximately fortnightly from the beginning of December 2015 to the end of March 2016 (Table 2.5), coinciding with the summer nonriver flow period. Refer to Appendix F for detailed methods. 12 Perth Long Term Ocean Outlet Monitoring Program (PLOOM) Annual Report: Ocean Reef
25 Table 2.5 Water quality monitoring dates near the Ocean Reef ocean outlets between December 2015 and March 2016 Sampling day Date 1 04/12/ /12/ /01/ /01/ /02/ /02/ /03/ /03/ Nutrient enrichment Median chlorophyll-a concentration in the HEPA was 0.5 µg/l and above the 80 th percentile of historical reference site data (0.4 µg/l; Figure 2.2), thus exceeding the EQG. This exceedance most likely resulted from nutrient inputs potentially combined with low winds (i.e. reduced mixing) and warm water, as previously documented at Ocean Reef (BMT Oceanica 2014). Such conditions are highly favourable for the growth of phytoplankton (and therefore chlorophyll-a). There is no suitable EQS available for this parameter (Table 2.1). Notes: 1. Error bars represent ±95% confidence intervals. 2. Environmental Quality Guideline (EQG) is the 80 th percentile of historical reference site data (0.5 µg/l chlorophyll-a). 3. LEPA = notional low ecological protection area; HEPA = high ecological protection area. 4. Data for each distance were pooled across eight sampling days over December 2015 March Figure 2.2 Median chlorophyll-a concentrations obtained at fixed monitoring sites above and down-current of the Ocean Reef outlets during the summer monitoring period 13 Perth Long Term Ocean Outlet Monitoring Program (PLOOM) Annual Report: Ocean Reef
26 Median light attenuation coefficient within the HEPA was Log 10 /m and lower than the 80 th percentile of historical reference site data (0.093 Log 10 /m; Figure 2.3), thus meeting the EQG. Although median chlorophyll-a within the HEPA exceeded the EQG, there was no corresponding reduction in light attenuation. Notes: 1. Error bars represent ±95% confidence intervals. 2. Environmental Quality Guideline (EQG) is the 80 th percentile of historical reference site data (0.093 Log 10 /m). 3. LEPA = notional low ecological protection area; HEPA = high ecological protection area. 4. Data for each distance were pooled across eight sampling days over December 2015 March Figure 2.3 Median light attenuation coefficient obtained at fixed distances down-current of the Ocean Reef outlets during the summer monitoring period Phytoplankton blooms Median chlorophyll-a values within the HEPA exceeded three times the median of references sites (0.6 µg/l) on one occasion (4 December 2015; Figure 2.4). EQG1 was therefore exceeded, and further assessment was required against the EQS. There were no occasions during the previous monitoring period ( ) where the median chlorophyll-a value exceeded three times the median of reference sites (BMT Oceanica 2015). As EQG1 was not exceeded in two consecutive sampling years, the EQS for phytoplankton blooms in the reporting period was met. Chlorophyll-a samples at any site (or at any time) exceeded three times the median of reference sites on 6.25% of occasions (Appendix H), thus meeting the requirements of EQG2 (<25% of occasions). 14 Perth Long Term Ocean Outlet Monitoring Program (PLOOM) Annual Report: Ocean Reef

27 Notes: 1. Error bars represent ±95% confidence intervals. 2. Environmental Quality Guideline (EQG) is 3-times the median chlorophyll-a concentration of reference site data. 3. Values measured at 0 m are not included in the figure or EQG assessment, as the 0 m site is situated directly above the outlets within the notional low ecological protection area (LEPA). 4. Data were pooled across four sites within the high ecological protection area (HEPA). Figure 2.4 Median phytoplankton biomass during the summer monitoring period, pooling data from fixed sites 100 m down-current of the Ocean Reef ocean outlets Additional data nutrient gradients The characterisation of nutrient gradients is useful for detecting the plume footprint by determining the distance down-current where nutrient concentrations reach background concentrations. Background levels are considered to be between 20 th and 80 th percentile of historical reference site data (dark blue and light blue broken lines, respectively, in Figure 2.5). Median concentrations of nitrate+nitrite (NO x ) were elevated above background concentrations at the outlets and remained higher than background until ~200 m downcurrent (Figure 2.5B). Median concentrations of phosphate were elevated above background concentrations at the outlets and remained higher than background until ~1000 m down-current (Figure 2.5D). Dissolved inorganic nitrogen and ammonia concentrations were also elevated above background at the outlets and remained higher than background until ~500m down-current (Figure 2.5D,A). Median chlorophyll-a levels were above the 80 th percentile of historical reference site data at all of the monitoring sites (Figure 2.5E). 15 Perth Long Term Ocean Outlet Monitoring Program (PLOOM) Annual Report: Ocean Reef
28 Notes: 1. Error bars represent ± 95% confidence intervals. 2. NOx = nitrate+nitrite; DIN = dissolved inorganic nitrogen. 3. Data for each distance were pooled across eight sampling days over December 2015 March Figure 2.5 Median nutrient and chlorophyll-a concentrations obtained at fixed monitoring sites above and down-current of the Ocean Reef ocean outlets during the summer monitoring period 16 Perth Long Term Ocean Outlet Monitoring Program (PLOOM) Annual Report: Ocean Reef
 DO concentrations measured on eight occasions between December 2015 and March 2016 at the Ocean Reef monitoring sites remained >90% saturation at all times (Figure 2.6).")
.")
29 2.3.3 Physical-chemical stressors Dissolved oxygen (DO) The near bottom (0 0.5 m) DO concentrations measured on eight occasions between December 2015 and March 2016 at the Ocean Reef monitoring sites remained >90% saturation at all times (Figure 2.6). Near-bottom DO saturation at the four Ocean Reef reference sites (OR1 OR4) was <90% saturation on a number of sampling occasions, and typically less saturated than in waters potentially exposed to the TWW plume (Figure 2.6). As the ambient value for DO in bottom waters at the monitoring sites was >90% saturation over defined periods of 6 weeks during the summer monitoring period, the EQG for organic enrichment was met. Notes: 1. Error bars represent ±95% confidence intervals. 2. Dissolved oxygen (DO) measured m above the seabed. 3. Environmental Quality Guideline (EQG) = 90% DO saturation; Environmental Quality Standard (EQS) = 60% DO saturation. 4. LEPA = notional low ecological protection area; HEPA = high ecological protection area. 5. Reference site data (OR1 OR4) are compared against EQG and EQG for contextual purposes only. Figure 2.6 Salinity Median dissolved oxygen for defined periods of 6 weeks during the summer monitoring period Median salinity was lowest within the notional LEPA (directly above the outlets; Figure 2.7), and was between the 20 th and 80 th percentile of the natural salinity at all sites within the notional HEPA (at 100, 350, 1000 and 1500 m from the outlet; Figure 2.7). The EQG requires the median salinity not to deviate outside the 20 th and 80 th percentile of the natural salinity range at any individual site within the notional HEPA over the summer monitoring period, thus the EQG was met. 17 Perth Long Term Ocean Outlet Monitoring Program (PLOOM) Annual Report: Ocean Reef
30 Notes: 1. Error bars represent ±95% confidence intervals. 2. Salinity measured m below the sea surface. 3. EQG = Environmental Quality Guideline. 4. LEPA = notional low ecological protection area; HEPA = high ecological protection area. 5. Data for each distance was pooled across eight sampling occasions over December 2015 to March Figure 2.7 Median salinity compared to the 20 th and 80 th percentile of reference site data during the summer monitoring period 2.4 Monitoring summary Results of the monitoring programs revealed an EQG exceedance for nutrient enrichment, where the median chlorophyll-a concentration within the HEPA was greater than the 80 th percentile of historical reference site data. As there is no suitable EQS for nutrient enrichment, there are no formal criteria for further assessment. Nonetheless, the cause-effect pathways for nutrient enrichment suggest that elevated cholophyll-a levels are indicative of increased phytoplankton numbers, which in turn, may lead to shading of benthic primary producing habitats (i.e. local seagrasses and/or macroalgal communities). Although median chlorophyll-a within the HEPA exceeded the EQG, there was no corresponding reduction in light attenuation in the same area (Table 2.1), suggesting the integrity of benthic primary producing habitats was not at risk during the monitoring period. An exceedance of EQG1 for phytoplankton blooms was also found, where on one sampling occasion the median chlorophyll-a value within the HEPA exceeded three times the median of reference sites. In response to this exceedance, further assessment was completed against the EQS, which examines the temporal frequency of the exceedance. As the exceedance was restricted to one year and was not observed in two consecutive years, the EQS for phytoplankton blooms in the reporting period was met. All other EQG for the EQO 'Maintenance of Ecosystem Integrity' were met. These results are summarised in Table Perth Long Term Ocean Outlet Monitoring Program (PLOOM) Annual Report: Ocean Reef
31 Table 2.6 Compliance against EQC relevant to the EQO 'Maintenance of Ecosystem Integrity' (EQO1) Environmental quality indicator EQC Comments Compliance Toxicants in treated wastewater (TWW) Nutrient enrichment Phytoplankton blooms Physicalchemistry Bioaccumulating toxicants Non-bioaccumulating toxicants and initial dilution Total toxicity of the mixture (TTM) Whole of effluent toxicity testing Chlorophyll-a Light attenuation coefficient (LAC) Phytoplankton biomass (measured as chlorophyll-a) Organic enrichment Salinity EQG EQG EQG EQS EQG EQG Cadmium and mercury in the undiluted TWW stream were measured at concentrations below the ANZECC/ARMCANZ (2000) values for 80% species protection The rate of initial dilution (1:79) was sufficient to reduce contaminant concentrations to values lower than the ANZECC/ARMCANZ (2000) values for 99% species protection The TTM for the additive effect of ammonia, copper and zinc after initial dilution (0.61) was below the ANZECC/ARMCANZ (2000) guideline value of 1.0 The lowest NOEC recorded during the reporting period was 25% TWW. Only 4 dilutions are required to achieve this NOEC, which is lower than the dilutions typically achieved at the LEPA boundary The overall median chlorophyll-a concentration within the high ecological protection area (HEPA) was greater than the 80 th percentile of historical reference site data The overall median LAC within the HEPA was lower than the 80 th percentile of historical reference site data 1. Median chlorophyll-a levels in the HEPA exceeded 3-times median of reference sites on one occasion 2. Chlorophyll-a samples at any site (and at any time) exceeded 3- times reference levels on 6.25% of occasions There was no exceedance of chlorophyll-a levels in two consecutive sampling years At monitoring sites, dissolved oxygen saturation remained above 90% saturation at all times Within the HEPA, median salinity was within the 20th and 80th percentile of reference site data Notes: 1. Green ( ) symbols indicate the Environmental Quality Criteria (EQC) were met; amber ( ) and red ( ) symbols represent an exceedance of the Environmental Quality Guideline (EQG) or Environmental Quality Standard (EQS), respectively. 2. NOEC = no observed effect concentration; the highest concentration of TWW at which there is no statistically significant observed effect on gamete fertilisation. 3. EQO = Environmental Quality Objective. 19 Perth Long Term Ocean Outlet Monitoring Program (PLOOM) Annual Report: Ocean Reef
32 3. Maintenance of Seafood for Human Consumption 3.1 Environmental Quality Objective The EQO for the EV 'Fishing and Aquaculture' is aimed at ensuring seafood is safe for human consumption. The EQC for the EQO 'Maintenance of Seafood for Human Consumption' are outlined in Table 3.1. Table 3.1 Environmental quality indicator Thermotolerant coliforms (TTC) Algal biotoxins Environmental Quality Criteria for the EQO 'Maintenance of Seafood for Human Consumption' (EQO2) Environmental Quality Guideline Environmental Quality Criteria Median TTC concentrations at sites at the boundary of the Observed Zone of Influence (OZI) are not to exceed 14 CFU/100 ml, with no more than 10% of the samples exceeding 21 CFU/100 ml as measured using the membrane filtration method. Concentrations of potentially toxic algae at sites at the boundary of the OZI not to exceed the WASQAP 1 trigger concentrations for any of the following: Alexandrium spp. 2 (100 cells/l) Gymnodinium spp. (1000 cells/l) Karenia spp. 2 (1000 cells/l) Dinophysis spp. 2 (500 cells/l) Dinophysis acuminta (3000 cells/l) Prorocentrum lima (500 cells/l) Psuedo-nitzschia spp. 2 ( cells/l) Gonyaulax cf. spinifera (100 cells/l) Protoceratium reticulatum (Gonyaulax grindleyi) (500 cells/l) If this EQG is exceeded, assessment will proceed against the EQS for sentinel mussel tissues. Environmental Quality Standard Median TTC concentrations at sites at the boundary of the OZI not to exceed 70 CFU/100 ml, with no more than 10% of the samples exceeding 85 CFU/100 ml as measured using the membrane filtration method. Toxin concentrations in seafood not to exceed the values shown below in any sample at the boundary of the OZI 1 : paralytic shellfish poison (0.8 mg Saxitoxin eq./kg) diarrhoetic shellfish poison (0.2 mg/kg) neurotoxic shellfish poison (200 mouse units/kg) amnesic shellfish poison (domoic acid; 20 mg/kg). Notes: 1. Western Australian Shellfish Quality Assurance Program (WASQAP) Operations Manual (DoF 2007) 2. As per species list in WASQAP Operations Manual (DoF 2007). 3.2 Microbiological contaminants and algal biotoxins Thermotolerant coliforms TTC were sampled eight times over the summer monitoring period (yielding a total of 40 samples; Appendix J). NHMRC (2008) guidelines and EPA (2005b) suggest that a minimum of 100 samples over the monitoring period are needed for accurate assessment of the EQC. Data from multiple years can be pooled where there are <100 samples provided local pollution conditions have not changed (NHMRC 2008). Assuming conditions have not changed, data collected over three summers (since summer ) were pooled to yield an adequate sample size (n=120). The median concentration of TTC derived from the three years of pooled samples was equal to the limit of detection (<10 CFU/100 ml; Table 3.2), thus meeting the EQG criterion for median concentrations (not to exceed 14 CFU/100 ml). Over the three sampling periods, there were 17 instances where TTC exceeded 21 CFU/100mL, representing 14.2% of samples and exceeding the EQG criterion ( 10%) for percentage of samples above 21 CFU/100 ml. Therefore, assessment against the EQS was 20 Perth Long Term Ocean Outlet Monitoring Program (PLOOM) Annual Report: Ocean Reef
33 triggered. Median TTC concentrations at monitoring sites on the boundary of the OZI were at the limit of detection <10 CFU/100 ml, meeting the EQS criterion for median concentrations (not to exceed 70 CFU/100 ml). Over the three sampling periods there were eight instances where TTC exceeded 85 CFU/100 ml representing 6.7% of samples and meeting the EQS criterion ( 10%) for percentage of samples above 85 CFU/100 ml. Table 3.2 Sampling period Median thermotolerant coliform concentration at the fixed monitoring sites for the Ocean Reef outlets for and comparison to the EQC Environmental Quality Guideline Result Compliance (EQG) Median TTC 14 CFU/100 ml <10 CFU/100 ml Dec 2013 Mar 2014 Dec 2014 Mar 2015 Dec 2015 Mar 2016 (n=120) 10% of samples exceed 21 CFU/100 ml Environmental Quality Standard Median TTC 70 CFU/100 ml 14.2% exceeded 21 CFU/100 ml Result <10 CFU/100 ml Compliance (EQS) 10% of samples exceed 85 CFU/100 ml 6.7% exceeded 85 CFU/100 ml Notes: 1. Green symbols ( ) indicate the Environmental Quality Criteria (EQC) were met; amber ( ) and red ( ) symbols represent an exceedance of the Environmental Quality Guideline (EQG) and Environmental Quality Standard (EQS), respectively. 2. For site locations and GPS waypoints, see Appendix I 3. Thermotolerant coliform results below the analytical detection limit (< 10 CFU/100 ml) were halved (= 5 CFU/100 ml) to calculate the median. 4. Environmental Quality Criteria are based on EPA (2005a) Toxic phytoplankton species There were no instances where toxic phytoplankton species were present at densities greater than the Western Australian Shellfish Quality Assurance Program (WASQAP; DoF 2007) guideline values (Table 3.3; Appendix K) 21 Perth Long Term Ocean Outlet Monitoring Program (PLOOM) Annual Report: Ocean Reef
34 Table 3.3 Estimated cell densities of phytoplankton species known to produce toxins Date Site 1 Species 04/12/ /12/2016 OR22 monitoring ORR2 reference OR22 monitoring ORR2 reference Estimated density (cells/l) WASQAP guideline 2 Compliance 3 No toxic species detected NA NA No toxic species detected NA NA No toxic species detected NA NA No toxic species detected NA NA 6/01/2016 OR26 monitoring ORR2 reference Pseudo-nitzschia 'delicatissima group' Pseudo-nitzschia 'delicatissima group' /01/2016 OR28 monitoring ORR2 reference No toxic species detected NA NA Pseudo-nitzschia 'delicatissima group' /02/2016 OR22 monitoring ORR2 reference Pseudo-nitzschia 'delicatissima group' Pseudo-nitzschia 'delicatissima group' /02/2016 OR26 monitoring ORR2 reference No toxic species detected NA NA No toxic species detected NA NA 2/03/2016 OR26 monitoring ORR2 reference Pseudo-nitzschia 'delicatissima group' Pseudo-nitzschia 'delicatissima group' /03/2016 OR22 monitoring ORR2 reference No toxic species detected NA NA No toxic species detected NA NA Notes: 1. Samples were analysed for one monitoring site and one reference site per sampling occasion. 2. Western Australian Shellfish Quality Assurance Program (WASQAP; DoF 2007). 3. Green ( ) symbols indicate the Environmental Quality Criteria (EQC) were met; amber ( ) and red ( ) symbols represent an exceedance of the Environmental Quality Guideline (EQG) or Environmental Quality Standard (EQS), respectively. 4. For site locations and GPS waypoints, see Appendix I. 5. NA = not applicable. 3.3 Monitoring summary Results of the monitoring programs revealed no exceedances of EQGs for the EQO 'Maintenance of Seafood for Human Consumption' (Table 3.4). 22 Perth Long Term Ocean Outlet Monitoring Program (PLOOM) Annual Report: Ocean Reef
35 Table 3.4 Compliance against EQC relevant to the EQO 'Maintenance of Seafood for Human Consumption' Environmental quality indicator Microbiological contaminants Algal biotoxins Thermotolerant coliforms (TTC) Toxic phytoplankton species EQC Comments Compliance 1 EQG EQG EQS EQG The median value for TTC concentrations derived from 120 samples collected over the , and sampling seasons was at the limit of detection (<10 CFU/100 ml) % of TTC samples exceeded 21 CFU/100 ml over the 3-season pooled dataset (n=120), thus exceeding the 10% trigger 6.7% of TTC samples exceeded 85 CFU/100 ml over the 3-season pooled dataset (n=120), thus meeting the 10% trigger Results of the monitoring program found no instances where toxic phytoplankton species were recorded in excess of WASQAP guideline values (DoF 2007) Note: 1. Green ( ) symbols indicate the Environmental Quality Criteria (EQC) were met; amber ( ) and red ( ) symbols represent an exceedance of the Environmental Quality Guideline (EQG) or Environmental Quality Standard (EQS), respectively. 2. TTC results below the analytical detection limit (<10 CFU/mL) were halved (= 5 CFU/mL) to calculate median values. 23 Perth Long Term Ocean Outlet Monitoring Program (PLOOM) Annual Report: Ocean Reef
36 4. Maintenance of Primary and Secondary Contact Recreation 4.1 Environmental Quality Objective The EQOs for the EV 'Recreation and Aesthetics' are aimed at ensuring Perth's coastal waters are safe for primary and secondary contact recreation activities such as swimming and boating. The EQC for the EQO 'Maintenance of Primary and Secondary Contact Recreation' are outlined in Table 4.1. Table 4.1 Environmental Quality Criteria for the EQOs of 'Maintenance of Primary and Secondary Contact Recreation' (EQO4 and EQO5) Environmental quality indicators Faecal pathogens Algal biotoxins Environmental Quality Guideline Primary contact: The 95 th percentile value of Enterococci concentrations taken over the bathing season not to exceed 200 MPN/100 ml at the observed zone of influence (OZI) boundary. Secondary contact: The 95 th percentile value of Enterococci concentrations taken over the bathing season not to exceed 2000 MPN/100 ml at the OZI boundary. Median total phytoplankton cell concentration for the area of concern (either from one sampling run or from a single site over agreed period of time) should not exceed cells/ml. or There should be no reports of skin or eye irritation or potential algal poisoning in swimmers considered by a medical practitioner as potentially resulting from toxic algae when less than cells/ml are present in the water column. Environmental Quality Criteria Environmental Quality Standard Primary contact: The 95 th percentile value of Enterococci concentrations taken over the bathing season not to exceed 500 MPN/100 ml at the OZI boundary. Secondary contact: The 95 th percentile value of Enterococci concentrations taken over the bathing season not to exceed 5000 MPN/100 ml at the OZI boundary. There should be no confirmed incidences (by the Department of Health) of skin or eye irritation caused by toxic algae, or of algal poisoning in recreational users. 4.2 Microbiological contaminants and algal biotoxins Faecal streptococci (Enterococci spp.) Samples were collected eight times over the summer monitoring period (yielding a total of 40 samples). NHMRC (2008) guidelines and EPA (2005b) suggest that a minimum of 100 samples over the monitoring period are needed for accurate assessment of the EQC. Data from multiple years can be pooled where there are less than 100 samples provided local pollution conditions have not changed (NHMRC 2008). Assuming conditions have not changed, data from the past three summers were pooled to yield an adequate sample size (n=120). The 95 th percentile of Enterococci spp. concentrations based on 120 samples was 10 MPN/100 ml (Table 4.2), thus meeting the EQG for both primary and secondary contact recreation (200 and 2000 MPN/100 ml, respectively). 24 Perth Long Term Ocean Outlet Monitoring Program (PLOOM) Annual Report: Ocean Reef
37 Table 4.2 The 95 th percentile of Enterococci spp. concentrations at the boundary of the observed zone of influence for the Ocean Reef ocean outlets and comparison to the EQC Sampling period Dec 2013 Mar 2014 Dec 2014 Mar 2015 Dec 2015 Mar 2016 (n=120) 95 th percentile 1 (MPN/100 ml) 10 Primary contact Compliance 2 Secondary contact Notes: 1. Enterococci spp. values below the analytical detection limit (< 10 MPN/100 ml) were halved (= 5 MPN/100 ml) to calculate the 95 th percentile. 2. Green symbols ( ) indicate the Environmental Quality Criteria (EQC) were met; amber ( ) and red ( ) symbols represent an exceedance of the Environmental Quality Guideline (EQG) and Environmental Quality Standard (EQS), respectively. 3. For site locations and GPS waypoints, see Appendix I. 4. Environmental Quality Criteria (EQC) based on EPA (2005a) water quality guidelines for recreation waters Phytoplankton cell concentrations Median phytoplankton density was 21.9 cells/ml (Table 4.3; Appendix K), thus meeting the EQG of cells/ml. Table 4.3 Estimated phytoplankton total cell densities at one of the fixed monitoring sites for contact recreation down-current of the Ocean Reef outlets Date Site Total density (cells/ml) Compliance 4/12/2016 OR /12/2016 OR /01/2016 OR /01/2016 OR /02/2016 OR /02/2016 OR /03/2016 OR /03/2016 OR7 6.6 Median (all data) 21.9 Notes: 1. Green symbols ( ) indicate the Environmental Quality Criteria (EQC) were met; amber ( ) and red ( ) symbols represent an exceedance of the Environmental Quality Guideline (EQG) and Environmental Quality Standard (EQS), respectively. 2. For site locations and GPS waypoints, see Appendix I. 4.3 Compliance summary Results of the monitoring programs revealed no exceedances of EQGs for the EQO 'Maintenance of Primary and Secondary Contact Recreation' (Table 4.4). 25 Perth Long Term Ocean Outlet Monitoring Program (PLOOM) Annual Report: Ocean Reef
38 Table 4.4 Environmental Quality Indicator Faecal streptococci Algal biotoxins Compliance against EQC relevant to the EQO 'Maintenance of Primary and Secondary Contact Recreation' Enterococci spp. Phytoplankton (cell concentration) Comments EQC Compliance The 95 th percentile of Enterococci spp. concentrations was 10 MPN/100 ml The median total phytoplankton cell concentration was 21.9 cells/ml EQG (primary contact) EQG (secondary contact) Note: 1. Green symbols ( ) indicate the Environmental Quality Criteria (EQC) were met; amber ( ) and red ( ) symbols represent an exceedance of the Environmental Quality Guideline (EQG) and Environmental Quality Standard (EQS), respectively. EQG 26 Perth Long Term Ocean Outlet Monitoring Program (PLOOM) Annual Report: Ocean Reef
39 References ANZECC/ARMCANZ (2000) National Water Quality Management Strategy: Paper No 4 Australian and New Zealand Guidelines for Fresh and Marine Water Quality. Volume 1 The Guidelines (Chapters 1 7). Australian and New Zealand Environment and Conservation Council and Agriculture and Resource Management Council of Australia and New Zealand, Canberra, Australian Capital Territory, October 2000 BMT Oceanica (2014) Perth Long Term Ocean Outlet Monitoring Program (PLOOM) Annual Report: Ocean Reef. Prepared for Water Corporation by BMT Oceanica Pty Ltd, Report No. 788_04_006/2_Rev0, Perth, Western Australia, June 2014 BMT Oceanica (2015) Perth Long Term Ocean Outlet Monitoring Program (PLOOM) Annual Report: Ocean Reef. Prepared for Water Corporation by BMT Oceanica Pty Ltd, Report No. 1120_006/4_Rev0, Perth, Western Australia, June 2015 DoF (2007) Western Australian Shellfish Quality Assurance Program (WASQAP) Operations Manual. Department of Fisheries, Perth, Western Australia EPA (2005a) Environmental Quality Criteria Reference Document for Cockburn Sound ( ) A supporting document to the State Environmental (Cockburn Sound) Policy Environmental Protection Authority, Report No. 20, Perth, Western Australia EPA (2005b) Manual of Standard Operating Procedures For Environmental Monitoring against the Cockburn Sound Environmental Quality Criteria ( ) A supporting document to the State Environmental (Cockburn Sound) Policy Environmental Protection Authority, Report No. 21, Perth, Western Australia EPA (2015) Environmental Assessment Guideline for Protecting the Quality of Western Australia's Marine Environment. Environmental Protection Authority, Report No. EAG 15, Perth, Western Australia, March 2015 McAlpine KW, Wenziker KJ, Apte SC, Masini RJ (2005) Background quality for coastal marine waters of Perth, Western Australia. Department of Environment, Report No. 117, Perth, Western Australia NHMRC (2008) Guidelines for Managing Risks in Recreational Water. National Health and Medical Research Council, Canberra, Australian Capital Territory 27 Perth Long Term Ocean Outlet Monitoring Program (PLOOM) Annual Report: Ocean Reef
40
41 Appendices on CD Appendix E National Measurement Institute Laboratory results Appendix G Ecotox Australasia Laboratory results Appendix H Marine and Freshwater Research Laboratory results Appendix J PathWest Microbiological Laboratory results Appendix K Dalcon Environmental Laboratory results Appendices listed above are available on CD by contacting BMT Oceanica Pty Ltd
42
43 Appendix A Beenyup wastewater treatment plant License conditions and Ministerial Statement
44
45

46

47

48
49
50

51

52

53

54

55
56
57
58
59
60

61

62
63
64
65
66
67
68

69
70
71
72
73
74
75 Appendix B Analytical laboratories and methods
76
77 Analytical Laboratories Analytes determined and analytical laboratories used for treated wastewater characterisation Analytes Microbiological E.coli Enterococci Nutrients Ortho-phosphate Ammonia Nitrate + Nitrite Total Nitrogen Total Phosphorus Analytical Laboratory PathWest Laboratory Medicine WA PathWest Laboratory Medicine WA Murdoch University Marine and Freshwater Research Laboratory (MAFRL) and/or National Measurement Institute (NMI) Analytical Method Membrane filtration Membrane filtration Lachat-Automated Flow Injection Analyser (4100) Lachat-Automated Flow Injection Analyser (2000) Lachat-Automated Flow Injection Analyser (2100) Lachat-Automated Flow Injection Analyser (2700) Lachat-Automated Flow Injection Analyser (4700) Reporting Limit Dilution dependent (1) Dilution dependent (1) Unit CFU 100 ml -1 MPN 100 ml -1 2 (2) μg P L -1 3 (2) μg N L -1 2 (2) μg N L (2) μg N L -1 5 (2) μg P L -1 Metals and Metalloids Arsenic filtered National Inductively coupled plasma Measurement mass spectrometry and Institute (NMI) inductively coupled plasma atomic emission 1 μg L -1 spectrometry (NT ) Arsenic total NT μg L -1 Cadmium filtered Inductively coupled plasma mass spectrometry and inductively coupled plasma 0.1 μg L -1 atomic emission spectrometry (NT2.47) Cadmium total NT μg L -1 Chromium filtered NT μg L -1 Chromium total NT μg L -1 Copper filtered NT μg L -1 Copper total NT μg L -1 Lead filtered NT μg L -1 Lead total NT μg L -1 Mercury filtered Inductively coupled plasma mass spectrometry and inductively coupled plasma atomic emission 0.1 μg L -1 spectrometry (NT ) Mercury total NT μg L -1 Nickel filtered NT μg L -1 Nickel total NT μg L -1 Selenium filtered NT μg L -1 Selenium total NT μg L -1 Silver filtered NT μg L -1 Silver total NT μg L -1 Zinc filtered NT μg L -1 Zinc total NT μg L -1
78 Analytical Analytes Laboratory Phenoxy Acid Herbicides Dicamba National Measurement Institute (NMI) Analytical Method Electron Impact Full Scan or Selected Ion Monitoring (NGCMS_1117) Reporting Limit Unit 1 μg L -1 MCPA NGCMS_ μg L -1 Dichlorprop NGCMS_ μg L -1 2,4-D NGCMS_ μg L -1 2, 4, 5-T NGCMS_ μg L , 5 TP NGCMS_ μg L -1 2, 4-DB NGCMS_ μg L -1 MCPP NGCMS_ μg L -1 Trichlopyr NGCMS_ μg L -1 Triazine Herbicides Atrazine National Measurement Institute (NMI) Extraction, Cleanup and Analysis (NR_19) 0.1 μg L -1 Hexazinone NR_ μg L -1 Metribuzine NR_ μg L -1 Prometryne NR_ μg L -1 Simazine NR_ μg L -1 Organophosphate Pesticides Azinphos-Methyl National NR_ μg L -1 Azinphos-Ethyl Chlorpyrifos Measurement Institute (NMI) NR_19 NR_ μg L -1 μg L -1 Chlorpyrifos Methyl NR_ μg L -1 Chlorfenvinophos (E) NR_ μg L -1 Chlorfenvinphos (Z) NR_ μg L -1 Demeton-S-Methyl NR_ μg L -1 Dichlorvos NR_ μg L -1 Diazinon NR_ μg L -1 Dimethoate NR_ μg L -1 Ethion NR_ μg L -1 Fenthion NR_ μg L -1 Fenitrothion NR_ μg L -1 Malathion NR_ μg L -1 Parathion (Ethyl) NR_ μg L -1 Parathion Methyl NR_ μg L -1 Pirimiphos-Ethyl NR_ μg L -1 Pirimiphos-Methyl NR_ μg L -1 Organochlorine Pesticides Aldrin National NR_ μg L -1 trans-chlordane Measurement NR_ μg L -1 cis-chlordane Institute (NMI) NR_ μg L -1 Oxychlordane NR_ μg L -1 BHC (other than lindane) NR_ μg L -1 DDD NR_ μg L -1 DDE NR_ μg L -1 DDT NR_ μg L -1 Dieldrin NR_ μg L -1 Endrin NR_ μg L -1 Endrin Aldehyde NR_ μg L -1 Endrin Ketone NR_ μg L -1 alpha-endosulfan NR_ μg L -1 beta-endosulfan NR_ μg L -1 Endosulfan Sulfate NR_ μg L -1 HCB NR_ μg L -1
79 Analytes Analytical Laboratory Analytical Method Reporting Limit Heptachlor NR_ μg L -1 Heptachlor epoxide NR_ μg L -1 Lindane NR_ μg L -1 Methoxychlor NR_ μg L -1 Phthalates Dimethyl phthalate National Measurement Institute (NMI) Electron Impact or Selected Ion Monitoring (NGCMS_1111) Unit 10 μg L -1 Diethyl phthalate NGCMS_ μg L -1 Di-n-butyl phthalate NGCMS_ μg L -1 Benzyl butyl phthalate NGCMS_ μg L -1 Bis(2- ethylhexyl)phthalate NGCMS_ μg L -1 Di-n-octyl phthalate NGCMS_ μg L -1 PCB Aroclors Aroclor 1016 National NR_ μg L -1 Aroclor 1221 Measurement NR_ μg L -1 Aroclor 1232 Institute (NMI) NR_ μg L -1 Aroclor 1242 NR_ μg L -1 Aroclor 1248 NR_ μg L -1 Aroclor 1254 NR_ μg L -1 Aroclor 1260 NR_ μg L -1 Total PCBs (as above) NR_ μg L -1 Chlorinated Hydrocarbons 2-Chloronaphthalene National Measurement Institute (NMI) Extraction, Filtration and Analysis using a modified USEPA 8270 method (NGCMS_1122) 20 μg L -1 1,4-Dichlorobenzene NGCMS_ μg L -1 1,2-Dichlorobenzene NGCMS_ μg L -1 1,3-Dichlorobenzene NGCMS_ μg L -1 Hexachlorobenzene NGCMS_ μg L -1 1,2,4-Trichlorobenzene NGCMS_ μg L -1 Hexachloroethane NGCMS_ μg L -1 Hexachlorocyclopentadi ene NGCMS_ μg L -1 Hexachloro-1,3- butadiene NGCMS_ μg L -1 Ethers 4-Bromophenyl phenyl ether 4-Chlorophenyl phenyl ether National Measurement Institute (NMI) NGCMS_ μg L -1 NGCMS_ μg L -1 Bis(2-chloroethyl)ether NGCMS_ μg L -1 Bis(2- chloroethoxy)methane NGCMS_ μg L -1 Bis(2- chloroisopropyl)ether NGCMS_ μg L -1 Amines, Nitroaromatics & Nitrosamines Azobenzene National NGCMS_ μg L -1 2,4-Dinitrotoluene Measurement NGCMS_ μg L -1 2,6-Dinitrotoluene Institute (NMI) NGCMS_ μg L -1 Nitrobenzene NGCMS_ μg L -1 NNitrosodimethylamine NGCMS_ μg L -1 N- Nitrosodiphenylamine NGCMS_ μg L -1 N-Nitrosodi-n- NGCMS_ μg L -1
80 Analytes Analytical Laboratory Analytical Method Reporting Limit propylamine Aniline NGCMS_ μg L -1 4-Chloroaniline NGCMS_ μg L -1 2-Nitroaniline NGCMS_ μg L -1 3-Nitroaniline NGCMS_ μg L -1 4-Nitroaniline NGCMS_ μg L -1 Other Organics Dichlorobenzidine NGCMS_ μg L -1 2-Methylnaphthalene NGCMS_ μg L -1 National Isophorone NGCMS_ μg L -1 Measurement Benzyl alcohol Institute (NMI) NGCMS_ μg L -1 Carbazole NGCMS_ μg L -1 Dibenzofuran NGCMS_ μg L -1 BTEX Benzene National Measurement Institute (NMI) Purge and trap technique with GC/FID (WL244) Unit 1 μg L -1 Toluene WL244 1 μg L -1 Ethylbenzene WL244 1 μg L -1 Xylene WL244 2 μg L -1 Total BTEX WL244 5 μg L -1 TPH TPH C6-C9 WL μg L -1 TPH C10-C14 National Measurement Institute (NMI) Gas chromatography with flame ionisation detection (WL203) 25 μg L -1 TPH C15-C28 WL μg L -1 TPH C29-C36 WL μg L -1 Total Petroleum Hydrocarbons (TPH) WL μg L -1 PAHs Naphthalene National NGCMS_ μg L -1 Acenaphthylene Measurement NGCMS_ μg L -1 Acenaphthene Institute (NMI) NGCMS_ μg L -1 Fluorene NGCMS_ μg L -1 Phenanthrene NGCMS_ μg L -1 Anthracene NGCMS_ μg L -1 Fluoranthene NGCMS_ μg L -1 Pyrene NGCMS_ μg L -1 Benzo(a)anthracene NGCMS_ μg L -1 Chrysene NGCMS_ μg L -1 Benzo(b)&(k)fluoranth ene NGCMS_ μg L -1 Benzo(a)pyrene NGCMS_ μg L -1 Indeno(1,2,3- cd)pyrene NGCMS_ μg L -1 Dibenz(ah)anthracene NGCMS_ μg L -1 Benzon(ghi)perylene NGCMS_ μg L -1 Surfactants methylene blue active SGS Australia Methylene dye added, based on test APHA 5540C substances (MBAS) * extraction and colorimetrically measured n/a n/a Miscellaneous Other Chlorine-Free National Measurement Institute (NMI) Colour test by comparision with coloured disc (WL146) 0.02 mg/l Chlorine-Total WL mg/l Dissolved Organic Split Sample and Compare n/a mg/l
81 Analytes Analytical Laboratory Analytical Method Reporting Limit Carbon (after filtering) Total Carbon and Inorganic Carbon measured with Infrared Detector Based on Method APHA 5310B (WL240) Total Organic Carbon WL240 n/a mg/l Total Suspended Solids Gravimetric Procedure Based on APHA Methods 2540D and E (WL126) 5 mg/l 5-day Biological Oxygen Demand ph 5 Day Incubation of Neutralised, Chlorine Free Sample Based on APHA Method 5210B (WL189) Measured Potentiometrically Using a Combination Electrode (WL120) Unit 5 mg/l 0.1 ph unit Notes: 1. The upper and lower detection limits for microbiological indicators are dependent on the dilution of the original sample. 2. Method detection limit determined from 3.2 x standard deviation of 10 standard samples. n/a = information not available
82 Analytical methods and reporting limits for water quality parameters Parameter Analytical Method(1) Reporting Limit Unit Nutrients Ortho-phosphate Lachat-Automated Flow Injection Analyser (4100) 2 (2) µg P L -1 Ammonia Lachat-Automated Flow Injection Analyser (4100) 3 (2) µg P L -1 Nitrate + Nitrite Lachat-Automated Flow Injection Analyser (4100) 2 (2) µg P L -1 Primary Production Chlorophyll-a Acetone extraction (3000) 0.1 (2) µg P L -1 Phaeophytin Acetone extraction (3000) 0.1 (2) µg P L -1 Microbiological Indicators E.coli Membrane filtration Dilution dependent (3) CFU 100 ml -1 Enterococci Membrane filtration Dilution dependent (3) CFU 100 ml -1 Notes: 1. Numbers in brackets refer to the MAFRL analysis method number. 2. Method detection limit determined from 3.2 x standard deviation of 10 standard samples. 3. The upper and lower detection limits for microbiological indicators are dependent on the dilution of the original sample.
83 Appendix C Comprehensive treated wastewater characterisation results
84
85 Ocean Reef ANZECC/ARMCANZ (2000a) guidelines (μg/l) 1 Parameter TWW Level of protection Low reliability 9 Feb % 95% 90% 80% value (LRV) Microbiological Confirmed Enterococci 660 (MPN/100 ml) 2 Presumptive thermotolerant coliforms (TTC; CFU/100 ml) 4 est Confirmed TTC (CFU/100 est ml) 4 n/a 3 n/a n/a n/a n/a n/a n/a n/a n/a n/a n/a n/a n/a n/a n/a Escherichia coli (CFU/100 ml) est n/a n/a n/a n/a n/a Nutrients (μg/l) Ammonia-N Nitrate-N+Nitrite-N 7600 ID 5 ID ID ID 13,000 Nitrogen-Total N n/a n/a n/a n/a n/a Phosphate-Ortho as P 4600 n/a n/a n/a n/a n/a Phosphorous-Total P 5800 n/a n/a n/a n/a n/a Dissolved (0.45 μm filtered) (μg/l) Arsenic (As) <1 ID ID ID ID 2.3 (As III) 4.5 (As V) Cadmium (Cd) < Chromium (Cr) <1 7.7 (Cr III) 0.14 (Cr VI) 27.4 (Cr III) 4.4 (Cr VI) 48.6 (Cr III) 20 (Cr VI) 90.6 (Cr III) 85 (Cr VI) Copper (Cu) Lead (Pb) < Mercury (Hg) < Nickel (Ni) Selenium (Se) <1 ID ID ID ID 3 Silver (Ag) < Zinc (Zn) Total metals (acid extractable; unfiltered) (μg/l) Arsenic (As) 1 ID ID ID ID (As III) 4.5 (AsV) Cadmium (Cd) < Chromium (Cr) <1 7.7 (Cr III) 0.14 (Cr VI) 27.4 (Cr III) 4.4 (Cr VI) 48.6 (Cr III) 20 (Cr VI) 90.6 (Cr III) 85 (Cr VI) Copper (Cu) Lead (Pb) < Mercury (Hg) < Nickel (Ni) Selenium (Se) 1 ID ID ID ID 3 Silver (Ag) < Zinc (Zn) Triazine herbicides (μg/l) Atrazine <0.1 ID ID ID ID 13 Hexazinone <0.1 ID ID ID ID 75 Metribuzine <0.1 n/a n/a n/a n/a n/a Prometryne <0.1 n/a n/a n/a n/a n/a -
86 Ocean Reef ANZECC/ARMCANZ (2000a) guidelines (μg/l) 1 Parameter TWW Level of protection Low reliability 9 Feb % 95% 90% 80% value (LRV) Simazine <0.1 ID ID ID ID 3.2 Phenoxy acid herbicides (μg/l) Dicamba 6 <1 n/a n/a n/a n/a n/a MCPA <1 ID ID ID ID 1.4 Dichlorprop <1 n/a n/a n/a n/a n/a 2,4-D 1 ID ID ID ID 280 2,4,5-T <1 n/a n/a n/a n/a n/a 2,4,5-TP <1 n/a n/a n/a n/a n/a 2,4-DB <1 n/a n/a n/a n/a n/a MCPP <1 n/a n/a n/a n/a n/a Triclopyr n/a n/a n/a n/a n/a Organophosphate pesticides (μg/l) Azinphos-Methyl <0.1 ID ID ID ID 0.01 Azinphos-Ethyl <0.1 n/a n/a n/a n/a n/a Chlorpyrifos < Chlorfenvinphos (E) <0.1 n/a n/a n/a n/a n/a Chlorfenvinphos (Z) <0.1 n/a n/a n/a n/a n/a Demeton-S-Methyl <0.1 ID ID ID ID 4 Dichlorvos <0.1 n/a n/a n/a n/a n/a Diazinon <0.1 ID ID ID ID 0.01 Dimethoate <0.1 ID ID ID ID 0.15 Ethion <0.1 n/a n/a n/a n/a n/a Fenthion <0.1 n/a n/a n/a n/a n/a Fenitrothion <0.1 ID ID ID ID Malathion <0.1 ID ID ID ID 0.05 Parathion (Ethyl) <0.1 ID ID ID ID Parathion Methyl <0.1 n/a n/a n/a n/a n/a Pirimiphos-Ethyl 8 <0.1 n/a n/a n/a n/a n/a Pirimiphos-Methyl 9 <0.1 n/a n/a n/a n/a n/a Organochlorine pesticides (μg/l) Aldrin <0.001 ID ID ID ID Trans-Chlordane ID ID ID ID Cis-Chlordane 10 <0.001 ID ID ID ID Oxychlordane 10 <0.001 ID ID ID ID Gamma-BHC (Lindane) <0.001 ID ID ID ID alpha-bhc <0.001 n/a n/a n/a n/a n/a beta-bhc <0.001 n/a n/a n/a n/a n/a delta-bhc <0.001 n/a n/a n/a n/a n/a p,p-ddd <0.001 n/a n/a n/a n/a n/a p,p-dde <0.001 ID ID ID ID
87 Ocean Reef ANZECC/ARMCANZ (2000a) guidelines (μg/l) 1 Parameter TWW Level of protection Low reliability 9 Feb % 95% 90% 80% value (LRV) p,p-ddt <0.001 ID ID ID ID Dieldrin <0.001 ID ID ID ID 0.01 Endrin < Endrin Aldehyde <0.001 n/a n/a n/a n/a n/a Endrin ketone <0.001 n/a n/a n/a n/a n/a alpha-endosulfan <0.001 ID ID ID ID beta-endosulfan <0.001 ID ID ID ID Endosulfan Sulfate 11 < HCB (Hexachlorobenzene) <0.001 ID ID ID ID 0.05 Heptachlor <0.001 ID ID ID ID Heptachlor epoxide <0.001 n/a n/a n/a n/a n/a Methoxychlor <0.001 ID ID ID ID Phenol (μg/l) Phenol Nonylphenol ID ID ID ID 1 2-Chorophenol ID ID ID ID Methylphenol n/a n/a n/a n/a n/a 2,4-Dichlorophenol ID ID ID ID Nitrophenol n/a n/a n/a n/a n/a 4-Chloro-3-methylphenol n/a n/a n/a n/a 2 2,4,6-Trichlorophenol ID ID ID ID 34 4-Nitrophenol ID ID ID ID 2 2,4,5-Trichlorophenol n/a n/a n/a n/a n/a 2,3,4,6-Trichlorophenol ID ID ID ID 10 Pentachlorophenol (PCP) Phthalates (μg/l) Dimethyl phthalate <10 ID ID ID ID 3700 Diethyl phthalate <10 ID ID ID ID 900 Di-n-butyl phthalate <10 ID ID ID ID 25 Butyl benzyl phthalate <10 n/a n/a n/a n/a n/a Bis(2-ethylhexyl) phthalate <20 ID ID ID ID 1 PCB aroclors Aroclor 1016 <0.1 ID ID ID ID Aroclor 1221 <0.1 ID ID ID ID 1 Aroclor 1232 <0.1 ID ID ID ID 0.3 Aroclor 1242 <0.1 ID ID ID ID 0.3 Aroclor 1248 <0.1 ID ID ID ID 0.03 Aroclor 1254 <0.1 ID ID ID ID 0.01 Aroclor 1260 <0.1 ID ID ID ID n/a Total PCB s (as above) 12 <0.1 ID ID ID ID n/a
88 Ocean Reef ANZECC/ARMCANZ (2000a) guidelines (μg/l) 1 Parameter TWW Level of protection Low reliability 9 Feb % 95% 90% 80% value (LRV) Chlorinated hydrocarbons (μg/l) 2-Chloronaphthalene n/a n/a n/a n/a n/a 1,4-Dichlorobenzene ID ID ID ID 60 1,2-Dichlorobenzene ID ID ID ID 160 1,3-Dichlorobenzene ID ID ID ID 260 Hexachlorobenzene ID ID ID ID ,2,4-Trichlorobenzene Hexachloroethane ID ID ID ID 290 Hexachlorocyclopentadiene ID ID ID ID 0.05 Hexachloro-1,3-butadiene 13 ID ID ID ID 0.03 Ethers (μg/l) 4-Bromophenyl phenyl ether 14 n/a n/a n/a n/a n/a 4-Chlorophenyl phenyl ether n/a n/a n/a n/a n/a Bis(2-chloroethyl)ether n/a n/a n/a n/a n/a Bis(2-chloroethoxy)methane n/a n/a n/a n/a n/a Bis(2-chloroisopropyl)ether n/a n/a n/a n/a n/a Amines, nitroaromatics nitrosamines (μg/l) Azobenzene n/a n/a n/a n/a n/a 2,4-Dinitrotoluene ID ID ID ID 16 2,6-Dinitrotoluene n/a n/a n/a n/a 0.3 Nitrobenzene ID ID ID ID 550 N-Nitrosodimethylamine n/a n/a n/a n/a n/a N-Nitrosodiphenylamine ID ID ID ID 6 N-Nitrosodi-n-propylamine n/a n/a n/a n/a n/a Aniline ID ID ID ID 8 4-Chloroaniline n/a n/a n/a n/a n/a 2-Nitroaniline n/a n/a n/a n/a n/a 3-Nitroaniline n/a n/a n/a n/a n/a 4-Nitroaniline n/a n/a n/a n/a n/a Other organics (μg/l) Dichlorobenzidine 15 ID ID ID ID Methylnaphthalene n/a n/a n/a n/a n/a Isophorone ID ID ID ID 130 Benzyl alcohol n/a n/a n/a n/a n/a Carbazole n/a n/a n/a n/a n/a Dibenzofuran n/a n/a n/a n/a n/a BTEX (μg/l) Benzene < Toluene <1.0 ID ID ID ID 180 Ethylbenzene <1.0 ID ID ID ID 5
89 Ocean Reef ANZECC/ARMCANZ (2000a) guidelines (μg/l) 1 Parameter TWW Level of protection Low reliability 9 Feb % 95% 90% 80% value (LRV) Xylene 16 <2.0 ID ID ID ID 75 Total BTEX 12 <5.0 n/a n/a n/a n/a n/a Total petroleum hydrocarbons (TPH) (μg/l) TPH C6 - C9 17 <25 ID ID ID ID n/a TPH C10 - C14 17 <25 ID ID ID ID n/a TPH C15 - C28 17 <100 ID ID ID ID n/a TPH C29 - C36 17 <100 ID ID ID ID n/a Total TPH 17,18 <250 ID ID ID ID n/a Poly aromatic hydrocarbons (PAHs) (μg/l) Naphthalene < Acenaphthylene <0.01 n/a n/a n/a n/a n/a Acenaphthene <0.01 n/a n/a n/a n/a n/a Fluorene <0.01 n/a n/a n/a n/a n/a Phenanthrene <0.01 ID ID ID ID 2 Anthracene <0.01 ID ID ID ID 0.4 Fluoranthene <0.01 ID ID ID ID 1.4 Pyrene <0.01 n/a n/a n/a n/a n/a Benz(a)anthracene <0.01 n/a n/a n/a n/a n/a Chrysene <0.01 n/a n/a n/a n/a n/a Benzo(b,k)fluoranthene <0.02 n/a n/a n/a n/a n/a Benzo(a)pyrene <0.01 n/a n/a n/a n/a n/a Indeno(1,2,3-cd)pyrene <0.01 n/a n/a n/a n/a n/a Dibenz(a,h)anthracene <0.01 n/a n/a n/a n/a n/a Benzo(g,h,i)perylene < Surfactants (mg/l) Methylene blue active substances (MBAS) n/a n/a n/a n/a n/a Miscellaneous other (mg/l unless indicated) Chlorine-Free <0.01 ID ID ID ID 3 Chlorine-Total <0.01 ID ID ID ID 3 Dissolved Organic Carbon (DOC) 12 n/a n/a n/a n/a n/a Total Organic Carbon (TOC) 13 n/a n/a n/a n/a n/a Total Suspended Solids (TSS) 20 8 n/a n/a n/a n/a n/a Biological Oxygen Demand (BOD) <5 n/a n/a n/a n/a n/a ph n/a n/a n/a n/a n/a Notes: 1. The trigger values for marine waters are from Table in ANZECC/ARMCANZ (2000a). The EPA has provided advice that in WA waters where a high level of protection applies, that the 99% species protection levels should be used, with the exception of cobalt, where the 95% species protection levels is used. Grey bold text represents the relevant ANZECC/ARMCANZ (2000a) guideline values and amber bold text represents an exceedance of ANZECC/ARMCANZ (2000a) guideline values prior to initial dilution. 2. Primary and secondary contact guideline for recreational marine waters are 35 and 230 Enterococci organisms/100 ml, respectively (ANZECC/ARMCANZ 2000a). 3. n/a = ANZECC/ARMCANZ (2000a) guideline or LRV not available for this parameter.
90 4. Primary and secondary contact guidelines for recreational marine waters 150 and 1000 faecal coliforms/100 ml (ANZECC/ARMCANZ 2000a), respectively. 5. ID = insufficient data to derive a reliable national trigger value. 6. Recreational guideline for Dicamba = 300 μg L -1 (Table 5.2.4; ANZECC/ARMCANZ 2000a). 7. Recreational guideline for Triclopyr = 20 μg L -1 (Table 5.2.4; ANZECC/ARMCANZ 2000a). 8. Recreational guideline for Pirimiphos-ethyl = 1 μg L -1 (Table 5.2.4; ANZECC/ARMCANZ 2000a). 9. Recreational guideline for Pirimiphos-methyl = 60 μg L -1 (Table 5.2.4; ANZECC/ARMCANZ 2000a). 10. Guideline values are for total chlordane though cis-chlordane is around 7 times more toxic than transchlordane (ANZECC/ARMCANZ 2000a). 11. Values for Endosulphan, not Endosulphan sulfate (Table 3.4.1; ANZECC/ARMCANZ 2000a). 12. ANZECC/ARMCANZ (2000b) recommends using a formula to calculate total toxicity of the mixture if using total PCBs and BTEX (page ; ANZECC/ARMCANZ 2000b). 13. Environmental Concern Level (ECL) for Hexachloro-1,3-butadiene (not LRV) (definition of ECL on page ; page ; ANZECC/ARMCANZ 2000b). 14. Recommended ECL for 4-Bromophenyl phenyl ether = 12 μg L -1 (page ; ANZECC/ARMCANZ 2000b). 15. ECL for Dichlorobenzidine (not LRV) (page ; ANZECC/ARMCANZ 2000b). 16. Guideline for o-xylene = 350 μg/l, for m-xylene = 75 μg/l and for p-xylene = 200 μg L -1 (ANZECC/ARMZANC 2000a). 17. Guideline values are for generic oils and petroleum hydrocarbons (Table 3.4.1; ANZECC/ARMCANZ 2000a). 18. A generic estimate of 7 μg/l for a total petroleum hydrocarbon chronic value has been estimated using USEPA methods (page ; ANZECC/ARMCANZ 2000b). 19. Recreational guideline for MBAS = 0.2 mg/l (ANZECC/ARMCANZ 2000a). 20. Suspended solids guidelines for the protection of saltwater aquaculture species = <10,000 μg/l (Table 4.4.2; ANZECC/ARMCANZ 2000a). 21. ph guideline range for slightly disturbed inshore marine ecosystems in south-west Australia = 8.0 to 8.4 (Table 3.3.6; ANZECC/ARMCANZ 2000a). References ANZECC/ARMCANZ (2000a) National Water Quality Management Strategy: Paper No 4 Australian and New Zealand Guidelines for Fresh and Marine Water Quality. Volume 1 The Guidelines (Chapters 1-7). Australian and New Zealand Environment and Conservation Council and Agriculture and Resource Management Council of Australia and New Zealand, Canberra, Australian Capital Territory, October 2000 ANZECC/ARMCANZ (2000b) National Water Quality Management Strategy: Paper No 4 Australian and New Zealand Guidelines for Fresh and Marine Water Quality. Volume 2 Aquatic Ecosystems Rationale and Background Information (Chapter 8). Australian and New Zealand Environment and Conservation Council and Agriculture and Resource Management Council of Australia and New Zealand, Canberra, Australian Capital Territory, October 2000
91 Appendix D Initial dilution output
92

93 Ocean Reef A
94 Ocean Reef B
95 Appendix F Detailed methodologies
96
97 1. Maintenance of Ecosystem Integrity 1.1 Environmental Quality Objective The EQO for the EV Ecosystem Health is aimed at maintaining ecosystem integrity and biodiversity, thereby ensuring the continued health and productivity of Perth s coastal waters (EPA 2015). There are two areas of ecological protection surrounding the Ocean Reef ocean outlets; a high ecological protection area (HEPA) and a notional low ecological protection area (LEPA). The notional LEPA includes waters within a 100 m radius around the diffuser; waters outside this zone are managed as a HEPA (Figure 1.1). A comprehensive suite of contaminants are monitored in the TWW prior to discharge (i.e. in the undiluted TWW stream), as well as a subset of contaminants within the receiving environment (i.e. in the diluted TWW plume). Monitoring against trial EQC involves: toxicants in TWW metals and pesticides in marine biota receiving water physical-chemical measures receiving water direct biological measures. Figure 1.1 Ocean Reef ocean outlets notional ecological protection boundaries
98 1.2 Toxicants in treated wastewater Toxicants in TWW are assessed using four trial EQG triggers that are evaluated annually for: bioaccumulating toxicants in the undiluted TWW stream (EQG 1) non-bioaccumulating toxicants at the notional LEPA boundary (EQG 2) total toxicity of the mixture (TTM) for key contaminants (ammonia, copper and zinc) at the notional LEPA boundary (EQG 3) WET testing using various dilution levels of the TWW stream (EQG 4). Every three years, the EQS for bioaccumulating toxicants is also tested via sentinel mussel monitoring, irrespective of whether the EQG has been exceeded Comprehensive treated wastewater characterisation TWW (final effluent) from the Beenyup WWTP is analysed for a suite of parameters comprising the major contaminants of concern for the Ocean Reef ocean outlets: nutrients (total nitrogen, ammonia, nitrate+nitrite, total phosphorus, orthophosphate) microbiological contaminants bioavailable metals (arsenic, cadmium, chromium, copper, lead, mercury, nickel, selenium, silver and zinc) pesticides and herbicides (organophosphate pesticides, organochlorine pesticides, triazine herbicides) polyaromatic hydrocarbons phthalates polychlorinated biphenyls benzene, toluene, ethylbenzene, and xylenes petroleum hydrocarbons surfactants dissolved organic carbon. A 24-hour flow-weighted composite sample is obtained from the Beenyup WWTP on the same date as the ASWQS (refer BMT Oceanica 2015). This sample represents an average of the final treated effluent discharged from the Beenyup WWTP for the 24 hours prior to and during the sample collection. The bulk sample is homogenised (agitated), split into separate sample containers for the various analyte groups and handled according to the National Association of Testing Authorities (NATA)-accredited laboratory requirements for those analytes. Samples for bioavailable metals are passed through a 0.45 μm filter prior to analysis, in accordance with Environmental Protection Authority (EPA) prescribed methods (EPA 2005a). Analyses are completed by laboratories with NATA-accredited methods, and the results are compared against ANZECC/ARMCANZ (2000) species protection guideline levels. Initial dilution modelling Initial dilution modelling for the ambient conditions and TWW flows at the time of TCM was done using the VPLUMES initial dilution model (refer to BMT Oceanica (2015) for details). The VPLUMES model is accepted for use by the United States Environmental Protection Agency ( and captures simple features concerning the surrounding environment such as depth at point of discharge, net current and wind speed. VPLUMES is designed to predict the near-field behaviour of wastewater effluent plumes in the region where the plume first jets into the surrounding waters and then, in the case of positively buoyant plumes, rises and mixes with the surrounding waters (generally <10 m from the diffusers). Additional dilution is expected between the point that the plume reaches the surface and the notional LEPA boundary. Although initial dilution therefore underestimates the dilution at the notional LEPA boundary, it is favoured as it represents a highly conservative approach.
99 Total toxicity of the mixture The total toxicity of the mixture (TTM) calculation is an additional interpretative tool used for estimating the potential toxicity of TWW, and is used to evaluate EQG 3 for toxicants in TWW. The potential for cumulative toxic effects on marine organisms is assessed as per the ANZECC/ARMCANZ (2000) guidelines based on the effects of ammonia, copper and zinc (after initial dilution of the TWW with seawater), the three contaminants of concern most likely to exceed their respective guidelines. Total Toxicity of Mixture = [ammonia] [copper] [zinc] + + [Trigger Value] [Trigger Value] [Trigger Value] The TTM must be <1 to meet the total toxicity criteria, in accordance with ANZECC/ARMCANZ (2000) guidelines. The initial mixing zone dilution calculated in the ASWQS (see above) is applied Whole of effluent toxicity (WET) testing To meet the fourth EQG for TWW toxicants, quarterly WET testing is used to establish whether the TWW stream is toxic to marine biota. WET testing is particularly useful in the absence of reliable guidelines for toxicants that occur in low concentrations, or where the toxicity effects of contaminants are poorly understood. For example, the detection limits for pesticide analysis presently attainable by commercial laboratories in Australia are sometimes higher than the ANZECC/ARMCANZ (2000) guidelines. WET testing involves exposing sea urchins (Heliocidaris tuberculata) to different concentrations of TWW effluent for ~1 hour and then measuring fertilisation success. This test has been chosen for its fast analytical turn-around time and the sea urchins' sensitivity to contaminants in TWW. The test results are used to calculate the NOEC (highest concentration where no significant effect is observed), LOEC (lowest concentration where a significant effect is observed) and the EC50 (the concentration of TWW causing 50% inhibition fertilisation rate). In some circumstances, sea urchin WET test results may act as a trigger for a full suite of WET testing. This is an additional series of WET tests incorporating a suite of marine organisms from a variety of trophic levels. To trigger the full suite of WET tests, the NOEC must be 1.0% (equivalent to more than a 100-fold dilution). All WET tests were carried out by NATA-accredited Ecotox Services Australasia Pty Ltd (Ecotox), Sydney, New South Wales. Twenty-four hour flow-weighted composite samples were collected quarterly (July 2014, October 2014, January 2015, April 2015) from the Beenyup WWTP, using containers supplied by Ecotox. The test dilutions of TWW used were 1.0, 1.6, 3.1, 6.3, 12.5, 25, 50 and 100%. All TWW dilutions were saltadjusted (using artificial sea salts) to achieve marine salinities, so that only the toxicity due to the presence of contaminants was examined, not the toxic effect of freshwater on the marine organism. Testing was also undertaken on a seawater control, and an artificial sea salt (brine) control. 1.3 Water quality monitoring receiving environment Water quality was monitored approximately fortnightly from the beginning of December to the end of March, coinciding with the non-river flow period. The program collects data for comparison with the trial EQC for nutrients, phytoplankton biomass and physical and chemical stressors. On each sampling occasion, a surface drogue was deployed over the centre of the ocean outlet diffuser and retrieved ~30 min later. The drift direction of the drogue was used to provide a directional vector and samples were collected at five compliance sites located at intervals of 0, 100, 350, 1000, and 1500 m along that vector down-current of the outlets (Figure 1.2). Samples were also collected at four reference sites.
100 A composite sample representative of the top half of the water column, was collected from each site for analysis of chlorophyll-a and nutrients. Chlorophyll-a was measured using material retained on GF/C filters through which 1 5 L of water was passed. Water samples for inorganic nutrient analysis were passed through a 0.45 μm GF/C filter. All samples were immediately placed on ice before being transported to the laboratory for analysis. Samples were analysed at Murdoch University's Marine and Freshwater Laboratory using standard laboratory analytical procedures undertaken according to NATA-accredited methods. At each of the sites the following physio-chemical parameters were measured in situ using a YSI 6600/YSI 600XL water quality sensor or LiCor Model LI 1000 light meter: dissolved oxygen (DO) depth profile salinity depth profile irradiance temperature depth profile (for contextual purposes). Irradiance measurements are obtained with one sensor positioned 1 m below the surface and a second sensor 7 m below the surface and the light attenuation coefficient (LAC) calculated as follows: LAC = [log 10 (irradiance at depth) log 10 (irradiance at surface)/depth interval (in metres)] 1 The extent to which the EQG were met was assessed using data collected at distances 100 m from the ocean outlets. Sites positioned at distances >100 m from the diffuser are considered to lie within the HEPA. Any data collected inside the 100 m radius (notional LEPA) are presented for contextual purposes only. 1 Base 10 logs have been specified as they are generally the basis for environmental quality criteria favoured by the Office of the EPA.

101 Figure 1.2 Conceptual diagram of the Trial Compliance Monitoring program showing hypothetical compliance sites and their relative distances from the outlet diffusers
102 2. Maintenance of Seafood for Human Consumption 2.1 Environmental Quality Objective The EQO for the EV 'Fishing and Aquaculture' is aimed at ensuring seafood is safe for human consumption. To ensure the EQO is being met, microbiological contaminants and algal (phytoplankton) biotoxins are monitored as part of the PLOOM TCM program and the PLOOM ASWQS. Ministerial Conditions placed on the operation of the Beenyup WWTP by the EPA also require that a survey of metals and pesticides in marine biota be undertaken every three years (the most recent survey was in summer , and reported in BMT Oceanica (2013)). The EQO, Maintenance of Seafood Safe for Human Consumption, is primarily concerned with the harvesting and consumption of raw shellfish (i.e. filter-feeding bivalve molluscs such as oysters, mussels, clams, pipis, scallops, cockles, and razor clams) and not other forms of seafood. Human health concerns relating to consumption of shellfish are not considered an issue at Ocean Reef as there is no aquaculture within 250 m of the diffuser and no known harvesting of shellfish in the waters 1 3 km offshore. The Department of Health (DoH) discourages the public from taking wild shellfish, recommending instead that shellfish are only consumed if harvested commercially and under a strict monitoring program. The DoH has further indicated that it is impossible to guarantee the safety of eating wild shellfish without having a comprehensive monitoring program that tests the waterway concerned for harmful microorganisms and toxins and has formally advised the Department of Environment and Conservation 2 that, in the absence of a full monitoring program, the application of the TTC criteria (EPA 2005b) is insufficient to protect those who wish to collect and eat wild shellfish. 2.2 Microbiological contaminants and algal biotoxins The accepted method for determining whether the relevant EQC for maintenance of seafood for human consumption have been met is to monitor microbiological contaminants (measured as concentrations of thermotolerant coliforms (TTC)) and algal biotoxins (measured as concentrations of phytoplankton species) at the boundary of a pre-designated management zone. Such an approach has been developed for the ocean outlets at Sepia Depression (BMT Oceanica 2014a) and Alkimos (Oceanica 2011b). Many disease-causing organisms are transferred from human and animal faeces to water via sewage effluent, from where they can be ingested by marine fauna and infect them, adversely affecting their suitability for human consumption. TTC are one such bacteria that primarily originate in the intestines of warm-blooded animals. By testing for TTC, it can be determined whether the ocean water around Ocean Reef has potentially been exposed to faecal contamination. Nutrient enrichment as a result of TWW discharge could result in changes to the naturally occurring planktonic algal community. Although most algal blooms are considered harmless, some may contain species that produce toxins that have a potentially harmful effect on the surrounding marine environment. Species such as Heterosigma akashiwo and Cryptosporidium parvum are two such algae that cause fish mortalities. As formal management zones have yet to be established for the Ocean Reef ocean outlets, sampling for the EQO Seafood for Human Consumption was undertaken at a series of fixed monitoring sites located at the boundary of an 'observed zone of influence' (OZI; Figure 2.1). The OZI was derived from ten years of monitoring data collected at Ocean Reef. Data collected at the boundaries of the OZI are used in the assessment of the EQC. The OZI allow direct comparison with outlets where similar zones have been adopted as a requirement (i.e. Alkimos and Sepia Depression). Samples were collected approximately fortnightly during the non-river flow period at five fixed sites located on the boundary of the OZI immediately down-current of the 2 Now known as Department of Environment Regulation.
103 diffusers, with site selection based on the water current direction as indicated by the drogue (Figure 2.1, Figure 2.2). Composite water samples representative of the top half of the water column were collected and analysed for TTC and phytoplankton species. For TTC, samples were collected in pre-sterilised bottles before being chilled in the dark to 4 C. Samples were subsequently transferred to PathWest Laboratories and analysed according to NATA-accredited methods. For phytoplankton, samples were preserved in Lugol s iodine solution and transported to Dalcon Environmental Laboratories for phytoplankton identification using the Utermöhl method. Phytoplankton were identified to the lowest taxonomic level possible. On each sampling date only one sample (i.e. in the direct path of the drogue) was analysed and the remaining four samples archived. In the event that toxic phytoplankton species are present at concentrations that exceed the recommended WASQAP guideline concentrations (DoF 2007), the full set of archived samples collected on that sampling occasion are also analysed (Table 2.1).
104 Notes: 1. Sites are located on the boundary of the observed zone of influence (OZI). Figure 2.1 Fixed sites around the Ocean Reef outlet sampled for thermotolerant coliforms, Enterococci spp. and algal (phytoplankton) toxins during periods with northerly, easterly, westerly and southerly currents

105 Notes: 1. Sites are located on the boundary of the observed zone of influence (OZI). Figure 2.2 Fixed sites around the Ocean Reef outlet sampled for thermotolerant coliforms, Enterococci spp. and algal (phytoplankton) toxins during periods with north-easterly, south-easterly, north-westerly and southwesterly currents
106 Table 2.1 Protocols for analysis of archived phytoplankton samples Outcome of initial analysis No exceedance of WASQAP 1 guideline concentrations Exceedance of WASQAP guideline concentrations at both the reference site and the TCM 2 site Exceedance of WASQAP guideline concentrations at the reference site, but not at the TCM site Further action No analysis of archived samples No analysis of archived samples No analysis of archived samples Exceedance of WASQAP guideline concentrations at the TCM site but not at the reference site Additional samples analysed Notes: 1. Western Australian Shellfish Quality Assurance Program, DoF (2007). 2. Trial Compliance Monitoring.
107 3. Maintenance of Primary and Secondary Contact Recreation 3.1 Environmental Quality Objective The EQOs for the EV 'Recreation and Aesthetics' are aimed at ensuring Perth s coastal waters are safe for primary and secondary contact recreation activities such as swimming and boating. To meet this objective, water quality around the Ocean Reef outlets is to be maintained so that: primary contact recreation (e.g. swimming) is safe in all waters except areas designated otherwise secondary contact recreation (e.g. boating) is safe in all waters except areas designated otherwise. A formal area where contact recreation is not recommended has not been established for the area surrounding the Ocean Reef outlets. Sampling for this EQO was therefore undertaken at a series of fixed monitoring sites located at the boundary of the OZI, as described in Section 2.2. As the maintenance of primary contact recreation EQO requires a higher water quality standard to be maintained than secondary contact recreation EQO, by default, it is assumed that if primary contact recreation EQSs are met, secondary contact recreation EQSs will also be achieved. 3.2 Microbiological contaminants and algal biotoxins The accepted method for determining whether the EQC for primary and secondary contact recreation have been met is to monitor microbiological contaminants (measured as numbers of faecal streptococci) and algal toxins (measured as numbers of phytoplankton cells) at the boundary of a pre-designated management zone. Such an approach has been developed for the ocean outlets at Sepia Depression and Alkimos. Disease-causing microorganisms (pathogens) associated with bathing areas include salmonellae, shigellae, enteropathogenic Escherichia coli, cysts of Entamoeba histolytica, parasite ova, enteroviruses and infectious hepatitis (Hart 1974, McNeill 1985; cited in ANZECC/ARMCANZ 2000). The most common types of diseases associated with waterborne pathogens are eye, ear, nose and throat infections, skin diseases and gastrointestinal disorders (ANZECC/ARMCANZ 2000). Detecting faecal pathogens within routine water samples is difficult and often indicator micro-organisms (such as Enterococci spp.) are used to assess the health risks associated with pathogens in recreational waters (Elliot & Colwell 1985; cited in ANZECC/ARMCANZ 2000). Algal blooms can be harmful to human/animal health if encountered via ingestion or skin contact. For this reason, phytoplankton cell concentrations are monitored in the TCM program to ensure concentrations are within acceptable guidelines limits (EPA 2005b). Microbial contaminants were sampled for approximately fortnightly at a series of fixed monitoring sites on the OZI boundary (refer Section 2.2, Figure 2.1 and Figure 2.2). Samples were collected during the non-river flow period at five fixed sites located immediately down-current of the diffusers, with site selection based on the water current direction as indicated by the drogue. Composite water samples representative of the top half of the water column were collected for faecal streptococci (Enterococci spp.) and phytoplankton cell concentrations. Enterococci spp. samples were collected in pre-sterilised bottles before being chilled to 4 C and placed in the dark. On completion of sampling, the samples were transferred to PathWest laboratories and analysed according to NATA-accredited methods). For phytoplankton, samples were collected, preserved and analysed in the manner described in Section 2.2.
108
109 Appendix I Site locations and coordinates
110
111 Site Coordinates Ocean Reef trial compliance monitoring (TCM) reference and seasonal monitoring site location details and water quality parameters measured at the different sites Site Code Location with Respect to Outlet Parameters Measured Easting Northing Intensive Summer Water Quality ( Trial Compliance ) Monitoring Reference Site 4,000 m ORR1 south Reference Site 4,000 m ORR2 south Reference Site 4,000 m ORR3 south Reference Site 4,000 m ORR4 south Datum: UTM WGS84 Zone 50 Nutrients; Phytoplankton; Water column profiles Nutrients; Phytoplankton; Water column profiles Nutrients; Phytoplankton; Water column profiles Nutrients; Phytoplankton; Water column profiles
112 Ocean Reef trial compliance monitoring (TCM) sites and their relative distances from the outlet diffuser Date Site code - distance from outlet diffuser Easting Northing ORT ORT /12/2015 ORT ORT ORT ORT ORT /12/2015 ORT ORT ORT ORT ORT /01/2016 ORT ORT ORT ORT ORT /01/2016 ORT ORT ORT ORT ORT /02/2016 ORT ORT ORT ORT ORT /02/2016 ORT ORT ORT ORT ORT /03/2016 ORT ORT ORT ORT ORT /03/2016 ORT ORT ORT Datum: UTM WGS84 Zone 50 Notes: 1. The location of TCM potential impact sites are determined based on the direction of the surface current on the sampling day
113 Ocean Reef microbial and phytoplankton monitoring sites at the boundary of the observed zone of influence for contact recreation (1-16) and human consumption (17-32) Site Easting Northing OR OR OR OR OR OR OR OR OR OR OR OR OR OR OR OR OR OR OR OR OR OR OR OR OR OR OR OR OR OR OR OR Datum: UTM WGS84 Zone 50

114 Note: On each sampling occasion, samples are collected down-current of the diffuser at a sub-set of five fixed monitoring sites located at the observed zone of influence boundary. The sites are selected based on the water current direction as indicated by a drogue release. Fixed sites around the Ocean Reef ocean outlets sampled for thermotolerant coliforms, Enterococci spp. and algal (phytoplankton) toxins in relation to the observed zone of influence