Energy Optimization for WWTPs Saving Green by Going Green
|
|
|
- Everett Phillips
- 5 years ago
- Views:
Transcription


1 Energy Optimization for WWTPs Saving Green by Going Green July 27, 2012 Tina Hanson P.E, Bryan Lisk P.E., CEM
2 Agenda Energy optimization approach for water and wastewater treatment facilities Demand management and utility billing rates Process optimization Biogas utilization 2
3 The Perfect Storm Energy costs are rising Rising treatment regulations Economy influence Social and environmental influences Carbon emissions Air Quality Standards Federal and state energy policies Renewable energy portfolio standards Texas State Legislature SB898
4 $/MMBTU Projected Energy Prices Energy Costs are Rising 30 Projected Industrial Energy Prices: Electric, Liquid Fuel, and Natural Gas (Source: EIA Annual Energy Outlook 2011) Elec Reference Elec High growth Elec Low growth NG Reference NG High growth NG Low growth Liquid Fuel Reference Liquid Fuel High growth Liquid Fuel Low growth
5 5 Managing Energy
6 Energy management falls into 3 basic categories 1. Energy generation/recovery Biogas utilization (CHP) Alternative energy (Solar, geothermal, etc..) Nutrient recovery 2. Energy efficiency: Process optimization Energy efficient equipment 3. Demand Management Coordinate with purchased energy rate structures Potential for Low or No cost
7 Managing energy begins with an energy management program Moderate to Low Benefit Potential Low Capital Costs High Benefit Potential Moderate to High Capital Costs High Benefit Potential Low Capital Costs Energy management program Lighting HVAC/Building Improvements Alternative Energy Utilization Process Upgrades Energy Efficient Equipment Demand Management Process Optimization Energy Modeling and Benchmarking Understand Purchased Energy Billing Rates Understand Current and Future Energy Costs Power Monitoring and Plant Control Capabilities
8 Energy Management is a Continuous Process Energy Auditing Education & Training Implement Monitor & Verify Energy Management Program
9 Demand Management
10 Electrical utility bills are typically comprised of several charges. Facility Charge Usually a fixed charge independent of demand or usage. Utility cost recovery for utility owned equipment. Demand Charge (kw) Used by utilities to recover cost associated with the capital facilities required to generate and provide electrical service. Typically average demand across a short period (e.g., 15-minutes, 30-minutes). Energy Usage Charge (kwh) Actual energy consumed during the billing period. Typically Flat Rate or Time of Use.

11 The demand profile establishes both demand and energy usage.
12 Demand (KW) Demand ratchets can significantly impact electrical utility cost. 80% Annual Demand Ratchet Example

13 When and How Much energy used determines energy costs Off-Peak 5.2 /KWH on-peak 15.6 /KWH Off-Peak 5.2 /KWH Start Dewatering Int-Peak 7.9 /KWH Int-Peak 7.9 /KWH
14 0:30 1:30 2:30 3:30 4:30 5:30 6:30 7:30 8:30 9:30 10:30 11:30 12:30 13:30 14:30 15:30 16:30 17:30 18:30 19:30 20:30 21:30 22:30 23:30 Demand (KW) When and How Much energy used determines energy costs Stop Electric Blowers and Start Engine Blowers SDWRF Average Demand Profile Summer Months On-Peak Period Average On-Peak Demand 437kW Problem: Stopping electric blowers after On-Peak period began. ~$40,000 in excess demand charges Average Weekday ( kw )
15 Common Process Optimization Opportunities 15
16 Secondary process accounts for most of a plant s energy usage Aeration 60% Clarifiers 3% Return Sludge Pumping 1% Grit 1% Screens 1% Gravity Thickening 1% Wastewater Pumping 12% 16 Anaerobic Digestion 11% Belt Press 3% Chlorination 1% Lighting and Buildings 6%
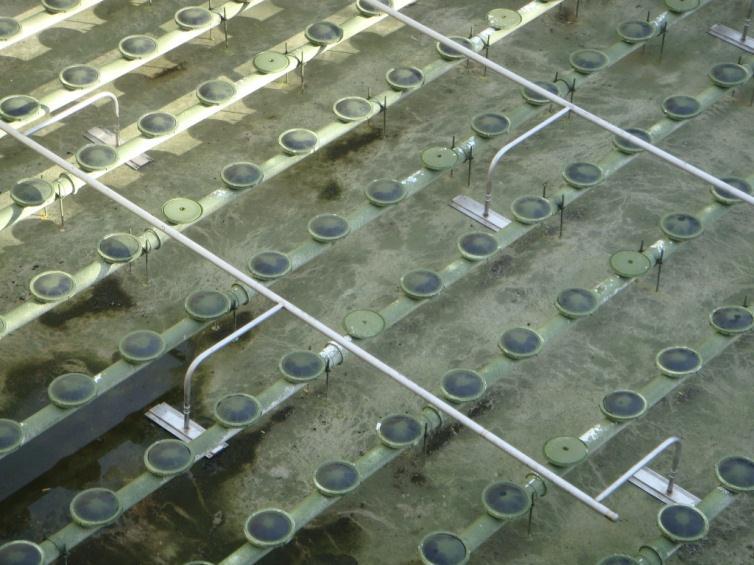
17 Common secondary process energy saving opportunities Excessive operating units (too many tanks online) DO control (excessively high DO) Blower turndown limitations Over mixing Diffuser fouling Inefficient aeration equipment Primary clarifier efficiency
18 Estimated Average Airflow Requirement (scfm) Oxygen transfer efficiency decreases as DO increases 20,000 18,000 16,000 14,000 12,000 10,000 8,000 6,000 4,000 2, Average DO Concentration (mg/l) Airflow at 20 C Airflow at 26 C
19 South Durham DO Control Case Study Problem Poor DO control using one air control valve for a pair of aeration tanks Solution Zone DO control. Two zones per tank Capital cost - ~$500,000 Annual savings - ~$100,000 - $120,000 Simple Payback 5 years Recommendation Implement Zone DO control 19
20 Estimated Aeration Demand (SCFM) Blower Demand (HP) South Durham DO Control Case Study SDWRF Estimated Summer Months Weekday Aeration Demand (SCFM) 20, , ,000 14,000 12,000 10,000 8,000 Current operation Savings Opportunity Elec - $50,000 Nat. Gas - $70, ,000 Optimized operation 300 4,000 12:00 AM 2:00 AM 4:00 AM 6:00 AM 8:00 AM 10:00 AM 12:00 PM 2:00 PM 4:00 PM 6:00 PM 8:00 PM 10:00 PM 200
21 Aeration equipment can impact energy efficiency Aerator technologies oxygen transfer efficiencies Aerator Type SAE lbo2/hp-hr AE at 2 mg/l DO lbo2/hp-hr Surface Aerators Coarse Bubble Fine Bubble Conversion to fine bubble is not always cost effective. Have to make an economic case to change to fine bubble from surface aerators Cost of energy impacts economic case
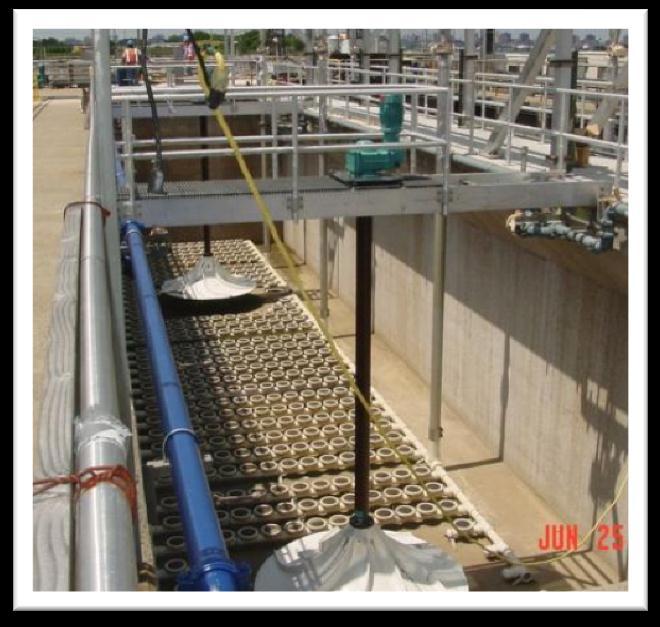
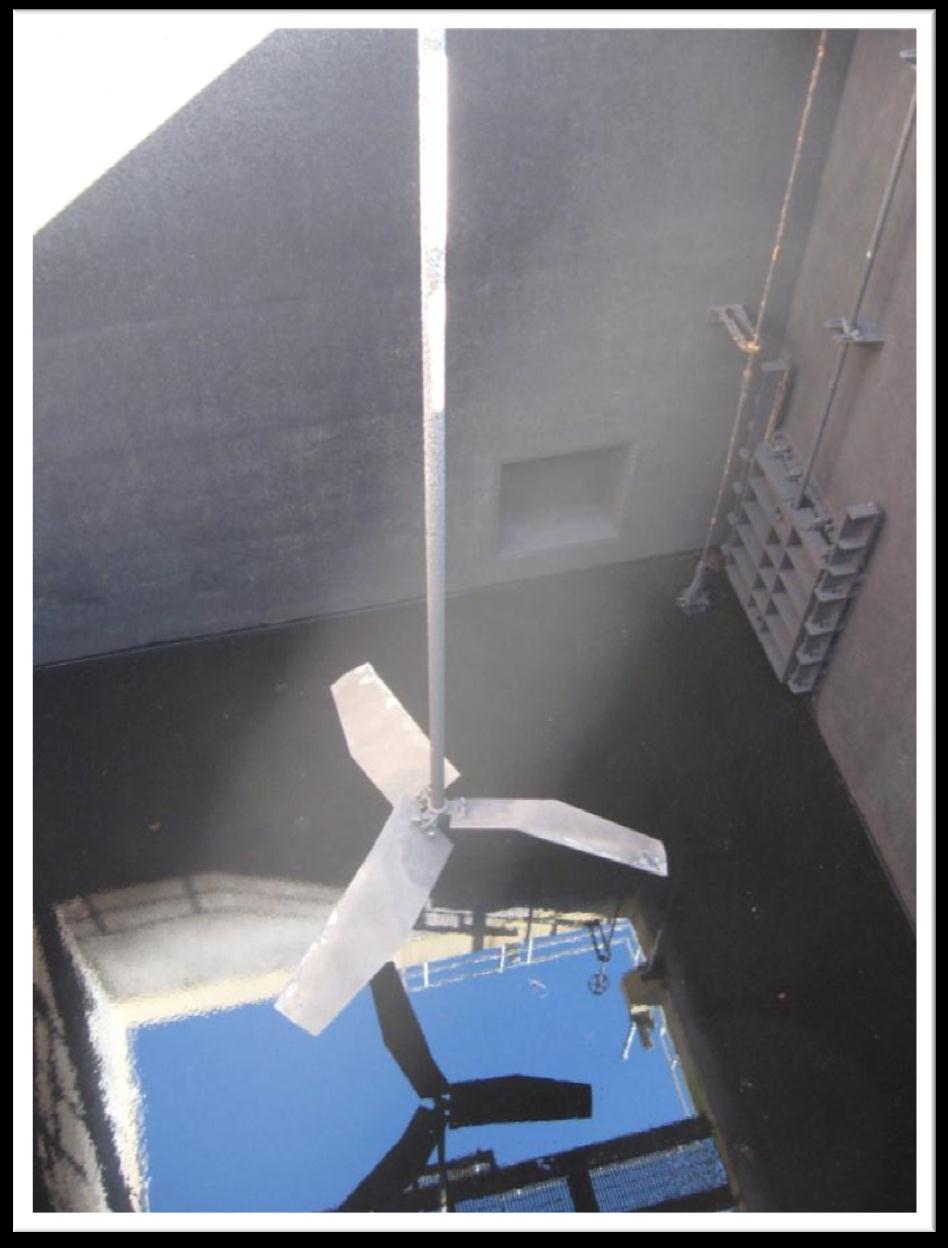
22 Mixer Technologies
23 Mixing Energy Nutrient limits require unaerated zones requiring separate mixing Significant power running 24/7, full speed Typical power input is 0.3 to 0.4 hp/1000 ft3 High efficiency mixers with optimal zone geometry/configuration can significantly reduce power requirements Potential to reduce power to 1/2 to 1/3 of text book numbers

 0.40 0.30 0.")

24 HP PER 1000CFT Mixing Energy MIXING ENERGY (HP/1000CFT) JET MIXING TURBINE/HYPERBOLOID MIXERS BIG BUBBLE MIXING
25 Mixing Optimization Example - South Durham WRF 25 Problem Energy intensive mixing technology (0.5hp/1000cf) Solution Platform or Big bubble mixing technology (0.15hp/1000cf) Capital cost - ~$800,000 Annual savings - ~$50,000 Payback 20 years (5% interest) Recommendation Upgrade mixing at the end of the existing equipment s useful life.
26 26 Energy Generation/Recovery
27 Biogas is the most common resource recovered Digester heating (most common) Energy generation Building heating and cooling Can be sold to natural gas companies or to energy developers Considered a renewable energy source 27


28 Conventional digester gas utilization equipment Digester Heating Boilers Digester Gas Flares Digester Heating Heat Exchanger
 ~40% of LHV ~35% of")
29 Biogas can be used to fuel Combined Heat and Power systems (CHP) ~40% of LHV ~35% of LHV
30 Biogas and CHP rules of thumb Primary sludge plants typically support 15-25kW per MG treated 1lb of solids destruction =~ 15SCF biogas 1SCF biogas =~ 600BTUs Cost of energy has a significant impact on economic feasibility Typically generate 15%-50% of plant s energy 30


31 Energy generated can offset purchased electrical energy Biogas Fueled Blower Biogas Fueled Engine-Generator Electric Utility
32 Metered Demand CHP system down time can have a significant impact on overall benefit kW Base Load - 3-Day CHP System Down Time During Peak period Peak Demand-6500kW Demand kw W/O CHP 4000 Demand kw W/ CHP Billing Period


33 Energy generated from biogas can be sold directly to the utility Utility Service Utility Meter CHP System Sell Energy Directly To Electric Utility OR Offset Purchased Utility Power Source TREATMENT FACILITY
34 There are different ways to benefit from onsite power generation. Offset purchased power source Connection downstream of the utility meter to the plant. Generate electricity or direct drive process equipment. Power offset at the plant s utility rate. Sell energy directly to the utility Connection upstream of the utility meter to the plant. PURPA laws require regulated electric utilities to purchase energy generated from renewable sources at their avoided cost as a minimum. Buy Back rates may provide more benefit. May be able to get an additional premium as a renewable energy credits.
35 12:01am 1:00am 2:00am 3:00am 4:00am 5:00am 6:00am 7:00am 8:00am 9:00am 10:00am 11:00am 12:00pm 1:00pm 2:00pm 3:00pm 4:00pm 5:00pm 6:00pm 7:00pm 8:00pm 9:00pm 10:00pm 11:00pm 12:00pm Energy Cost $/KWH Some utilities purchase renewable energy on a energy charge only rate. $0.14 Duke Energy (NC) Rate PP-N Rate Option A No Demand Ratcheting!!!! $0.12 $0.10 $0.08 $0.06 $0.04 $0.02 Off-Peak Weekends and Holidays (5.18 /kwh) On-Peak Monday-Friday (9.05 /kwh) $0.00 Time of Day
36 Thank You! Tina Hanson Bryan Lisk 36
37 37 BULL PEN
38 Metered Demand Energy generated from biogas can offset purchased electrical energy 1000kW Base Load - Continuous CHP System Operation Offset Demand Charges Offset Energy Charges Demand kw W/O CHP Demand kw W/ CHP Billing Period
39 Metered Demand Continuous operation yields demand and energy reduction benefits kW Base Load - Continuous CHP System Operation Peak Demand-5500kW Demand kw W/O CHP Demand kw W/ CHP Billing Period

40 Monitoring plant demand profile is key to managing energy On-Peak Period OWASA Mason Farm WWTP Demand Profile (Duke Energy Rate-OPT) Daily Demands, June 2011 The Cause: Deep-bed filter backwash process The Response: Move timing to lower demand periods. Saved ~$1500 per month.
41 Plant demand profile impacts energy costs
42 Plant demand profile impacts energy costs Evaluate the energy costs for two demand profiles Energy Charge 3.0 /KWH Monthly Demand Charge - $10.00/kW Energy Usage Energy 3.0 /KWH Metered Demand Demand $10.00/KW Total Charges Average Cost per/kwh High Peaking Scenario Low Peaking Scenario KWH KWH $69, kW $65,000 $134, /KWH $69, kW $37,000 $106, /KWH


43 Energy Optimization Secondary Treatment Considerations Aeration Diffusers Blowers DO Control Mixing Process Selection Denitrification Benefits Primary Clarifier Operation