AIR QUALITY IMPACT ANALYSIS GOLDEN VALLEY ROAD BRIDGE SANTA CLARITA, CALIFORNIA
|
|
|
- Scarlett Augusta Boone
- 5 years ago
- Views:
Transcription
1 AIR QUALITY IMPACT ANALYSIS GOLDEN VALLEY ROAD BRIDGE SANTA CLARITA, CALIFORNIA EA No Prepared for: Valencia Boulevard, Suite 300 Santa Clarita, California and U.S. Federal Highway Administration c/o California Department of Transportation District 7, Office of Local Programs 700 North Alameda Street, 4 th Floor Los Angeles, California May 2007
2
3 TABLE OF CONTENTS Section Page SECTION 1.0 INTRODUCTION Introduction Project Description Summary... 6 SECTION 2.0 AIR POLLUTANTS Carbon Monoxide (CO) Ozone (O 3 ) Nitrogen Dioxide (NO 2 ) Respirable Particulate Matter (PM 10 ) Fine Particulate Matter (PM 2.5 ) Sulfur Dioxide (SO 2 ) Lead (Pb) Toxic Air Contaminants Mobile Source Air Toxics SECTION 3.0 APPLICABLE STANDARDS Federal and State Standards Regional Authority Conformity of Federal Actions SECTION 4.0 EXISTING CONDITIONS Environmental Setting, Climate, and Meteorology Regional and Local Air Quality SECTION 5.0 FUTURE AIR QUALITY IMPACTS Operational Emissions Construction Emissions SECTION 6.0 POLLUTION MITIGATION AND ABATEMENT MEASURES...49 SECTION 7.0 REFERENCES...51 Air Quality Impact Analysis Golden Valley Road Bridge Page i
4 APPENDICES A Construction Emissions Worksheets B Fugitive Dust Best Available Control Measures C Transportation Conformity Working Group Documents LIST OF FIGURES Figure Page 1 Regional Location Map Vicinity Map Existing and Planned Development... 7 LIST OF TABLES Table Page Table 1 California and National Ambient Air Quality Standards Table 2 Attainment Status for the Los Angeles County Portion of the South Coast Air Basin Table 3 Santa Clarita Monitoring Station Ambient Air Quality Table 4 Simi Valley-Cochran Street Monitoring Station PM 2.5 Ambient Air Quality Table 5 Selected Intersections for the SCAQMD Attainment Plan CAL3QHC Hot Spot Modeling Analysis Table 6 Traffic Lane Volumes for Project and Attainment Plan Intersections Table 7 SCAQMD Air Quality Significance Thresholds Table 8 Estimated Bridge Construction Emissions Page ii Air Quality Impact Analysis Golden Valley Road Bridge
5 SECTION 1.0 INTRODUCTION 1.1 INTRODUCTION This Air Quality Impact Analysis has been prepared for the proposed Golden Valley Road Bridge Project. The (City) is proposing to construct a bridge spanning the Santa Clara River. The proposed bridge would be located entirely within the City of Santa Clarita. The study area extends from the eastern-most extent of Newhall Ranch Road to the northern-most extent of the Golden Valley Road/Soledad Canyon Road Interchange. Figures 1 and 2 show a regional map and a project vicinity map, respectively. EDAW, Inc. (EDAW) submitted an Air Quality Impact Analysis for the proposed Cross Valley Connector East project in August At that time, the proposed project consisted of the extension of Newhall Ranch Road by approximately 2 miles from its existing terminus at Bouquet Canyon Road to a future intersection with Golden Valley Road, and the extension of Golden Valley Road southwards to terminate approximately 2,000 feet north of Soledad Canyon Road at the terminus of the Golden Valley Road bridge project. The project scope has since been reduced in geographic extent to consist only of construction of the Golden Valley Road bridge, which is an approximate 1,100-foot-long bridge spanning the Santa Clara River. The roadway segments of the original project were removed from the project, such that the project now consists of only the bridge over the Santa Clara River. This air quality analysis was prepared as a result of findings in the Preliminary Environmental Study (PES; 2006) that evaluated the project at a broad level to determine the technical studies and environmental document needed. The PES was prepared by the and signed by the California Department of Transportation (Caltrans) and Federal Highways Administration (FHWA). This air quality study will describe the existing air quality, identify applicable rules and regulations, identify potential air quality impacts of the proposed roadway, identify measures to mitigate or minimize pollutant emissions associated with the proposed project, and demonstrate conformity of the proposed project to the State Implementation Plan (SIP), as required by the Clean Air Act. The study also analyzes impacts as required by the California Environmental Quality Act (CEQA). Air Quality Impact Analysis Golden Valley Road Bridge Page 3


6 Kern County Los Angeles County 5 Location of Proposed Project Palmdale e Los Angeles County Ventura County AØ?Ý 210?Õ e ?Ò e e Los 605 Angeles County Orange County e Source: California Geospatial Information Library, Miles 1 inch equals 10 miles Figure 1 Regional Location Map Air Quality Impact Analysis - Golden Valley Road Bridge
 Newhall Ranch Road (under construction by others) Approx.")
 Figure 2 Vicinity Map (to be constructed by")
")
7 R i v e r S a n t a C l a r a Golden Valley Road Bridge (Proposed Bridge Project) Golden Valley Road (open) Newhall Ranch Road (under construction by others) Approx. location of Golden Valley Road (future) Source:, 2002, ,000 Feet 1 inch equals 500 feet Golden Valley Road Bridge (Proposed Project) Figure 2 Vicinity Map (to be constructed by others) Valley Road (future) Golden Valley Road (open for public access) Golden r a R i v e r Mobile Home Park a C l a S a n t Castaic Lake Water Agency Newhall Ranch Road (under construction by others) Air Quality Impact Analysis - Golden Valley Road Bridge
8 1.2 PROJECT DESCRIPTION The is proposing to construct the 1,100-foot-long Golden Valley Road bridge over the Santa Clara River (Figure 3). The proposed bridge would connect the extension of Newhall Ranch Road, which is currently under construction northwest of the proposed project, to Golden Valley Road, south of the project site. The northern terminus of the proposed project would be the eastern-most extent of Newhall Ranch Road. Grading for the majority of Newhall Ranch Road is complete, and construction is expected to be complete between October 2007 and April The southern terminus of the proposed project would lie at the northernmost extent of the Golden Valley Road/Soledad Canyon Road Interchange, which has recently been completed and is now open for public access. The proposed project would complete a critical eastern segment of the Cross Valley Connector Project, which is included in the City s General Plan Circulation Element. The proposed typical section of the proposed bridge would include a six-lane roadway with a 14- foot median island and pedestrian and bicycle lanes. Generally, the total curb-to-curb width would be approximately 90 feet with a total ROW width of approximately 120 feet. The proposed bridge, along with other approved segments and intersection improvements under construction, will complete the Cross Valley Connector. The Cross Valley Connector will significantly increase east-west roadway capacity between the I-5/SR 126 and SR 14, thereby providing relief to currently congested arterial roadways. 1.3 SUMMARY The project site is located in the South Coast Air Basin (SCAB). The Los Angeles County portion of the air basin is currently classified as a severe 17 nonattainment area for federal 8-hour ozone (O 3 ) standard and nonattainment for state O 3 standards. Carbon monoxide (CO) is currently classified as serious nonattainment for the federal standard; however, redesignation to attainment was submitted to the U.S. Environmental Protection Agency (EPA) for approval in February The basin is classified as attainment for the state CO standard. For respirable particulate matter sized 10 microns or less in diameter (PM 10 ), the basin is currently classified as serious nonattainment for the federal standard and nonattainment for the state standard. For fine particulate matter sized 2.5 microns or less in diameter (PM 2.5 ) the basin is classified as nonattainment for the federal and state standard. The air basin currently meets the federal and state standards for nitrogen dioxide (NO 2 ), sulfur dioxide (SO 2 ), and lead (Pb) and is classified as an attainment area for these pollutants. Page 6 Air Quality Impact Analysis Golden Valley Road Bridge
 Riverpark Area 'C' Golden Valley Road (future) (to be constructed by others) Keystone Golden Valley Road Bridge")
 Golden Valley Road Residential Development Golden Valley Road Bridge (Proposed")
 0 125 250 500 750 1,000 Feet 1 inch equals 500 feet Greenbriar Estates Mobile Home Park Figure 3")
9 Air Quality Impact Analysis - Golden Valley Road Bridge City of Santa Clairta Castaic Lake Water Agency Newhall Ranch Road (under construction by others) Riverpark Area 'C' Golden Valley Road (future) (to be constructed by others) Keystone Golden Valley Road Bridge (Proposed Project) Development S a n t a C l a r a R i v e r Riverpark Area 'B' S a n t a C l a r a R i v e r Industrial Park Industrial/Commercial Development (open for public access) Golden Valley Road Residential Development Golden Valley Road Bridge (Proposed Bridge Project) Golden Valley Road (open) Industrial Park Newhall Ranch Road (under construction by others) Source:, 2002, 2005 Approx. location of Golden Valley Road (future) ,000 Feet 1 inch equals 500 feet Greenbriar Estates Mobile Home Park Figure 3 Existing and Planned Development
10 The Clean Air Act requires a demonstration that federal actions conform to the SIP and similar approved plans in areas that are designated as nonattainment or maintenance. Transportation measures, such as the proposed action, are analyzed for conformity as part of regional transportation plans (RTPs) and regional transportation improvement programs (RTIPs). The RTIP is the implementing document for the RTP. The Southern California Association of Governments (SCAG) prepares both plans, and an air quality analysis of the RTIP. The proposed project is included in the 2006 RTIP. The project is identified as Santa Clarita Project No. LA0B0103, and is described as Golden Valley Road from Soledad Canyon to Newhall Ranch Road.0 to 6 lanes, less than 0.5 miles. Includes bridge over Santa Clara River (SCAG 2006). The 2006 RTIP was approved by the FHWA and FTA on October 2, 2006, and the U.S. Department of Transportation (USDOT) adopted a Clean Air Act conformity determination for the RTIP on that date (USDOT 2006). The regional air quality emissions of the RTIP and RTP were analyzed and found to conform with the SIP, and the analysis was approved by the FHWA and FTA. Therefore, the regional emissions of the proposed project conform to the 2006 RTIP and RTP. Detailed information relative to project entries in the RTP and RTIP is included in Section 5.1 of this report. Analysis of local carbon monoxide (CO) and particulate impacts is also required to demonstrate conformity. Analysis of CO impacts in accordance with the Transportation Project-Level Carbon Monoxide Protocol shows that the project is satisfactory for local CO impacts. In accordance with Particulate Matter and Transportation Projects, An Analysis Protocol, there would be no local PM 10 impact because there would be no receptors within 100 meters of the proposed project (Caltrans 2005.) According to the March 2006 EPA rule relative to local PM 2.5 analysis for transportation projects, particulate impacts are of concern only on projects defined as projects of air quality concern. The Golden Valley Road Bridge project was determined to be not a project of air quality concern, and local particulate emissions would be acceptable. The SCAG air quality analysis addresses long-term effects of transportation improvements, which is required to demonstrate conformity with the Clean Air Act. In addition, the City of Santa Clarita is required to analyze the environmental impacts in accordance with CEQA. Therefore, discussions of construction emissions, potential impacts, and measures to avoid or minimize the impacts are included in this analysis. These emissions would be temporary and would cease at the completion of construction activities. Page 8 Air Quality Impact Analysis Golden Valley Road Bridge
11 SECTION 2.0 AIR POLLUTANTS Air pollution is a general term that refers to one or more chemical substances that degrade the quality of the atmosphere. Individual air pollutants may adversely affect human or animal health, reduce visibility, damage property, and reduce the productivity or vigor of crops and natural vegetation. Seven air pollutants have been identified by the U.S. Environmental Protection Agency (EPA) as being of concern nationwide: CO, O 3, NO 2, PM 10 (also called respirable particulate and suspended particulate), PM 2.5 (fine particulate matter), SO 2, and Pb. These pollutants are collectively referred to as criteria pollutants. A brief description of each of these pollutants is provided below. 2.1 CARBON MONOXIDE (CO) CO is a colorless and odorless gas, which, in the urban environment, is associated primarily with the incomplete combustion of fossil fuels in motor vehicles. Relatively high concentrations are typically found near crowded intersections and along heavily traveled roadways carrying slowmoving traffic. Even under the most severe meteorological and traffic conditions, high concentrations of CO are limited to locations within a relatively short distance (91.4 to meters [300 to 600 feet]) of heavily traveled roadways. Overall CO emissions are decreasing as a result of the Federal Motor Vehicle Control Program, which has mandated increasingly lower emission levels for vehicles manufactured since CO concentrations are typically higher in winter. As a result, California has required the use of oxygenated gasoline in the winter months to reduce CO emissions. CO interferes with the transfer of oxygen to the blood. It may cause dizziness and fatigue and can impair central nervous system functions. 2.2 OZONE (O 3 ) The most pervasive air quality problem in the South Coast Air Basin is high O 3 concentrations. O 3 is the principal component of smog and is formed in the atmosphere through a complex series of photochemical reactions involving reactive organic compounds (ROC) and NO X, which are commonly referred to as precursors of O 3 and are both considered critical in O 3 formation. NO X includes various combinations of nitrogen and oxygen, including NO, NO 2, NO 3, etc. Significant O 3 production generally requires about 3 hours in a stable atmosphere with strong Air Quality Impact Analysis Golden Valley Road Bridge Page 9
12 sunlight. O 3 is a regional air pollutant because it is transported and diffused by wind concurrent with the photochemical reaction process. Motor vehicles are the major source of O 3 precursors in the air basin. During late spring, summer, and early fall, light winds, low mixing heights, and abundant sunshine combine to produce conditions favorable for maximum production of O 3. O 3 causes eye and respiratory irritation, reduces resistance to lung infection, and may aggravate pulmonary conditions in persons with lung disease. O 3 is also damaging to vegetation and untreated rubber. Control strategies for O 3 have focused on reducing emissions from vehicles, industrial processes using solvents and coatings, and consumer products (e.g., cleaning products and aerosol-propelled products). 2.3 NITROGEN DIOXIDE (NO 2 ) There are two oxides of nitrogen that are important in air pollution: nitric oxide (NO) and NO 2. NO, along with some NO 2, is emitted from motor vehicle engines, power plants, refineries, industrial boilers, ships, aircraft, and railroads. NO 2 is primarily formed when NO reacts with atmospheric oxygen in the presence of ROC and sunlight; the other product of this reaction is O 3, as discussed above. NO 2 is the whiskey brown -colored gas, more commonly known as smog, readily observed during periods of heavy air pollution. NO 2 increases damage from respiratory disease and irritation and may reduce resistance to certain infections. 2.4 RESPIRABLE PARTICULATE MATTER (PM 10 ) Respirable particulate matter refers to particulates equal to or less than 10 microns in diameter those that can be inhaled and cause health effects. Particulates in the atmosphere result from many kinds of dust- and fume-producing industrial and agricultural operations, combustion, and atmospheric photochemical reactions. Demolition, construction, and vehicular traffic are major sources of particulates in urban areas. Natural sources of particulates include windblown dust and ocean spray. Very small particulates of certain substances can cause direct lung damage or can contain absorbed gasses that may be injurious. Particulates can also damage materials and reduce visibility. Control of PM 10 is achieved through the control of dust at construction sites, the cleaning of paved roads, and the wetting or paving of frequently used unpaved roads. 2.5 FINE PARTICULATE MATTER (PM 2.5 ) The sources, health effects, and control of PM 2.5 are similar to those of PM 10. In 1997, the EPA determined that the health effects of PM 2.5 were severe enough to warrant an additional standard, and standards for PM 2.5 became effective on September 15, The U.S. Supreme Court Page 10 Air Quality Impact Analysis Golden Valley Road Bridge
13 affirmed the standards, and policies and systems to implement these new standards. Formal attainment classifications for PM 2.5 were formally published on December 17, 2004, by EPA. The SCAB is a nonattainment area for PM 2.5. The CARB must submit a PM 2.5 SIP to the EPA by April 5, The PM 2.5 attainment year for the SCAB is 2010, with a possible five year extension to 2015 (SCAG 2006c). 2.6 SULFUR DIOXIDE (SO 2 ) SO 2 is a combustion product, with the primary source being power plants and heavy industry that use coal or oil as fuel. SO 2 is also a product of diesel engine combustion. The health effects of SO 2 include lung disease and breathing problems for asthmatics. SO 2 in the atmosphere contributes to the formation of acid rain. In the South Coast Air Basin, there is relatively little use of coal and oil, and SO 2 is of lesser concern than in many other parts of the country. 2.7 LEAD (Pb) Pb is a stable compound that persists and accumulates both in the environment and in animals. The Pb used in gasoline anti-knock additives represent a major source of Pb emissions to the atmosphere. However, Pb emissions have significantly decreased due to the near elimination of the use of leaded gasoline. The criteria pollutants that are most important for this air quality impact analysis are those that can be traced principally to motor vehicles and construction equipment. Of these pollutants, CO, ROC, NO X, and PM 10 are evaluated on a regional or mesoscale basis. CO is often analyzed on a localized or microscale basis in cases of congested traffic conditions. Although PM 10 has very localized effects, there is no EPA-approved methodology to evaluate microscale impacts of PM 10. Methods for analysis of PM 10 and PM 2.5 are anticipated within the next few years. 2.8 TOXIC AIR CONTAMINANTS MOBILE SOURCE AIR TOXICS In addition to the criteria air pollutants for which there are NAAQS, EPA also regulates toxic air contaminants (TAC) also known as hazardous air pollutants. Concentrations of TACs are also used as indicators of ambient-air-quality conditions. A TAC is defined as an air pollutant that may cause or contribute to an increase in mortality or in serious illness, or that may pose a hazard to human health. TACs are usually present in minute quantities in the ambient air; however, their high toxicity or health risk may pose a threat to public health even at low concentrations. In general, for those TACs that may cause cancer, there is no concentration that Air Quality Impact Analysis Golden Valley Road Bridge Page 11
14 does not present some risk. In other words, there is no threshold level below which adverse health impacts may not be expected to occur. This contrasts with the criteria air pollutants for which acceptable levels of exposure can be determined and for which the ambient standards have been established (See Table 1 in Section 3.2). Most TACs originate from human-made sources, including on-road mobile sources, non-road mobile sources (e.g., airplanes), area sources (e.g., dry cleaners) and stationary sources (e.g., factories or refineries). The Clean Air Act identified 188 TACs. The EPA has assessed this expansive list of toxics and identified a group of 21 as Mobile Source Air Toxics (MSATs). The MSATs are compounds emitted from highway vehicles and non-road equipment. Some toxic compounds are present in fuel and are emitted to the air when the fuel evaporates or passes through the engine unburned. Other toxics are emitted from the incomplete combustion of fuels or as secondary combustion products. Metal air toxics also result from engine wear or from impurities in oil or gasoline. The EPA also extracted a subset of this list of 21 compounds that it now labels as the six priority MSATs. These are benzene, formaldehyde, acetaldehyde, diesel particulate matter/diesel exhaust organic gases, acrolein, and 1,3-butadiene. While these MSATs are considered the priority transportation toxics, the EPA stresses that the lists are subject to change and may be adjusted in future rules (FHWA 2006a). The EPA has issued a number of regulations that will dramatically decrease MSATs through cleaner fuels and cleaner engines. According to an FHWA analysis, even if the number of vehile miles traveled increases by 64 percent, reductions of 57 percent to 87 percent in MSATs are projected from 2000 to Project MSAT impacts are discussed in Section 5.1 of this report. According to the 2006 California Almanac of Emissions and Air Quality (CARB 2006a), the majority of the estimated health risk from TACs can be attributed to relatively few compounds, the most important being PM from diesel-fueled engines (diesel PM). Diesel PM differs from other TACs in that it is not a single substance, but rather a complex mixture of hundreds of substances. Although diesel PM is emitted by diesel-fueled internal combustion engines, the composition of the emissions varies depending on engine type, operating conditions, fuel composition, lubricating oil, and whether an emission control system is present. Unlike the other TACs, no ambient monitoring data are available for diesel PM because no routine measurement method currently exists. However, the CARB has made preliminary concentration estimates based on a PM exposure method. This method uses CARB emissions inventory s PM 10 database, ambient PM 10 monitoring data, and the results from several studies to estimate concentrations of diesel PM. In addition to diesel PM, benzene, 1,3-butadiene, acetaldehyde, carbon tetrachloride, hexavalent chromium, para-dichlorobenzene, formaldehyde, methylene chloride, and Page 12 Air Quality Impact Analysis Golden Valley Road Bridge
15 perchloroethylene pose the greatest existing ambient risk, for which data are available, in California. Diesel PM poses the greatest health risk among these ten TACs mentioned. Based on receptor modeling techniques, the ARB estimated the diesel PM health risk in 2000 to be 720 excess cancer cases per million people in the SCAB. Since 1990, the diesel PM s health risk in the SCAB has been reduced by one-third. Overall, levels of most TACs have gone down since 1990 except for para-dichlorobenzene and formaldehyde (CARB 2006a). Air Quality Impact Analysis Golden Valley Road Bridge Page 13
16 This page intentionally left blank. Page 14 Air Quality Impact Analysis Golden Valley Road Bridge
17 SECTION 3.0 APPLICABLE STANDARDS 3.1 FEDERAL AND STATE STANDARDS The federal Clean Air Act (42 U.S.C q) requires the adoption of national ambient air quality standards (NAAQS) to protect public health and welfare from the effects of air pollution. The NAAQS have been updated as needed. Current standards are set for SO 2, CO, NO 2, O 3, PM 10, PM 2.5, and Pb. The ARB has established additional standards, which are generally more stringent than the NAAQS. Federal and state standards are shown in Table 1. Areas are classified under the federal Clean Air Act as either attainment or nonattainment areas for each criteria pollutant based on whether the NAAQS have been achieved or not. The Los Angeles County portion of the air basin is currently classified as a federal or state nonattainment area, to some degree, for O 3, CO, and PM 10, and PM 2.5. The air basin currently meets the federal and state standards for NO 2, SO 2, and Pb and is classified as an attainment area for these pollutants. A detailed listing of attainment designations is included in Section 4.2 of this report. 3.2 REGIONAL AUTHORITY In the South Coast Air Basin, the SCAQMD is the agency responsible for the administration of federal and state air quality laws, regulations, and policies. Included in the SCAQMD s tasks are monitoring of air pollution, preparation of the SIP for the South Coast Air Basin, and the promulgation of its Rules and Regulations. The SIP includes strategies and tactics to be used to attain the federal O 3 standard in the Los Angeles South Coast Air Basin area. The SIP elements are taken from the 2003 Air Quality Management Plan (AQMP), the SCAQMD plan for attaining the state O 3 standard. The Rules and Regulations include procedures and requirements to control the emission of pollutants and to prevent adverse impacts. SCAQMD regulations require that any equipment that emits or controls air contaminants, such as NO X and ROC, be permitted prior to construction, installation, or operation (Authority to Construct or Permit to Operate). The SCAQMD is responsible for review of applications and for the approval and issuance of these permits. Air Quality Impact Analysis Golden Valley Road Bridge Page 15
18 Table 1 California and National Ambient Air Quality Standards NAAQS 1 CAAQS 2 Pollutant Averaging Time Primary 3 Secondary 4 Concentration 5 1-Hour Note ppm (180 μg/m 3 ) Ozone (O 3 ) 8-Hour 0.08 ppm (157 μg/m 3 Same as ) Primary Standard ppm (137 μg/m 3 ) Carbon Monoxide 8-Hour 9.0 ppm (10 mg/m 3 ) 9.0 ppm (10 mg/m 3 ) (CO) 1-Hour 35 ppm (40 mg/m 3 None ) 20 ppm (23 mg/m 3 ) Nitrogen Dioxide Annual Average ppm (100 μg/m 3 ) Same as - (NO 2 ) 1-Hour - Primary Standard 0.25 ppm (470 μg/m 3 ) Annual Average 0.03 ppm (80 μg/m 3 ) - - Sulfur Dioxide (SO 2 ) 24-Hour 0.14 ppm (365 μg/m 3 ) ppm (105 μg/m 3 ) 3-Hour ppm (1300 μg/m 3 ) - 1-Hour ppm (655 μg/m 3 ) Suspended 24-Hour 150 μg/m 3 note 9-50 μg/m 3 Particulate Matter Annual Arithmetic 3 Same as (PM 10 ) 50 μg/m Mean Primary Standard 20 μg/m 3 note 7 24-Hour μg/m 3 note Fine Particulate Matter (PM 2.5 ) Annual Arithmetic 3 Same as 15 μg/m 12 μg/m 3 note 7 Mean Primary Standard 30-Day Average μg/m 3 Lead (Pb) 8 3 Same as Calendar Quarter 1.5 μg/m Primary Standard - Hydrogen Sulfide (HS) 1-Hour 0.03 ppm (42 μg/m 3 ) Sulfates (SO 4 ) 24-Hour 25 μg/m 3 Visibility Reducing Particles 8-Hour (10 am to 6 pm, Pacific Standard Time) No Federal Standards In sufficient amount to produce an extinction coefficient of 0.23 per km due to particles when the relative humidity is less than 70 percent. Vinyl chloride 8 24-Hour 0.01 ppm (26 μg/m 3 ) NAAQS (other than O 3, particulate matter, and those based on annual averages or annual arithmetic mean) are not to be exceeded more than once a year. The O 3 standard is attained when the fourth highest 8-hour concentration in a year, averaged over 3 years, is equal to or less than the standard. For PM 10, the 24-hour standard is not to be exceeded more than once per year. The annual standard is attained when the 3-year average of the weighted annual mean at each monitor within an area does not exceed 50 μg/m 3. For PM 2.5, the 24-hour standard is attained when 98 percent of the daily concentrations, averaged over 3 years, do not exceed 65 μg/m 3. The annual standard is attained when the 3-year average of the weighted annual mean at single or multiple community-oriented monitors does not exceed 15 μg/m 3. California Ambient Air Quality Standards for O 3, CO (except Lake Tahoe), SO 2 (1- and 24-hour), NO 2, PM 10, and visibility reducing particles, are values that are not to be exceeded. All others are not to be equaled or exceeded. National Primary Standards: The levels of air quality necessary, with an adequate margin of safety, to protect the public health. National Secondary Standards: The levels of air quality necessary to protect the public welfare from any known or anticipated adverse effects of a pollutant Concentration expressed first in units in which it was promulgated. Ppm in this table refers to ppm by volume or micromoles of pollutant per mole of gas. The federal 1-hour O 3 standard was revoked for most areas of the United States, including all of California on June 15, On June 5, 2003, the Office of Administrative Law approved the amendments to the regulations for the state ambient air quality standards for particulate matter and sulfates. Those amendments established a new annual average standard for PM 2.5 of 12 μg/m 3 and reduced the level of the annual average standard for PM 10 to 20 μg/m 3. The approved amendments were filed with the Secretary of State on June 5, The regulations became effective on July 5, The CARB has identified lead and vinyl chloride as toxic air contaminants with no threshold level of exposure for adverse health effects determined. These actions allow for the implementation of control measures at levels below the ambient concentrations specified for these pollutants. The EPA has revoked the annual standard for PM 10 ; the revocation was effective December 18, The 24-hour standard for PM 2.5 has been reduced from 65 μg/m 3 to 35 μg/m 3, effective December 18, ppm = parts per million; µg/m 3 = micrograms per cubic meter; mg/m 3 = milligrams per cubic meter; km = kilometer Source: CARB 2006b, EPA 2005, 2006c Page 16 Air Quality Impact Analysis Golden Valley Road Bridge
19 SCAQMD s AQMP and SIP The current AQMP in the Basin is the 2003 AQMP, which is an update to the 1997 AQMP. The 2003 AQMP employs up-to-date science and analytical tools and incorporates a comprehensive strategy aimed at controlling pollution from all sources, including stationary sources, on-road and off-road mobile sources, and area sources. The 2003 AQMP proposes policies and measures to achieve federal and state standards for healthy air quality in the Basin. The 2003 AQMP updates the demonstration of attainment with the federal standards for O 3 and PM 10 ; replaces the 1997 attainment demonstration for the federal CO standard and provides a basis for a maintenance plan for CO for the future; and updates the maintenance plan for the federal NO 2 standard that the Basin has met since 1992 (SCAQMD 2006). The 2003 AQMP was adopted by SCAQMD in August 2003 and approved, with modifications, by the ARB in October 2003 (ARB 2003). The EPA is reviewing the 2003 AQMP and approval is pending. As a result of State and local control strategies, the SCAB has not exceeded the federal CO standard since In March 2005, the SCAQMD adopted a CO Redesignation Request and Maintenance Plan that provides for maintenance of the federal CO air quality standard until at least 2015 and commits to revising the Plan in 2013 to ensure maintenance through The AQMD also adopted a CO emissions budget that covers 2005 through On February 24, 2006, CARB transmitted the Redesignation Request and Maintenance Plan (including the CO budgets) to U.S. EPA for approval (CARB 2006c). The 2007 AQMP is under development. A draft version has been released to the public, and public workshops were held in October, November 2006 (SCAQMD 2006b). The purpose of the 2007 AQMP or Plan for the SCAB is to set forth a comprehensive program that will lead the region into compliance with federal 8-hour ozone and PM 2.5 air quality standards. The Plan will be submitted to EPA as a SIP revision once it is approved by the District s Governing Board and the CARB (SCAQMD 2006c). The PM 2.5 strategy is of interest. Since PM 2.5 in the Basin is overwhelmingly formed secondarily, the overall draft control strategy focuses on reducing precursor emission of SOx, directlyemitted PM2.5, NOx, and VOC instead of fugitive dust. Based on the District s modeling sensitivity analysis, SOx reductions, followed by directly-emitted PM2.5 and NOx reductions, provide the greatest benefits in terms of reducing the ambient PM2.5 concentrations (SCAQMD 2006c). SCAQMD Significance Criteria In order to assess impacts in accordance with the California Environmental Quality Act, (CEQA), the SCAQMD has established thresholds of significance for air quality for construction Air Quality Impact Analysis Golden Valley Road Bridge Page 17
20 activities and project operation. Only the thresholds pertaining to construction are applicable to this project, and are discussed further in Section 5.2 of this report. 3.3 CONFORMITY OF FEDERAL ACTIONS Background The Clean Air Act Amendments of 1990 (Pub. L , 104 Stat. 2399) require the EPA to promulgate rules to ensure that federal actions conform to the appropriate SIP. These rules, known together as the General Conformity Rule (40 C.F.R et seq. and et seq.), require any federal agency responsible for an action to determine if its action conforms to pertinent guidelines and regulations. Section 176(c) of the Clean Air Act requires the following: No department, agency, or instrumentality of the Federal Government shall engage in, support in any way or provide financial assistance for, license or permit, or approve, any activity which does not conform to an implementation plan after it has been approved. Conformity to an implementation plan means: (A) conformity to an implementation plan s purpose of eliminating or reducing the severity and number of violations of the national ambient air quality standards and achieving expeditious attainment of such standards; and (B) that such activities will not (i) (ii) (iii) cause or contribute to any new violation of any standard in any area; increase the frequency or severity of any existing violation of any standard in any area; or delay timely attainment of any standard or any required interim emission reductions or other milestones in any area. The determination of conformity shall be based on the most recent estimates of emissions, and such estimates shall be determined from the most recent population, employment, travel and Page 18 Air Quality Impact Analysis Golden Valley Road Bridge
21 congestion estimates as determined by the metropolitan planning organization or other agency authorized to make such estimates. In November 1993, the USDOT and the EPA developed guidance for determining conformity of transportation plans, programs, and projects. This guidance is denoted as the Transportation Conformity Rule (40 C.F.R and 40 C.F.R ). A significant revision to the Clean Air Act in 1997 established new ambient air quality standards for 8-hour ozone and PM 2.5. Legal challenges to the new standards delayed implementation relative to transportation until On July 1, EPA promulgated revisions to the transportation conformity rule to include criteria and procedures for the new 8-hour ozone and fine particulate matter (PM 2.5 ) national ambient air quality standards (Federal Register 2004), The action did not finalize new transportation conformity requirements for PM 2.5 precursors and PM 2.5 hot-spot analyses, or make changes to existing PM 10 hot-spot analysis requirements. Subsequent rulemakings have developed current procedures for these particulate analyses. One of the more recent rules was promulgated in March 2006, and is discussed in the PM 2.5 analysis section of this report. Project Conformity The metropolitan planning organization responsible for the preparation of regional transportation plans and the associated air quality analyses is the SCAG. The regional plans are the RTP and RTIP. The current RTP, the 2006 RTP was adopted in July The air quality conformity determination for the 2006 RTP was approved October 2, The most recent version of the RTP, titled the Final 2004 Regional Transportation Plan Amendment and 2006 Regional Transportation Improvement Program Amendment, was adopted on February 2, SCAG is currently soliciting input for the 2007 RTP (SCAG 2006). The 2006 RTIP was adopted by SCAG on July 27, 2006, approved by Caltrans on August 31, 2006, and approved by FHWA/FTA on October 2, Air Quality Impact Analysis Golden Valley Road Bridge Page 19
22 This page intentionally left blank. Page 20 Air Quality Impact Analysis Golden Valley Road Bridge
23 SECTION 4.0 EXISTING CONDITIONS 4.1 ENVIRONMENTAL SETTING, CLIMATE, AND METEOROLOGY Air quality is affected by both the rate and location of pollutant emissions and by meteorological conditions, which influence movement and dispersal of pollutants. Atmospheric conditions such as wind speed, wind direction, and air temperature gradients, along with local topography, provide the link between air pollutant emissions and air quality. Regional Climate The South Coast Air Basin consists of four counties: San Bernardino, Riverside, Los Angeles, and Orange, and includes some portions of what used to be the Southeast Desert Air Basin. In May 1996, the boundaries of the South Coast Air Basin were changed by the ARB to include the Beaumont-Banning area. In addition, the Southeast Desert Air Basin was separated into two areas and renamed as the Mojave Desert Air Basin and the Salton Sea Air Basin. The distinctive climate of the South Coast Air Basin is determined by its terrain and geographic location. The South Coast Air Basin is a coastal plain with connecting broad valleys and low hills, bounded by the Pacific Ocean to the southwest and high mountains around the rest of its perimeter. The general region lies in the semi-permanent high pressure zone of the eastern Pacific, resulting in a mild climate tempered by cool sea breezes with light average wind speeds. The usually mild climatological pattern is interrupted occasionally by periods of extremely hot weather, winter storms, or Santa Ana winds. The vertical dispersion of air pollutants in the air basin is hampered by the presence of persistent temperature inversions. High-pressure systems, such as the semi-permanent high-pressure zone in which the air basin is located, are characterized by an upper layer of dry air that warms as it descends, restricting the mobility of cooler marine-influenced air near the ground surface, and resulting in the formation of subsidence inversions. Such inversions restrict the vertical dispersion of air pollutants released into the marine layer and, together with strong sunlight, can produce worst-case conditions for the formation of photochemical smog. The basinwide occurrence of inversions at 1,066.8 m (3,500 ft) above sea level or less averages 191 days per year (SCAQMD 1993). Air Quality Impact Analysis Golden Valley Road Bridge Page 21
24 The atmospheric pollution potential of an area is largely dependent on winds, atmospheric stability, solar radiation, and terrain. The combination of low wind speeds and low inversions produces the greatest concentration of air pollutants. On days without inversions, or on days of winds averaging over 15 mph, smog potential is greatly reduced. Santa Clarita Microclimate Santa Clarita is located in Los Angeles County north of the San Fernando Valley, surrounded by the Santa Susana and San Gabriel mountain ranges on the south, east and west, and the Sierra Pelona Mountains on the north. Santa Clarita is situated in the transitional microclimatic zone of the South Coast Air Basin, located between two climate types, known as valley marginal and high desert. Due to the city s location, it usually escapes the damp coastal air and fog. The summers are typically hot and the winters are typically sunny and warm. Santa Clarita s climate is relatively mild. Annual average daytime temperatures range from 89.7 degrees Fahrenheit ( F) in summer to 63.6 F in winter. Low temperatures average 58.9 F in summer to 41.3 F in winter. Annual precipitation of Santa Clarita is 33.3 centimeters (13.10 inches), which occurs almost exclusively between late October and April (WRCC 2004). 4.2 REGIONAL AND LOCAL AIR QUALITY Specific geographic areas are classified as either attainment or nonattainment areas for each pollutant based upon the comparison of measured data with federal and state standards. Table 2 lists the current attainment status of each criteria pollutant in the Los Angles County portion of the SCAB. PM 2.5 is not measured at the Santa Clarita Station. The closest PM2.5 monitoring stations are at Reseda and Lancaster in Los Angeles County, and in the City of Simi Valley in Ventura County. Distance and intervening topography would indicate that data from these stations would not be completely representative of ambient air quality in the project area. The most representative station of the three is the Simi Valley Cochran Street station, located approximately xx miles southwest of the Golden Valley Road Bridge site (Caltrans 2006c). Table 4 shows the PM 2.5 data from that station for the 2003 through 2005 period. Page 22 Air Quality Impact Analysis Golden Valley Road Bridge
25 Table 2 Attainment Status for the Los Angeles County Portion of the South Coast Air Basin Attainment Status Pollutant Federal State O 3 1-Hour -- a O 3 8-hour Nonattainment Severe 17 Nonattainment Extreme PM 10 Nonattainment Serious Nonattainment PM 2.5 Nonattainment Nonattainment CO Nonattainment Serious b Attainment NO 2 Attainment - Maintenance c Attainment SO 2 Attainment Attainment Pb Attainment Attainment a- Repealed by law in June b-redesignation to Attainment was submitted to the EPA for approval in February c Redesignation to Attainment by EPA occurred in The CARB web site indicates the federal status for NO 2 as Unclassified/Attainment The 2003 SCAQMD AQMP serves as the NO 2 maintenance plan for the SCAB. Sources: EPA 2006; CARB 2006d Air Quality Impact Analysis Golden Valley Road Bridge Page 23
26 Table 3 Santa Clarita Monitoring Station Ambient Air Quality Pollutant Standards Ozone (O 3 ) Maximum 1-hour concentration (ppm) Maximum 8-hour concentration (ppm) Number of Days Standard Exceeded NAAQS 1-hour (>0.12 ppm) CAAQS 1-hour (>0.09 ppm) NAAQS 8-hour (>0.08 ppm) Carbon Monoxide (CO) Maximum 8-hour concentration (ppm) Maximum 1-hour concentration (ppm) Number of Days Standard Exceeded NAAQS 8-hour (>9.0 ppm) CAAQS 8-hour (>9.0 ppm) NAAQS 1-hour (>35 ppm) CAAQS 1-hour (>20 ppm) Particulate Matter (PM 10 ) a National maximum 24-hour concentration (μg/m 3 ) National second highest 24-hour concentration (μg/m 3 ) State maximum 24-hour concentration (μg/m 3 ) State second highest 24-hour concentration (μg/m 3 ) National annual average concentration (μg/m 3 ) State annual average concentration (μg/m 3 ) Number of Days Standard Exceeded NAAQS 24-hour (>150 μg/m 3 ) b CAAQS 24-hour (>50 μg/m 3 ) b a Measurements usually collected every six days. b Based on an estimate of how many days concentrations would have been greater than the standard because samples are collected once every six days. CAAQS = California Ambient Air Quality Standards. NAAQS = National Ambient Air Quality Standards. Sources: CARB 2006e; EPA 2006b. Page 24 Air Quality Impact Analysis Golden Valley Road Bridge
27 Table 4 Simi Valley-Cochran Street Monitoring Station PM 2.5 Ambient Air Quality Pollutant Standards Particulate Matter (PM 2.5 ) a National maximum 24-hour concentration (μg/m 3 ) b National second highest 24-hour concentration (μg/m 3 ) State maximum 24-hour concentration (μg/m 3 ) b State second highest 24-hour concentration (μg/m 3 ) National annual average concentration (μg/m 3 ) State annual average concentration (μg/m 3 ) * Number of Days Standard Exceeded NAAQS 24-hour (>65 μg/m 3 ) c Years exceeded CAAQS annual standard (>12 μg/m 3 ) * 0 0 μg/m 3 = micrograms per cubic meter; * = There was insufficient data to determine the value. CAAQS = California Ambient Air Quality Standards. NAAQS = National Ambient Air Quality Standards. a Measurements usually collected every six days. b State and national statistics may differ for the following reasons: State statistics are based on California approved samplers, whereas national statistics are based on samplers using federal reference or equivalent methods. State and national statistics may therefore be based on different samplers. State statistics are based on local conditions National statistics are based on standard conditions. State criteria for ensuring that data are sufficiently complete for calculating valid annual averages are more stringent than the national criteria. Sources: CARB 2006e; EPA 2006b. Air Quality Impact Analysis Golden Valley Road Bridge Page 25
28 This page intentionally left blank. Page 26 Air Quality Impact Analysis Golden Valley Road Bridge
29 SECTION 5.0 FUTURE AIR QUALITY IMPACTS An impact would be considered significant under the National Environmental Policy Act or CEQA if it would (1) cause or contribute to new violation of federal, state, and local standards in the area; (2) interfere with provisions in the application of the SIP for maintenance or attainment of air quality standards; (3) increase the frequency or severity of an existing violation of any standard; or (4) delay timely attainment of any standard, any interim emission reduction, or other milestones included in the SIP for air quality. 5.1 OPERATIONAL EMISSIONS Regional Air Quality The Clean Air Act requires a demonstration that federal actions conform to SIP and similar approved plans in areas that are designated as nonattainment. Transportation measures, such as the proposed action, are analyzed for conformity as part of the RTP and RTIP. The RTIP is the implementing document for the RTP. Both plans, and an air quality analysis of the RTIP, were prepared by the SCAG. The proposed project is included in Destination 2030: 2004 Regional Transportation Plan (RTP) Appendix I, Project Lists, on page I-31, as Santa Clarita project LA0B103 - Construct Golden Valley Road from Soledad Canyon to Newhall Ranch Road. 0 to 6 lanes. Less than 0.5 miles - includes bridge over Santa Clara River (SCAG 2006). The RTP was approved by federal agencies on June 7, 2004, and the U.S. Department of Transportation (USDOT) adopted a Clean Air Act conformity determination for the RTP on that date (SCAG 2006). Amendments to the 2004 RTP were adopted in February and July The scope of these amendments was limited to transit corridors, and they have no relationship to the Golden Valley Road Bridge project. The proposed project is included in Final Adopted 2006 Regional Transportation Program (RTIP) on page 33, of the Los Angeles County Local Highways Section, as Santa Clarita project LA0B103 - Construct Golden Valley Road from Soledad Canyon to Newhall Ranch Road. 0 to 6 lanes. Less than 0.5 miles - includes bridge over Santa Clara River (SCAG 2006). The RTIP was approved by federal agencies on October 2, 2006, and the U.S. Department of Transportation (USDOT) adopted a Clean Air Act conformity determination for the RTIP on that date (USDOT 2006). Volume I of the 2006 RTIP summarizes the air quality conformity determinations made for the RTIP, including showing consistency with the 2004 RTP; Air Quality Impact Analysis Golden Valley Road Bridge Page 27
30 satisfactory findings for emissions of PM 2.5, ozone precursors, NO 2, CO and PM 10 for the SCAB; and compliance with Transportation Control Measures, Financial Constraint, and Interagency Consultation and Public Involvement Tests. These are the requirements for a transportation program to demonstrate conformity with the Clean Air Act. The proposed project is consistent with the description included in the 2006 RTIP and therefore conforms to the RTIP and RTP. Therefore, it may be concluded that the regional emissions of the proposed project conform to the RTIP and RTP, and there would be no significant impact under CEQA. Local Air Quality The Transportation Conformity Rules require a statement that: Federal projects must not cause or contribute to any new localized CO or PM 10 violations or increase the frequency or severity of any existing CO or PM 10 violations in CO and PM 10 nonattainment and maintenance areas. The CO and PM 10 requirements apply to the proposed project because the project site is in a federal CO and PM 10 nonattainment areas. The air quality analyses of projects included in the RTP and RTIP do not include the analyses of local CO impacts; these must be addressed on a project level. Carbon Monoxide The Transportation Project-Level Carbon Monoxide Protocol, UCD-ITS (The Protocol), University of California, Davis, December 1997, provides procedures and guidelines for use by agencies to evaluate the potential local level CO impacts of a transportation project. The Protocol provides decision flow charts designed to assist the lead agency in evaluating requirements that specifically apply to a proposed action. An examination of each flow chart inquiry as they pertain to the proposed project is provided below. Page 28 Air Quality Impact Analysis Golden Valley Road Bridge
31 Requirement for New Project (from Figure 1 of the Transportation Project-Level Carbon Monoxide Protocol, UCD-ITS-97-21): Is the proposed project exempt from all emission analyses? The proposed project is not exempt from all emission analyses as it does not meet the criteria for projects exempt from all emissions analyses listed in The Protocol. In addition, the air quality analyses of projects included in the RTP and RTIP do not include the analyses of local CO impacts, which therefore must be addressed on a project level Is the proposed project exempt from regional emission analyses? The proposed project is not exempt from regional emission analyses as it does not meet the criteria for projects exempt from regional emission analyses listed in the Protocol Is the proposed project locally defined as regionally significant? Yes. Regionally significant projects are defined in 40 CFR as projects that would normally be included in the modeling of a metropolitan area s transportation network, which is the case for this project (Caltrans 2006) Is the project in a federal attainment area? No, Redesignation to Attainment was submitted to the EPA for approval in February 2006, but the redesignation has not occurred Is there a currently conforming RTP and TIP? Yes. Details of the RTP and RTIP are discussed in Sections 3.3 and 5.1 of this report Is the project included in the regional emissions analysis supporting the currently conforming RTP and TIP? Yes. Details of the project inclusion in the RTP and RTIP are discussed in Sections 3.3 and 5.1 of this report Has project design concept and/or scope changed significantly from that in the regional analysis? No. With this response, one is required to Examine Local Impacts, per Section 4 of the Protocol. The question and answers below are from Figure 3, Local CO Analysis. Level 1. Is the project in a CO nonattainment area? Yes. Air Quality Impact Analysis Golden Valley Road Bridge Page 29
32 Level 2. Is the project in an area with an approved CO attainment or maintenance plan? No. Level 3. Is the project in an area with a submitted CO attainment or maintenance plan? Yes. In March 2005, the South Coast AQMD adopted a CO Redesignation Request and Maintenance Plan that provides for maintenance of the federal CO air quality standard until at least The AQMD also adopted a CO emissions budget that covers 2005 through On February 24, 2006, ARB transmitted the Redesignation Request and Maintenance Plan (including the CO budgets) to U.S. EPA for approval. In addition, on August 11, 2006, the ARB provided information to U.S. EPA that demonstrates the Smog Check program satisfies federal I&M requirements for CO and provides emission reductions necessary for continued improvement in CO air quality (CARB 2006c). Was the analysis in the attainment plan performed in sufficient detail to establish CO concentrations as a result of microscale modeling? Yes. Four intersections were modeled, including one intersection with a history of high CO episodic impacts and three of the most congested intersection in the air basin. Were impacts acceptable? Yes. Predicted CO would not exceed national or state ambient standards after Can CO concentrations in the area affected by the project under review be expected to be lower than those at location specifically modeled in the attainment plan? CO concentrations at an intersection would be lower than those reported for an intersection analyzed in the CO attainment plan if conditions a. through h. below are satisfied. The project intersection to be considered is Golden Valley Road North/Newhall Ranch Road The project traffic analysis prepared by Katz, Okitsu & Associates, July 2004 indicated that this intersection would operate at level of service (LOS) F under project build conditions in the design year. The intersection would not exist under No Build conditions nor would it exist at the opening year for the Golden Valley Road Bridge. Golden Valley Road North would not be constructed until some time after the completion of the bridge project. The traffic report also indicates that the intersection of Page 30 Air Quality Impact Analysis Golden Valley Road Bridge
33 Bouquet Canyon Road/San Fernando/Soledad Canyon Road/Valencia Boulevard would operate at LOS F under Build conditions. However, the operations would be improved over No Build conditions. Therefore, implementation of the project would not cause a CO hotspot at this intersection. The project analyzed in the traffic report consisted of the extension of Newhall Ranch Road by approximately 2 miles from its existing terminus at Bouquet Canyon Road to a future intersection with Golden Valley Road, and the extension of Golden Valley Road southwards to terminate approximately 2,000 feet north of Soledad Canyon Road at the terminus of the Golden Valley Road bridge project. The project scope has since been reduced in geographic extent to consist only of construction of the Golden Valley Road bridge, which is an approximate 1,100- foot-long bridge spanning the Santa Clara River. The 2005 SCAQMD CO maintenance plan contains analysis of four intersections, as shown in Table 5 (SCAQMD 2005). These intersections were originally analyzed in the 1992 attainment plan, and were also used in the 1997 and 2003 AQMPs. Table 5 Selected Intersections for the SCAQMD Attainment Plan CAL3QHC Hot Spot Modeling Analysis Intersection Long Beach Blvd. /Imperial Highway Wilshire Blvd./ Veteran Ave. Highland Ave./ Sunset Blvd. Century Blvd./ La Cienega Blvd. Description The Lynwood air monitoring stations consistently records the highest 8-hour CO concentrations in the Basin each year The most congested intersection in Los Angeles County. The average daily traffic volume is about 100,000 vehicles/day. One of the most congested intersections in the City of Los Angeles. The intersection study has been conducted and traffic data is available. One of the most congested intersections in the City of Los Angeles. The intersection study has been conducted and traffic data is available. a. The receptor locations at the intersection under study are the same distance or farther from the traveled roadway than the receptor locations used in the intersection for the attainment plan. The attainment plan intersections are all urban intersections with considerable pedestrian traffic, and it is assumed that receptors would be at the corners of the Air Quality Impact Analysis Golden Valley Road Bridge Page 31
34 intersections. The project intersection would be near the west end of the proposed bridge, where no pedestrian traffic or sensitive development is anticipated. The receptors at the project intersection would be at the same distance or farther from the traveled roadway than for the attainment intersections. b. The intersection traffic volumes and geometries are not significantly different. The attainment plan intersections are 4-way intersections at major arterials. The project intersection would be a 3-way intersection of a major arterial and a minor arterial. While the geometries are different, the project intersection would have fewer lanes. The project intersection traffic volume is forecast at approximately 49,000 ADT for Newhall Ranch Road and 18,000 ADT for Golden Valley Road North, for a total of 67,000 ADT. This would be considerably less than the 100,000 ADT at the attainment intersection of Wilshire Boulevard and Veteran Avenue, as shown in Table 5. c. Appropriately assumed meteorology for the intersections under study is the same or better that the assumed meteorology for the intersections in the attainment plan. It may be assumed that worst-case meteorology was used for the attainment plan analyses. It may also be assumed that meteorology at the project intersections is the same or better than the worst-case used in the attainment plan. d. Traffic lane volumes for all approach and departure segments are lower for the intersections under study that those assumed for the intersections in the attainment plan. Traffic lane volumes forecast for the Newhall Ranch Road/Golden Valley Road North intersection in the design year and for the Wilshire Boulevard/Veteran Avenue intersection analyzed in the attainment plan are shown in Table 6. Nearly all of the individual volumes shown in the table are lower for Golden Valley Road North, and the overall volumes are substantially lower. e. Percentages of vehicles operating in cold start mode are the same or lower for the intersection under study compared to those in the intersection in the attainment plan. The project intersection would have cold start vehicles in the AM coming from the residential areas that would be developed to the north on Golden Valley Road North, and to the west on Newhall Ranch Road. As there would be no major commercial or institutional complexes in the area, the PM cold start fraction would be much smaller. The attainment plan intersections would have cold start vehicles in the PM from workers leaving nearby institutional and commercial areas. As an example, there is a large federal office complex at Wilshire and Veteran, the Veteran s Administration Hospital, and UCLA nearby. Therefore, it is assumed that the percentage of cold start vehicles would be the same or less at the project intersection than at the attainment intersections. Page 32 Air Quality Impact Analysis Golden Valley Road Bridge
35 Table 6 Traffic Lane Volumes for Project and Attainment Plan Intersections Traffic Volumes PM peak hour Wilshire-Veteran Golden Valley Road North Newhall Ranch Approach-Through Eastbound Westbound Southbound Northbound Left Turn Eastbound Westbound 84 - Southbound Northbound Right Turn Eastbound - - Westbound Southbound Northbound f. Percentage of Heavy Duty Gas Trucks is the same or lower for the intersection under study compared to those in the intersection in the attainment plan. For the project intersection, some Heavy Duty Gas Trucks (HDGT) would be anticipated on Newhall Ranch Road, a through road, but very few would be expected on Golden Valley Road North, a feeder to a new, mostly residential area. The attainment plan intersections each support two through major roads, and each road is likely to carry HDGT. Thus, it is assumed that the percentage of HDGT at the project intersection would be the same or less than at the attainment plan intersections. g. Average delay and queue length for each approach is the same or smaller for the intersection under study compared to those found at the intersection in the attainment plan. Based on the considerable difference in intersection volumes, it is assumed that the average delay and queue length for each of the three approaches of the Newhall Ranch Road/Golden Valley Road North intersection would be less than any of the attainment intersections. Further, the fourth leg of the project intersection, being nonexistent, would have a zero queue length and delay, which would be much less than at the corresponding attainment plan intersection. Air Quality Impact Analysis Golden Valley Road Bridge Page 33
36 h. Background concentration in the area where the intersection under study is located is the same or lower than the background concentration used for the intersection in the attainment plan. The SCAQMD CO Redesignation Request and Maintenance Plan includes certified background CO data for the years (SCAQMD 2005). The attainment plan intersections are in receptor areas 1, 2, 3, and 12 Central Los Angeles, NW Coastal LA County, SW Coastal LA County, and South Central LA County, respectively. The lowest 8-hour CO values of these four areas were at NW Coastal LA County, with values of 3.0, 2.7, and 2.7 ppm for 2001, 2002, and 2003 respectively. For the same three years, the values for the Santa Clarita Valley were 3.1, 1.9, and 1.7. Although the 2001 value for Santa Clarita is slightly higher, it is seen that the overall background levels in the project area are the same or lower than in the areas of the attainment plan intersections. The project meets criteria a. through h. above. Therefore, in accordance with the Protocol, Section 4.3.2, the project is satisfactory and no further CO analysis is required. Particulate Matter - PM 10 The air quality studies for this project were initiated prior to March 10, 2006, the date the promulgation of the current rule that establishes the transportation conformity criteria and procedures for determining which transportation projects must be analyzed for local air quality impacts in PM 10 nonattainment and maintenance areas. Therefore, this project is subject to follow the Particulate Matter and Transportation Projects, An Analysis Protocol dated February 23, 2005 (Caltrans 2005, 2006.) The initial step of the PM 10 protocol is to determine eligibility of the project. A project may immediately be screened out if there are no receptors within 100 meters of the proposed project location (Caltrans 2005). The following information is provided about receptors in the proposed project location: Existing development in the project vicinity, Figure 3, include: - The Greenbrier Estates mobile home community, near the northwest quadrant of Soledad Canyon Road and Golden Valley Road; the closest home in the community is more than 1,000 feet from the southern terminus of the bridge project. - The industrial park at the northeast quadrant of Soledad Canyon Road and Golden Valley Road; the closest building in the complex is approximately 500 feet east of the southern Page 34 Air Quality Impact Analysis Golden Valley Road Bridge
37 terminus of the bridge project. There are no exterior areas of frequent human use in the western areas of the industrial park. The provided information on two planned developments in the project vicinity, also shown in Figure 3: - Riverpark, Area C, a community of multi-family buildings, would be built north of Newhall Ranch Road and west of the future section of Golden Valley Road that would extend to the north from Newhall Ranch Road west of the Golden Valley Road Bridge. The closest building to the project would be approximately 800 feet northwest of the northwest terminus of the bridge. - The Keystone, a community including single family homes, a school, and a YMCA would be built on both sides of future Golden Valley Road. The southernmost extent of the project would be more than 1,200 feet northeast of the bridge. For purposes of assessing the requirement for a for further PM 10 conformity analysis, it is concluded that there are no receptors within 100 meters (330 feet) of the proposed project area. Therefore, no further analysis is necessary. Particulate Matter - PM 2.5 On March 10, 2006, the EPA published a final rule that establishes the transportation conformity criteria and procedures for determining which transportation projects must be analyzed for local air quality impacts in PM 2.5 and PM 10 nonattainment and maintenance areas. Based on that rule, the EPA and FHWA published Transportation Conformity Guidance for Qualitative Hot-spot Analyses in PM 2.5 and PM 10 Nonattainment and Maintenance Areas (PM Guidance) (FHWA 2006b). As noted above, this rule does not apply to PM 10 analysis for the proposed project. A hot-spot analysis is defined in 40 CFR as an estimation of likely future localized PM 2.5 or PM 10 pollutant concentrations and a comparison of those concentrations to the relevant air quality standards. A hot-spot analysis assesses the air quality impacts on a scale smaller than an entire nonattainment or maintenance area, including, for example, congested roadway intersections and highways or transit terminals. Such an analysis is a means of demonstrating that a transportation project meets Clean Air Act conformity requirements to support state and local air quality goals with respect to potential localized air quality impacts. When a hot-spot Air Quality Impact Analysis Golden Valley Road Bridge Page 35
38 analysis is required, it is included within the project-level conformity determination that is made by FHWA or the Federal Transit Administration (FTA). The March 2006 PM guidance document describes qualitative hot-spot analyses. Quantitative PM 2.5 hot-spot analyses will be required when appropriate methods and modeling guidance are available. Qualitative hot-spot analyses involve more streamlined reviews of local factors such as local monitoring data near a proposed project location. Projects of Air Quality Concern To meet statutory requirements, the March 10, 2006 final rule requires PM2.5 hot-spot analyses to be performed for projects of air quality concern. Qualitative hot-spot analyses would be done for these projects. Projects not identified as projects of air quality concern have also met statutory requirements without any further hot-spot analyses. Projects of air quality concern (POAQC) are projects within a PM 2.5 nonattainment or maintenance area, funded or approved by FHWA or FTA, and are one of the following types of projects: New or expanded highway projects that have a significant number of or significant increase in diesel vehicles; Projects affecting intersections that are Level-of-Service (LOS) D, E, or F with a significant number of diesel vehicles, or those that will change to LOS D, E, or F, because of increased traffic volumes from a significant number of diesel vehicles related to the project; New bus and rail terminals, and transfer points, that have a significant number of diesel vehicles congregating at a single location; Expanded bus and rail terminals, and transfer points, that significantly increase the number of diesel vehicles congregating at a single location; and Projects in, or affecting locations, areas, or categories of sites which are identified in the PM 2.5 applicable implementation plan or implementation plan submission, as appropriate, as sites of violation or possible violation. The evaluation of a project as a potential POAQC is performed by an interagency consultation, a process described in the Transportation Conformity Rule. In the SCAB, the interagency Page 36 Air Quality Impact Analysis Golden Valley Road Bridge
39 consultation is performed by the Southern California Transportation Conformity Working Group (TCWG), organized by SCAG. Membership of the TCWG includes federal (US EPA, US EPA Region 9, FHWA, FTA), state (CA Air Resources Board, Caltrans), regional (Air Quality Management Districts, SCAG, etc.), and sub-regional (County Transportation Commissions) agencies and other stakeholders (SCAG 2007). The GVRB project was submitted to the January 30, 2007 TCWG meeting. No determination was made at the meeting, pending review by an EPA representative who could not be present. The EPA representative reviewed the project information and provided an opinion on February 7, 2007 (EPA 2007), and the project was determined to be not a POAQC (SCAG 2007b). The project PM 2.5 interagency review forms submitted to the TCWG, the minutes of the January 30, 2007 TCWG meeting, and the February 7, 2007 confirming from the USEPA Region IX are included as Appendix C to this report. Mobile Source Air Toxics The following discussion is based on the FHWA Memorandum, Subject: INFORMATION: Interim Guidance on Air Toxic Analysis in NEPA Documents, dated February 3, The purpose of the guidance is to advise when and how to analyze MSAT in the NEPA process for highways. This guidance is interim, because MSAT science is still evolving. As the science progresses, FHWA will update the guidance. Introduction to MSAT In addition to the criteria air pollutants for which there are National Ambient Air Quality Standards (NAAQS), EPA also regulates air toxics. Most air toxics originate from human-made sources, including on-road mobile sources, non-road mobile sources (e.g., airplanes), area sources (e.g., dry cleaners) and stationary sources (e.g., factories or refineries). MSATs are a subset of the 188 air toxics defined by the Clean Air Act. The MSATs are compounds emitted from highway vehicles and non-road equipment. Some toxic compounds are present in fuel and are emitted to the air when the fuel evaporates or passes through the engine unburned. Other toxics are emitted from the incomplete combustion of fuels or as secondary combustion products. Metal air toxics also result from engine wear or from impurities in oil or gasoline. Air Quality Impact Analysis Golden Valley Road Bridge Page 37
40 The EPA is the lead Federal Agency for administering the Clean Air Act and has certain responsibilities regarding the health effects of MSATs. The EPA issued a Final Rule on Controlling Emissions of Hazardous Air Pollutants from Mobile Sources. 66 FR (March 29, 2001). This rule was issued under the authority in Section 202 of the Clean Air Act. In its rule, EPA examined the impacts of existing and newly promulgated mobile source control programs, including its reformulated gasoline (RFG) program, its national low emission vehicle (NLEV) standards, its Tier 2 motor vehicle emissions standards and gasoline sulfur control requirements, and its proposed heavy duty engine and vehicle standards and on-highway diesel fuel sulfur control requirements. Between 2000 and 2020, FHWA projects that even with a 64 percent increase in VMT, these programs will reduce on-highway emissions of benzene, formaldehyde, 1,3-butadiene, and acetaldehyde by 57 percent to 65 percent, and will reduce onhighway diesel PM emissions by 87 percent. As a result, EPA concluded that no further motor vehicle emissions standards or fuel standards were necessary to further control MSATs. The agency is preparing another rule under authority of CAA Section 202(l) that will address these issues and could make adjustments to the full 21 and the primary six MSATs. Unavailable Information for Project Specific MSAT Impact Analysis This air quality impact study includes a basic analysis of the likely MSAT emission impacts of this project. However, available technical tools do not enable us to predict the project-specific health impacts of the emission changes associated with implementation of the proposed project. Due to these limitations, the following discussion is included in accordance with CEQ regulations (40 CFR (b)) regarding incomplete or unavailable information: Information that is Unavailable or Incomplete. Evaluating the environmental and health impacts from MSATs on a proposed highway project would involve several key elements, including emissions modeling, dispersion modeling in order to estimate ambient concentrations resulting from the estimated emissions, exposure modeling in order to estimate human exposure to the estimated concentrations, and then final determination of health impacts based on the estimated exposure. Each of these steps is encumbered by technical shortcomings or uncertain science that prevents a more complete determination of the MSAT health impacts of this project. Page 38 Air Quality Impact Analysis Golden Valley Road Bridge
41 Emissions: The EPA tools to estimate MSAT emissions from motor vehicles are not sensitive to key variables determining emissions of MSATs in the context of highway projects. While MOBILE 6.2 and is used to predict emissions at a regional level, it has limited applicability at the project level. MOBILE 6.2 is a tripbased model--emission factors are projected based on a typical trip of 7.5 miles, and on average speeds for this typical trip. This means that MOBILE 6.2 does not have the ability to predict emission factors for a specific vehicle operating condition at a specific location at a specific time. Because of this limitation, MOBILE 6.2 can only approximate the operating speeds and levels of congestion likely to be present on the largest-scale projects, and cannot adequately capture emissions effects of smaller projects. 1 For particulate matter, the model results are not sensitive to average trip speed, although the other MSAT emission rates do change with changes in trip speed. Also, the emissions rates used in MOBILE 6.2 for both particulate matter and MSATs are based on a limited number of tests of mostly older-technology vehicles. Lastly, in its discussions of PM under the conformity rule, EPA has identified problems with MOBILE6.2 as an obstacle to quantitative analysis. These deficiencies compromise the capability of MOBILE 6.2 to estimate MSAT emissions. MOBILE6.2 is an adequate tool for projecting emissions trends, and performing relative analyses between alternatives for very large projects, but it is not sensitive enough to capture the effects of travel changes tied to smaller projects or to predict emissions near specific roadside locations. Dispersion. The tools to predict how MSATs disperse are also limited. The EPA's current regulatory models, CALINE3 and CAL3QHC, were developed and validated more than a decade ago for the purpose of predicting episodic concentrations of carbon monoxide to determine compliance with the NAAQS. The performance of dispersion models is more accurate for predicting maximum concentrations that can occur at some time at some location within a geographic area. This limitation makes it difficult to predict accurate exposure patterns at specific times at specific highway project locations across an urban area to assess potential health risk. The National Cooperative Highway Research Program is conducting research on best practices in applying models and other technical methods in the analysis of MSATs. This work also will focus on identifying appropriate methods of documenting and communicating MSAT impacts in the NEPA 1 For purposes of MSAT discussion, smaller projects are those with average daily traffic volumes of less than 140,000, as explained below. Air Quality Impact Analysis Golden Valley Road Bridge Page 39
42 process and to the general public. Along with these general limitations of dispersion models, FHWA is also faced with a lack of monitoring data in most areas for use in establishing project-specific MSAT background concentrations. Exposure Levels and Health Effects. Finally, even if emission levels and concentrations of MSATs could be accurately predicted, shortcomings in current techniques for exposure assessment and risk analysis preclude us from reaching meaningful conclusions about project-specific health impacts. Exposure assessments are difficult because it is difficult to accurately calculate annual concentrations of MSATs near roadways, and to determine the portion of a year that people are actually exposed to those concentrations at a specific location. These difficulties are magnified for 70-year cancer assessments, particularly because unsupportable assumptions would have to be made regarding changes in travel patterns and vehicle technology (which affects emissions rates) over a 70-year period. There are also considerable uncertainties associated with the existing estimates of toxicity of the various MSATs, because of factors such as low-dose extrapolation and translation of occupational exposure data to the general population. Because of these shortcomings, any calculated difference in health impacts between alternatives is likely to be much smaller than the uncertainties associated with calculating the impacts. Consequently, the results of such assessments would not be useful to decision makers, who would need to weigh this information against other project impacts that are better suited for quantitative analysis. Summary of Existing Credible Scientific Evidence Relevant to Evaluating the Impacts of MSATs. Research into the health impacts of MSATs is ongoing. For different emission types, there are a variety of studies that show that some either are statistically associated with adverse health outcomes through epidemiological studies (frequently based on emissions levels found in occupational settings) or that animals demonstrate adverse health outcomes when exposed to large doses. Exposure to toxics has been a focus of a number of EPA efforts. Most notably, the agency conducted the National Air Toxics Assessment (NATA) in 1996 to evaluate modeled estimates of human exposure applicable to the county level. While not intended for use as a measure of or benchmark for local exposure, the modeled estimates in the NATA database best illustrate the levels of various toxics when aggregated to a national or State level. Page 40 Air Quality Impact Analysis Golden Valley Road Bridge
43 The EPA is in the process of assessing the risks of various kinds of exposures to these pollutants. The EPA Integrated Risk Information System (IRIS) is a database of human health effects that may result from exposure to various substances found in the environment. The IRIS database is located at The following toxicity information for the six prioritized MSATs was taken from the IRIS database Weight of Evidence Characterization summaries. This information is taken verbatim from EPA's IRIS database and represents the Agency's most current evaluations of the potential hazards and toxicology of these chemicals or mixtures. Benzene is characterized as a known human carcinogen. The potential carcinogenicity of acrolein cannot be determined because the existing data are inadequate for an assessment of human carcinogenic potential for either the oral or inhalation route of exposure. Formaldehyde is a probable human carcinogen, based on limited evidence in humans, and sufficient evidence in animals. 1,3-butadiene is characterized as carcinogenic to humans by inhalation. Acetaldehyde is a probable human carcinogen based on increased incidence of nasal tumors in male and female rats and laryngeal tumors in male and female hamsters after inhalation exposure. Diesel exhaust (DE) is likely to be carcinogenic to humans by inhalation from environmental exposures. Diesel exhaust as reviewed in this document is the combination of diesel particulate matter and diesel exhaust organic gases. Diesel exhaust also represents chronic respiratory effects, possibly the primary noncancer hazard from MSATs. Prolonged exposures may impair pulmonary function and could produce symptoms, such as cough, phlegm, and chronic bronchitis. Exposure relationships have not been developed from these studies. There have been other studies that address MSAT health impacts in proximity to roadways. The Health Effects Institute, a non-profit organization funded by EPA, FHWA, and industry, has undertaken a major series of studies to research near-roadway MSAT hot spots, the health implications of the entire mix of mobile source pollutants, and other topics. The final summary of the series is not expected for several years. Some recent studies have reported that proximity to roadways is related to adverse health outcomes particularly respiratory problems1. Much of this research is not specific to MSATs, instead surveying the full spectrum of both criteria and other pollutants. The FHWA cannot evaluate the validity of these studies, but more importantly, they do not provide information that Air Quality Impact Analysis Golden Valley Road Bridge Page 41
44 would be useful to alleviate the uncertainties listed above and enable us to perform a more comprehensive evaluation of the health impacts specific to this project. Relevance of Unavailable or Incomplete Information to Evaluating Reasonably Foreseeable Significant Adverse Impacts on the Environment, and Evaluation of Impacts Based Upon Theoretical Approaches or Research Methods Generally Accepted in The Scientific Community. Because of the uncertainties outlined above, a quantitative assessment of the effects of air toxic emissions impacts on human health cannot be made at the project level. While available tools do allow us to reasonably predict relative emissions changes between alternatives for larger projects, the amount of MSAT emissions from the proposed project and MSAT concentrations or exposures created by the project emissions cannot be predicted with enough accuracy to be useful in estimating health impacts. (As noted above, the current emissions model is not capable of serving as a meaningful emissions analysis tool for smaller projects.) Therefore, the relevance of the unavailable or incomplete information is that it is not possible to make a determination of whether any of the alternatives would have "significant adverse impacts on the human environment." The impact evaluation below provides a qualitative assessment of MSAT emissions and acknowledges that the proposed project may result in increased exposure to MSAT emissions in certain locations, although the concentrations and duration of exposures are uncertain, and because of this uncertainty, the health effects from these emissions cannot be estimated. Evaluation of Project MSAT Potential The FHWA has developed a tiered approach for analyzing MSATs in NEPA documents. Depending on the specific project circumstances, FHWA has identified three levels of analysis: No analysis for projects with no potential for meaningful MSAT effects, Category (1); Qualitative analysis for projects with low potential MSAT effects, Category (2); or Quantitative analysis to differentiate alternatives for projects with higher potential MSAT effects, Category (3). The proposed project is a Category (2) project, that is, the project would have a low potential for MSAT effects. This assessment is based on FHWA guidance that projects that do not meet the Page 42 Air Quality Impact Analysis Golden Valley Road Bridge
45 criteria for Category (1) or Category (3) should be included in Category (2). Category (1) is limited to projects that: qualify as a categorical exclusion under 23 CFR (c); are exempt under the Clean Air Act conformity rule under 40 CFR ; or have no meaningful impacts on traffic volumes or vehicle mix. The Golden Valley Road Bridge project does not meet any of these requirements. For a project to be of the magnitude to have a higher potential for MSAT effects, Category (3), a project must: Create or significantly alter a major intermodal freight facility that has the potential to concentrate high levels of diesel particulate matter in a single location; or Create new or add significant capacity to urban highways such as interstates, urban arterials, or urban collector-distributor routes with traffic volumes where the AADT is projected to be in the range of 140,000 to 150,000, or greater, by the design year; And also: be proposed to be located in proximity to populated areas or in rural areas, in proximity to concentrations of vulnerable populations (i.e., schools, nursing homes, hospitals). The Golden Valley Road Bridge project would be part of the Cross Valley Connector East. While new capacity would be facilitated, the associated roadway with an estimated maximum AADT of 50,000 would have design year volume much less than the FHWA threshold value of 140,000 AADT as the minimum volume for higher potential MSAT effects (FHWA 2006a). Further, there are no sensitive receptors near the planned Golden Valley Bridge. The closest existing residential receptors are more than 1,000 feet away. The closest planned residential development is approximately 800 feet away. The closest commercial/industrial development is approximately 500 feet away. Therefore, the project would be included in Category (2), projects with low potential for MSAT effects. Evaluation of Project MSAT Impacts As discussed above, technical shortcomings of emissions and dispersion models and uncertain science with respect to health effects prevent meaningful or reliable estimates of MSAT emissions and effects of this project. However, even though reliable methods do not exist to accurately estimate the health impacts of MSATs at the project level, it is possible to qualitatively assess the levels of future MSAT emissions under the project. Although a Air Quality Impact Analysis Golden Valley Road Bridge Page 43
46 qualitative analysis cannot identify and measure health impacts from MSATs, it can give a basis for identifying and comparing the potential differences among MSAT emissions-if any-from the various alternatives. The qualitative assessment presented below is derived in part from a study conducted by the FHWA entitled A Methodology for Evaluating Mobile Source Air Toxic Emissions Among Transportation Project Alternatives, found at: The proposed bridge, along with other approved segments and intersection improvements under construction, will complete the Cross Valley Connector. The Cross Valley Connector will significantly increase east-west roadway capacity between the I-5/SR 126 and SR 14, thereby providing relief to currently congested arterial roadways. The amount of MSATs emitted would be proportional to the vehicle miles traveled, or VMT, for the Build and No Build alternatives, assuming that other variables such as fleet mix are the same. The VMT have not been estimated for the two alternatives. With respect to through traffic, that is, traffic that does not originate or terminate in the project area, the VMT for the Build Alternative could be more or less than for the No Build Alternative depending on whether this new roadway results in shorter or longer travel distance for the drivers attracted to this route in order to avoid existing congested roadways. Overall, the VMT might be anticipated to be greater because the Cross Valley Connector would facilitate new development that would generate and attract trips that were not occurring in this area before. This increase in VMT means MSATs under the Build Alternative would probably be higher than the No Build Alternative in the study area. There could also be localized differences in MSATs from indirect effects of the project such as associated access traffic, emissions of evaporative MSATs (e.g., benzene) from parked cars, and emissions of diesel particulate matter from delivery trucks, depending on the type and extent of development. Operation of this section of the Cross Valley Connector would lead to higher MSAT emissions along the alignment, with a corresponding decrease in MSAT emissions along the roadways in the network that lose traffic to this route. Emissions along the new roadway in future years will likely be lower than initial levels as a result of the EPA s national control programs that are projected to reduce MSAT emissions by 57 to 87 percent between 2000 and Local conditions may differ from these national projections in terms of fleet mix and turnover, VMT growth rates, and local control measures. However, the magnitude of the EPA-projected reductions is so great, even after accounting for an average national annual VMT growth, that MSAT emissions in the study area are likely to decrease in the future in nearly all cases. The building of the Golden Valley Road Bridge and Cross Valley Connector East would have the effect of moving some traffic closer to some homes, schools and businesses; therefore, with the proposed project there may be localized areas where ambient concentrations of MSATs could Page 44 Air Quality Impact Analysis Golden Valley Road Bridge
47 be higher than with the No Build Alternative. However, as discussed above, the magnitude and the duration of these potential increases compared to the No Build alternative cannot be accurately quantified due to the inherent deficiencies of current models. In summary, with the Build Alternative, the localized level of MSAT emissions near the Cross Valley Connector would be higher relative to the No Build Alternative. MSATs will be lower in other locations when traffic shifts away from them. On a regional basis, EPA s vehicle and fuel regulations, coupled with fleet turnover, would over time cause substantial reductions that, in almost all cases, will cause region-wide MSAT levels to be significantly lower than currently observed (FHWA 2006a). 5.2 CONSTRUCTION EMISSIONS The following analysis is included in this report for use by the in CEQA analysis. SCAQMD has established thresholds of significance for air quality for construction activities and project operation as shown in Table 6. Only the thresholds pertaining to construction are applicable to this project. The principal sources of pollutant emissions during construction are fugitive dust and engine exhaust from construction equipment. Fugitive dust would be created during site clearing, excavation, and grading; vehicle travel on paved and unpaved roads; and material blown from unprotected graded areas, stockpiles, and haul trucks. Fugitive dust includes PM 10 and PM 2.5, which are potential health hazards and often contribute to visibility and nuisance impacts that occur when dust from construction activities is deposited on residences, vehicles, and vegetation. In construction equipment exhaust, the principal pollutants of concern are NO X and ROC, the primary constituents in the formation of O 3, a pollutant for which the region is currently considered in nonattainment. Maximum Daily Thresholds Emissions were estimated using the Roadway Construction Emissions Model, Version 5.1. This model was developed and published by the Sacramento Metropolitan Air Quality Management District (SMAQMD 2003). The model uses vehicle, off-road equipment, and fugitive dust emission factors consistent with EMFAC 2002 and URBEMIS 2002, which are models developed by or under the sponsorship of the California Air Resources Board. Default values were used for the mix of construction equipment, number of workers and commute distance, soil hauling distances, and project phasing. A construction start year of 2007 was assumed. Air Quality Impact Analysis Golden Valley Road Bridge Page 45
48 Table 6 SCAQMD Air Quality Significance Thresholds Mass Daily Thresholds Pollutant Construction Operation NO X 100 lbs/day 55 lbs/day VOC 1 75 lbs/day 55 lbs/day PM lbs/day 150 lbs/day SO X 150 lbs/day 150 lbs/day CO 550 lbs/day 550 lbs/day Lead 3 lbs/day 3 lbs/day Toxic Air Contaminants (TACs) and Odor Thresholds TACs (including carcinogens and non-carcinogens) Odor NO 2 1-hour average annual average PM hour average Maximum Incremental Cancer Risk 10 in 1 million Hazard Index 1.0 (project increment) Hazard Index 3.0 (facility-wide) Project creates an odor nuisance pursuant to SCAQMD Rule 402 Ambient Air Quality for Criteria Pollutants annual geometric average annual arithmetic mean Sulfate 24-hour average 25 μg/m 3 CO SCAQMD is in attainment; project is significant if it causes or contributes to an exceedance of the following attainment standards: 0.25 ppm (state) ppm (federal) 10.4 μg/m 3 (recommended for construction) e 2.5 μg/m 3 (operation) 1.0 μg/m 3 20 μg/m 3 SCAQMD is in attainment; project is significant if it causes or contributes to an exceedance of the following attainment standards: 20 ppm (state) 9.0 ppm (state/federal) 1-hour average 8-hour average Lbs/day = pounds per day; ppm = parts per million; μg/m 3 = microgram per cubic meter 1 VOC volatile organic compounds. For purposes of this report, VOC are the same as ROC, and ROC is the term used for this report. Source: SCAQMD 2006b Table 7 presents the estimated daily emissions from construction of the bridge. No mitigation or emission reduction measures have been included in the calculations. Details of constructionrelated emission calculations are included in Appendix A. As shown in Table 7, all estimated bridge construction emissions would be less than the CEQA significance thresholds. Page 46 Air Quality Impact Analysis Golden Valley Road Bridge
49 Table 7 Estimated Bridge Construction Emissions Project Phases (English Units) a ROC (lbs/day) CO (lbs/day) NO X (lbs/day) b PM 10 (lbs/day) Grubbing/Land Clearing Grading/Excavation Drainage/Utilities/Sub-Grade Paving Maximum SCAQMD CEQA Significance Threshold (from Table 6) Threshold exceeded? No No No No a Assumes construction start in 2007 with duration of 12 months. b Assumes 3 acres of disturbance per day; 10 acres of total disturbed area; 1 water truck. Source: Sacramento Air Quality Management District, Road Construction Model 5.1 Ambient Air Quality for Criteria Pollutants Local Concentrations The SCAQMD thresholds shown in Table 6 for local pollutant concentrations include CO and PM 10 criteria. As described in Section 5.1 above, there is no potential for a significant local concentration of these pollutants. Further, because potential receptors are more than 300 meters (984 feet) away from the construction site, it is concluded that local ambient air quality impacts from construction would not be significant. Toxic Air Contaminants (TAC) - Diesel Exhaust Emissions The only TAC of concern for the proposed project would be particulate exhaust emissions from diesel-fueled engines (diesel PM). Diesel PM was identified as a TAC by the CARB in Construction of the project would result in the generation of diesel PM emissions from the use of off-road diesel equipment required for site grading and excavation, paving, and other construction activities. According to the CARB, the potential cancer risk from the inhalation of diesel PM, as discussed below, outweighs the potential non-cancer health impacts (ARB 2003b). Diesel PM emissions continue to be reduced since the identification of this TAC. In January 2001, the EPA promulgated a Final Rule to reduce emission standards for 2007 and subsequent model year heavy-duty diesel engines. These emission standards represent a 90 percent reduction of oxides of nitrogen emissions, 72 percent reduction of non-methane hydrocarbon emissions, and 90 percent reduction of particulate matter emissions compared to the 2004 model year emission standards. In December 2004, the CARB adopted a fourth phase of emission standards Air Quality Impact Analysis Golden Valley Road Bridge Page 47
50 (Tier 4) that are nearly identical to those finalized by the EPA on May 11, 2004, in its Clean Air Nonroad Diesel Rule. As such, engine manufacturers are now required to meet aftertreatmentbased exhaust standards for particulate matter (PM) and NOx starting in 2011 that are over 90 percent lower than current levels, putting off-road engines on a virtual emissions par with onroad heavy-duty diesel engines (ARB 2006f). The dose to which receptors are exposed is the primary factor used to determine health risk (i.e., potential exposure to TAC emission levels that exceed applicable standards). Dose is a function of the concentration of a substance or substances in the environment and the duration of exposure to the substance. Dose is positively correlated with time, meaning that a longer exposure period would result in a higher exposure level for the maximally exposed individual. Thus, the risks estimated for a maximally exposed individual are higher if a fixed exposure occurs over a longer period of time. According to the Office of Environmental Health Hazard Assessment (OEHHA), health risk assessments, which determine the exposure of sensitive receptors to TAC emissions, should be based on a 70-year exposure period; however, such assessments should be limited to the period/duration of activities associated with the project. Thus, because the use of mobilized equipment would be temporary, and the nearest receptors are more than 300 meters (984 feet) from the project site, it is concluded that short-term construction activities would not expose sensitive receptors to substantial TAC concentrations and the impact would not be significant. Odors Minor sources of odors would be present during construction of the bridge. The predominant source of power for construction equipment is diesel engines. Exhaust odors from diesel engines, as well as emissions associated with asphalt paving may be considered offensive to some individuals. However, because odors would be temporary and would disperse rapidly with distance from the source, construction-generated odors would not result in the frequent exposure of receptors to objectionable odorous emissions. As a result, construction-related odors would not be significant. Page 48 Air Quality Impact Analysis Golden Valley Road Bridge
51 SECTION 6.0 POLLUTION MITIGATION AND ABATEMENT MEASURES As shown in Section 5.2, pollutant emissions during construction would be less than SCAQMD thresholds, and would not be significant. No mitigation measures would be required. It is assumed that the will comply with applicable SCAQMD Rules and Regulations, which will therefore minimize pollutant emissions. One Rule of importance is Rule 403, Fugitive Dust. One requirement of Rule 403 is that No person shall conduct active operations without utilizing the applicable best available control measures included in Table 1 of this Rule to minimize fugitive dust emissions from each fugitive dust source type within the active operation. Table 1 of Rule 403 is attached as Appendix B to this report. Air Quality Impact Analysis Golden Valley Road Bridge Page 49
52 This page intentionally left blank. Page 50 Air Quality Impact Analysis Golden Valley Road Bridge
53 SECTION 7.0 REFERENCES California Air Resources Board (ARB) 2003 Resolution October a California Almanac of Emissions and Air Quality Edition. Available at b Ambient Air Quality Standards. Available at Page last updated on 11/10/ c California State Implementation Plan (SIP) for Carbon Monoxide (CO) in the South Coast Air Basin. Page updated September 19, Available at sccosip05/sccosip05.htm 2006d California Air Quality Area Designations. Available at aqd/aqd.htm. 2006e California Air Quality Data. Available at f Facts About California s Accomplishments In Reducing Diesel Particulate Matter Emissions. Available at California Department of Transportation (Caltrans) 2005 Particulate Matter and Transportation Projects, An Analysis Protocol. Prepared for Caltrans and FHWA. February Memorandum from Andrew Yoon, STE, Air Quality Branch, Office of Environmental Engineering and Corridor Studies, Caltrans District 7, to Chris Benz-Blumberg, Environmental Planner, Division of Environmental Planning; subject: Project-Level Air Quality Review of the Air Quality Impact Analysis for Cross Valley Connector East at the (3rd Submittal). November 1. Air Quality Impact Analysis Golden Valley Road Bridge Page 51
54 2006b Caltrans Division of Environmental Analysis, CO Protocol. Available at Page last updated September 23, 2006; material downloaded November 14, c from Caltrans District 7 to EDAW. November 16. Federal Highway Administration (FHWA) 2006a Memorandum. Information: Interim Guidance on Air Toxic Analysis in NEPA Documents. From Cynthia J. Burbank, Associate Administrator for Planning, Environment and Realty. February b Transportation Conformity Guidance for Qualitative Hot-Spot Analyses in PM 2.5 and PM 10 Nonattainment and Maintenance Areas. March. Available at < Federal Register 2004 Transportation Conformity Rule Amendments for the New 8-hour Ozone and PM 2.5 National Ambient Air Quality Standards and Miscellaneous Revisions for Existing Areas; Transportation Existing Areas; Transportation Conformity Rule Amendments: Response to Court Decision and Additional Rule Changes. Available through FHWA web site, Transportation Conformity Rulemakings, at Accessed November 13, Katz, Okitsu & Associates 2004 Traffic Report for the Proposed Golden Valley Road and Newhall Ranch Road Projects in the, California. Fourth Update July 16. Sacramento Metropolitan Air Quality Management District 2003 Road Construction Emissions Model, Version 5.1. Available at airquality.org/ceqa/index.shtml. South Coast Air Quality Management District (SCAQMD) 1993 CEQA Air Quality Handbook. April Carbon Monoxide Redesignation Request and Maintenance Plan. February. Page 52 Air Quality Impact Analysis Golden Valley Road Bridge
55 Air Quality Management Plan. Available at AQMD03AQMP.htm. 2006b Notice of Public Workshops, Draft 2007 Air Quality Management Plan. Available at Accessed November 18, c Draft 2007 Air Quality Management Plan. Southern California Association of Governments (SCAG) 2006 Regional Transportation Plans and Regional Transportation Improvement Programs. Available at Information for this report accessed on July 17, and November 6 and 15, b 2006 Regional Transportation Program (2006 RTIP), Volume I of III 2007 Transportation Conformity Working Group. Available at b TCWG Project-Level PM Hot Spot Analysis Project Lists Review of PM Hot Spot Interagency Review Forms. JANUARY AVAILABLE AT UC Davis Institute of Transportation Studies (UCD ITS) 1997 Transportation project-level carbon monoxide protocol. December. Davis, CA. U.S. Department of Transportation (USDOT) 2006 Letter from Gene K. Fong (USDOT) to Mark Pisano (SCAG) re. Conformity Determination for SCAG s 2006 Regional Transportation Improvement. October 2. U.S. Environmental Protection Agency (EPA) 2005 National Ambient Air Quality Standards (NAAQS). Available at Green Book, Criteria Pollutant Area Summary Report. Available at Air Quality Impact Analysis Golden Valley Road Bridge Page 53
56 2006b AirData: Access to Air Pollution Data. Available at air/data/index.html 2006c National Ambient Air Quality Standards (NAAQS), available at Page last updated October 20, Accessed October 20, from Karina OConnor (EPA) to Jonathan Nadler (SCAG). Subject: Please Review -TCWG PM2.5 Project. February 7. Western Regional Climate Center (WRCC) 2004 San Fernando, California, Period of Record Monthly Climate Summary: Period of Record: 12/1/1927 to 3/31/1974, Available at summary/climsmsca.html. Page 54 Air Quality Impact Analysis Golden Valley Road Bridge
57 APPENDIX A CONSTRUCTION EMISSIONS WORKSHEETS
58
59 Road Construction Emissions Model, Version 5.1 Golden Valley Road Bridge Emission Estimates for -> Exhaust Fugitive Dust Project Phases (English Units) ROG (lbs/day) CO (lbs/day) NOx (lbs/day) PM10 (lbs/day) PM10 (lbs/day) PM10 (lbs/day) Grubbing/Land Clearing Grading/Excavation Drainage/Utilities/Sub-Grade Paving Maximum (pounds/day) Total (tons/construction project) <-tons Notes: Project Start Year -> 2007 Project Length (months) -> 12 Total Project Area (acres) -> 10 Maximum Area Disturbed/Day (acres) -> 3 Total Soil Imported/Exported (yd 3 /day)-> 300 PM10 estimates assume 50% control of fugitive dust from watering and associated dust control measures if a minimum number of water trucks are specified. Total PM10 emissions shown in column F are the sum of exhaust and fugitive dust emissions shown in columns H and I. Golden Valley Road Bridge Emission Estimates for -> Exhaust Fugitive Dust Project Phases (Metric Units) ROG (kgs/day) CO (kgs/day) NOx (kgs/day) PM10 (kgs/day) PM10 (kgs/day) PM10 (kgs/day) Grubbing/Land Clearing Grading/Excavation Drainage/Utilities/Sub-Grade Paving Maximum (kilograms/day) Total (megagrams/construction project) <-megagrams Notes: Project Start Year -> 2007 Project Length (months) -> 12 Total Project Area (hectares) -> 4 Maximum Area Disturbed/Day (hectares) -> 1 Total Soil Imported/Exported (meters 3 /day)-> 229 PM10 estimates assume 50% control of fugitive dust from watering and associated dust control measures if a minimum number of water trucks are specified. Total PM10 emissions shown in column F are the sum of exhaust and fugitive dust emissions shown in columns H and I.
60 Road Construction Emissions Model Version 5.1 Data Entry Worksheet Note: Required data input sections have a yellow background. Optional data input sections have a blue background. Only areas with a yellow or blue background can be modified. Program defaults have a white background. The user is required to enter information in cells C10 through C28. Input Type Project Name Golden Valley Road Bridge Construction Start Year 2007 Enter a Year between 2000 and 2010 inclusive Project Type 1 New Road Construction 3 2 Road Widening 3 Bridge/Overpass Construction Project Construction Time 12 months Predominate Soil/Site Type: Enter 1, 2, or 3 1. Sand Gravel 1 2. Weathered Rock-Earth 3. Blasted Rock On-Road Emission Factors: Enter 1, 2, or 3 1. Emfac7fv Emfac Emfac7G 3. Emfac2001 Project Length 0.33 miles Total Project Area 10 acres To begin a new project, click this button to clear data previously entered. This button will only work if you opted not to disable macros when loading this spreadsheet. Maximum Area Disturbed/Day Water Trucks Used? 1 Soil Imported Soil Exported Average Truck Capacity 3 acres 1. Yes 2. No 300 yd 3 /day 0 yd 3 /day 20 yd 3 (assume 20 if unknown)
61 The remaining sections of this sheet contain areas that can be modified by the user, although those modifications are optional. Note: The program's estimates of construction period phase length can be overridden in cells C37 through C40. Program User Override of Calculated Construction Periods Construction Months Months 2000 % 2001 % 2002 Grubbing/Land Clearing Grading/Excavation Drainage/Utilities/Sub-Grade Paving Totals 0 12 Hauling emission default values can be overridden in cells C48 through C50. Soil Hauling Emissions User Override of User Input Soil Hauling Defaults Default Values Miles/round trip 30 Round trips/day 15 Vehicle miles traveled/day (calculated) Hauling Emissions ROG NOx CO PM10 Emission rate (grams/mile) Pounds per day Tons per contruction period
62 Worker commute default values can be overridden in cells C62 through C67. User Override of Worker Worker Commute Emissions Commute Default Values Default Values Miles/ one-way trip 20 One-way trips/day 2 No. of employees: Grubbing/Land Clearing 3 No. of employees: Grading/Excavation 6 No. of employees: Drainage/Utilities/Sub-Grade 6 No. of employees: Paving 6 ROG NOx CO PM10 Emission rate (grams/mile) Emission rate (grams/trip) Pounds per day - Grubbing/Land Clearing Tons per const. Period - Grub/Land Clear Pounds per day - Grading/Excavation Tons per const. Period - Grading/Excavation Pounds per day - Drainage/Utilities/Sub-Grade Tons per const. Period - Drain/Util/Sub-Grade Pounds per day - Paving Tons per const. Period - Paving tons per construction period Water truck default values can be overriden in cells C87 through C89 and E87 through E89. Water Truck Emissions Program Estimate of User Override of Water Default Values Number of Water Trucks Number of Water Trucks Truck Miles Traveled Miles Traveled/Day Grubbing/Land Clearing - Exhaust Grading/Excavation - Exhaust Drainage/Utilities/Subgrade ROG NOx CO PM10 Emission rate (grams/mile) Pounds per day - Grubbing/Land Clearing Tons per const. Period - Grub/Land Clear Pound per day - Grading/Excavation Tons per const. Period - Grading/Excavation Pound per day - Drainage/Utilities/Subgrade Tons per const. Period - Drainage/Utilities/Subgrade
63 Fugitive dust default values can be overridden in cells C104 and C105. Fugitive PM10 Dust User Override of Max Default Acrerage/Day Maximum Acreage/Day pounds/day tons/per period Fugitive Dust - Grubbing/Land Clearing Fugitive Dust - Grading/Excavation Fugitive Dust - Drainage/Utilities/Subgrade Off road equipment default number of vehicles can be overridden in cells B115 through B224. Off-Road Equipment Emissions Default Grubbing/Land Clearing Number of Vehicles ROG CO NOx PM10 Override of Default Number of Vehicles Program-estimate Type pounds/day pounds/day pounds/day pounds/day Backhoes Bore/Drill Rigs Concrete/Industrial Saws Compactor Cranes Crawler Tractors Crushing/Proc. Equipment Dozer Excavator Forklifts, Rough Terrain Grader Loaders, Rubber Tired Off-Highway Trucks Other Construction Equip Pavers Paving Equipment Rollers Scrapper Signal Boards Skid Steer Loaders Surfacing Equipment Tractors Trenchers pounds per day tons per period
64 Grading/Excavation Number of Vehicles ROG CO NOx PM10 Override of Default Number of Vehicles Program-estimate Type pounds/day pounds/day pounds/day pounds/day Backhoes Bore/Drill Rigs Concrete/Industrial Saws Compactor Cranes Crawler Tractors Crushing/Proc. Equipment Dozer Excavator Forklifts, Rough Terrain Grader Loaders, Rubber Tired Off-Highway Trucks Other Construction Equip Pavers Paving Equipment Rollers Scrapper Signal Boards Skid Steer Loaders Surfacing Equipment Tractors Trenchers max pounds per day tons per period
65 Drainage/Utilities/Subgrade Number of Vehicles ROG CO NOx PM10 Override of Default Number of Vehicles Program-estimate Type pounds/day pounds/day pounds/day pounds/day Backhoes Bore/Drill Rigs Concrete/Industrial Saws Compactor Cranes Crawler Tractors Crushing/Proc. Equipment Dozer Excavator Forklifts, Rough Terrain Grader Loaders, Rubber Tired Off-Highway Trucks Other Construction Equip Pavers Paving Equipment Rollers Scrapper Signal Boards Skid Steer Loaders Surfacing Equipment Tractors Trenchers max pounds per day tons per period
66 Paving Number of Vehicles ROG CO NOx PM10 Override of Default Number of Vehicles Program-estimate Type pounds/day pounds/day pounds/day pounds/day Backhoes Bore/Drill Rigs Concrete/Industrial Saws Compactor Cranes Crawler Tractors Crushing/Proc. Equipment Dozer Excavator Forklifts, Rough Terrain Grader Loaders, Rubber Tired Off-Highway Trucks Other Construction Equip Pavers Paving Equipment Rollers Scrapper Signal Boards Skid Steer Loaders Surfacing Equipment Tractors Trenchers pounds per day tons per period Total Emissions (tons per construction period)
67 Equipment default values for horsepower, load factor, and hours/day can be overridden in cells C235 through C256, E235 through E256, and G235 through G256. Default Values Default Values Default Values Equipment Horsepower Load Factor Hours/day Bore/Drill Rigs Concrete/Industrial Saws Cranes Crawler Tractors Crushing/Proc. Equipment Excavators Graders Off-Highway Tractors Off-Highway Trucks Other Construction Equipment Pavers Paving Equipment Rollers Rough Terrain Forklifts Rubber Tired Dozers Rubber Tired Loaders Scrapers Signal Boards Skid Steer Loaders Surfacing Equipment Tractors/Loaders/Backhoes Trenchers Default load factors from SCAQMD CEQA Handbook, Default horsepower values from Appendix B, California Air Resources Board's Offroad Model (see also Appendix B of this spreadsheet). Signal board horsepower based on: U.S. EPA, Final Regulatory Impact Analysis: Control of Emissions from Nonroad Diesel Engines (EPA420-R ). 0 0 END OF DATA ENTRY SHEET
68
69 APPENDIX B FUGITIVE DUST BEST AVAILABLE CONTROL MEASURES FROM SCAQMD RULE 403
70
71 Rule 403 (cont.) (Amended June 3, 2005) TABLE 1 BEST AVAILABLE CONTROL MEASURES (Applicable to All Construction Activity Sources) Source Category Control Measure Guidance Backfilling Stabilize backfill material when not actively handling; and Stabilize backfill material during handling; and Stabilize soil at completion of activity. Mix backfill soil with water prior to moving Dedicate water truck or high capacity hose to backfilling equipment Empty loader bucket slowly so that no dust plumes are generated Minimize drop height from loader bucket Clearing and grubbing Maintain stability of soil through pre-watering of site prior to clearing and grubbing; and Stabilize soil during clearing and grubbing activities; and Stabilize soil immediately after clearing and grubbing activities. Maintain live perennial vegetation where possible Apply water in sufficient quantity to prevent generation of dust plumes Clearing forms Crushing Use water spray to clear forms; or Use sweeping and water spray to clear forms; or Use vacuum system to clear forms. Stabilize surface soils prior to operation of support equipment; and Stabilize material after crushing. Use of high pressure air to clear forms may cause exceedance of Rule requirements Follow permit conditions for crushing equipment Pre-water material prior to loading into crusher Monitor crusher emissions opacity Apply water to crushed material to prevent dust plumes
72 Rule 403 (cont.) (Amended June 3, 2005) TABLE 1 BEST AVAILABLE CONTROL MEASURES (Applicable to All Construction Activity Sources) Source Category Control Measure Guidance Cut and fill Pre-water soils prior to cut and fill activities; and Stabilize soil during and after cut and fill activities. For large sites, pre-water with sprinklers or water trucks and allow time for penetration Use water trucks/pulls to water soils to depth of cut prior to subsequent cuts Demolition mechanical/manual Stabilize wind erodible surfaces to reduce dust; and Stabilize surface soil where support equipment and vehicles will operate; and Stabilize loose soil and demolition debris; and Comply with AQMD Rule Apply water in sufficient quantities to prevent the generation of visible dust plumes Disturbed soil Stabilize disturbed soil throughout the construction site; and Stabilize disturbed soil between structures Limit vehicular traffic and disturbances on soils where possible If interior block walls are planned, install as early as possible Apply water or a stabilizing agent in sufficient quantities to prevent the generation of visible dust plumes Earth-moving activities Pre-apply water to depth of proposed cuts; and Re-apply water as necessary to maintain soils in a damp condition and to ensure that visible emissions do not exceed 100 feet in any direction; and Stabilize soils once earth-moving activities are complete. Grade each project phase separately, timed to coincide with construction phase Upwind fencing can prevent material movement on site Apply water or a stabilizing agent in sufficient quantities to prevent the generation of visible dust plumes
73 Rule 403 (cont.) (Amended June 3, 2005) TABLE 1 BEST AVAILABLE CONTROL MEASURES (Applicable to All Construction Activity Sources) Source Category Control Measure Guidance Importing/exporting of bulk materials Stabilize material while loading to reduce fugitive dust emissions; and Maintain at least six inches of freeboard on haul vehicles; and Stabilize material while transporting to reduce fugitive dust emissions; and Stabilize material while unloading to reduce fugitive dust emissions; and Comply with Vehicle Code Section Use tarps or other suitable enclosures on haul trucks Check belly-dump truck seals regularly and remove any trapped rocks to prevent spillage Comply with track-out prevention/mitigation requirements Provide water while loading and unloading to reduce visible dust plumes Landscaping 10-1 Stabilize soils, materials, slopes Apply water to materials to stabilize Maintain materials in a crusted condition Maintain effective cover over materials Stabilize sloping surfaces using soil binders until vegetation or ground cover can effectively stabilize the slopes Hydroseed prior to rain season Road shoulder maintenance Apply water to unpaved shoulders prior to clearing; and Apply chemical dust suppressants and/or washed gravel to maintain a stabilized surface after completing road shoulder maintenance. Installation of curbing and/or paving of road shoulders can reduce recurring maintenance costs Use of chemical dust suppressants can inhibit vegetation growth and reduce future road shoulder maintenance costs
74 Rule 403 (cont.) (Amended June 3, 2005) TABLE 1 BEST AVAILABLE CONTROL MEASURES (Applicable to All Construction Activity Sources) Source Category Control Measure Guidance Screening Pre-water material prior to screening; and Limit fugitive dust emissions to opacity and plume length standards; and Stabilize material immediately after screening. Dedicate water truck or high capacity hose to screening operation Drop material through the screen slowly and minimize drop height Install wind barrier with a porosity of no more than 50% upwind of screen to the height of the drop point Staging areas Stabilize staging areas during use; and Stabilize staging area soils at project completion. Limit size of staging area Limit vehicle speeds to 15 miles per hour Limit number and size of staging area entrances/exists Stockpiles/ Bulk Material Handling Stabilize stockpiled materials. Stockpiles within 100 yards of off-site occupied buildings must not be greater than eight feet in height; or must have a road bladed to the top to allow water truck access or must have an operational water irrigation system that is capable of complete stockpile coverage. Add or remove material from the downwind portion of the storage pile Maintain storage piles to avoid steep sides or faces
75 Rule 403 (cont.) (Amended June 3, 2005) TABLE 1 BEST AVAILABLE CONTROL MEASURES (Applicable to All Construction Activity Sources) Source Category Control Measure Guidance Traffic areas for construction activities Stabilize all off-road traffic and parking areas; and Stabilize all haul routes; and Direct construction traffic over established haul routes. Apply gravel/paving to all haul routes as soon as possible to all future roadway areas Barriers can be used to ensure vehicles are only used on established parking areas/haul routes Trenching Stabilize surface soils where trencher or excavator and support equipment will operate; and Stabilize soils at the completion of trenching activities. Pre-watering of soils prior to trenching is an effective preventive measure. For deep trenching activities, pre-trench to 18 inches soak soils via the pre-trench and resuming trenching Washing mud and soils from equipment at the conclusion of trenching activities can prevent crusting and drying of soil on equipment Truck loading Pre-water material prior to loading; and Ensure that freeboard exceeds six inches (CVC 23114) Empty loader bucket such that no visible dust plumes are created Ensure that the loader bucket is close to the truck to minimize drop height while loading Turf Overseeding Apply sufficient water immediately prior to conducting turf vacuuming activities to meet opacity and plume length standards; and Cover haul vehicles prior to exiting the site. Haul waste material immediately off-site
76 Rule 403 (cont.) (Amended June 3, 2005) TABLE 1 BEST AVAILABLE CONTROL MEASURES (Applicable to All Construction Activity Sources) Source Category Control Measure Guidance Unpaved roads/parking lots Stabilize soils to meet the applicable performance standards; and Limit vehicular travel to established unpaved roads (haul routes) and unpaved parking lots. Vacant land 20-1 In instances where vacant lots are 0.10 acre or larger and have a cumulative area of 500 square feet or more that are driven over and/or used by motor vehicles and/or off-road vehicles, prevent motor vehicle and/or off-road vehicle trespassing, parking and/or access by installing barriers, curbs, fences, gates, posts, signs, shrubs, trees or other effective control measures. Restricting vehicular access to established unpaved travel paths and parking lots can reduce stabilization requirements
77 APPENDIX C TRANSPORTATION CONFORMITY WORKING GROUP DOCUMENTS
78
79
80
81
82

83 Golden Valley Road Bridge
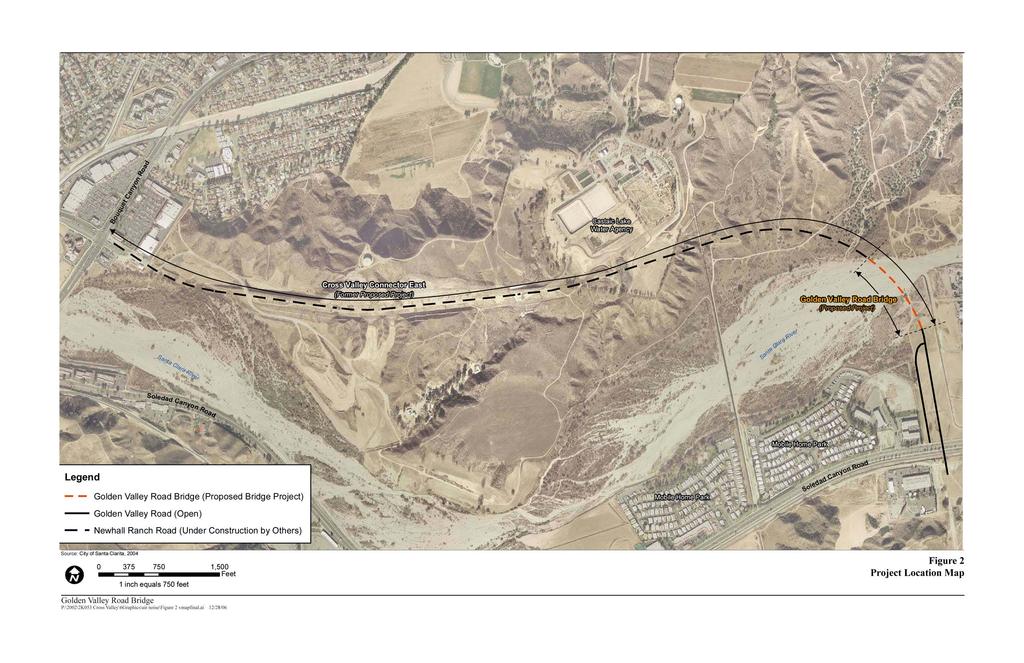
84
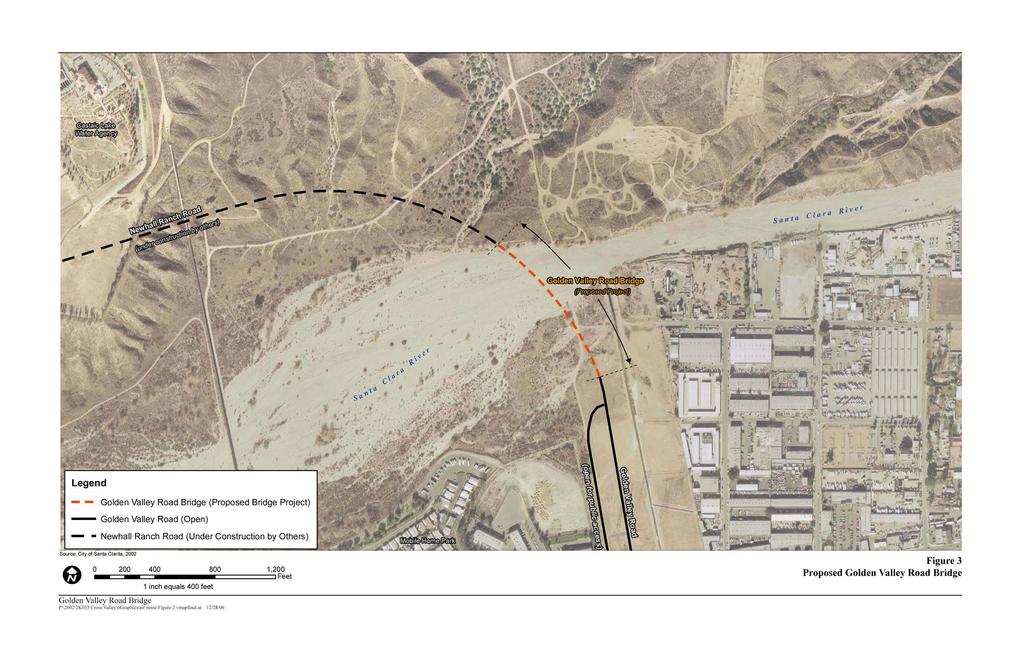
85