Final Report for EC. Volume-I. Sponsor : M/s. NATCO Pharma Limited, Chemical Division, Chennai
|
|
|
- Shonda Wilkerson
- 5 years ago
- Views:
Transcription
 and R&D Facility at Manali Industrial Area, Thiruvottiyur (Tq.), Thiruvallur District, Tamil Nadu Volume-I Sponsor : M/s.")
1 Environmental Impact Assessment of Proposed Expansion of Active Pharmaceutical Ingredients (APIs) & Its Intermediates Manufacturing (66.32 TPA) and R&D Facility at Manali Industrial Area, Thiruvottiyur (Tq.), Thiruvallur District, Tamil Nadu Volume-I Sponsor : M/s. NATCO Pharma Limited, Chemical Division, Chennai Final Report for EC EIA Consultant: KKB Envirocare Consultants Pvt. Ltd., Tarun Plaza, 1 st Floor, , NFC Main Road, Krishna Nagar Colony, Moula-Ali, Hyderabad Submitted to: Industry-II MOEF&CC, Govt. of India Indira Paryavarn Bhavan Jor Bagh, New Delhi NABET: Sl. No. 94 in List-A of NABET website as on August 2017
2
3
4 Contents
5 Contents Item Contents List of Figures List of Tables List of Plates List of Charts List of Annexures List of Abbreviations Contents (Volume-II) Approved Terms of Reference (ToR) Compliance EC Compliance Executive Summary Page No. i - vii viii ix-x xi xi xii-xiii xv-xviii xix-xx TC-1-24 EC-1-14 ES.1-16 Chapter 1: Introduction 1.1 to Preamble Project Proponent Regulatory Framework CPCB CEPI index to Manali Industrial Area Proposed Project Project Site Prior Environmental Clearance Process Approved Terms of Reference (ToR) for EIA Study Environmental Impact Assessment Objective Methodology Air Environment Noise Environment Water Environment Land Environment Biological Environment Socio-economic Environment Occupational Health Environmental Management Plan and Post-Project Environmental 1.18 Monitoring Program Hazard & Risk Assessment 1.18 Chapter 2: Project Description 2.1 to Type of Project Project Justification Need of Project Existing Plant Scenario Effluent Treatment System Solvent Recovery System Process Emissions Management Hazardous / Solid Waste Storage and Disposal Liquid Organic Waste Storage Incinerator System 2.11 (i)
6 Item Page No Fuel Consumption Raw Material Storage and Its Safety Features Vehicular Traffic Occupational Health & Safety Features Existing Infrastructure Additional Infrastructure after flood effect Corporate Environment Policy Environmental Monitoring Action Plan Compliance as per TNPCB / CPCB Proposed Expansion Project Amenities/ facilities Health and Sanitation Facilities Project Cost and Time of Completion Products Process Description Active Pharmaceutical Ingredients (APIs) and its Intermediates Plant Layout Raw Materials Storage, Handling and Transportation Storage and Transportation of Raw Materials and Products Water Requirement Land Power Fuel Man Power Plant and Machinery Sources of Environmental Pollution Air Environment Stack Emissions Process Emissions Fugitive Emissions from Solvents Handling and their Recovery Wastewater Generation and its Treatment Handling, Storage and Detoxification of Empty Raw materials Containers/Bags Solid/Hazardous Wastes Generation Noise Environment Green Belt Development Resources Optimization / Recycling and Reuse Summary of Project after Expansion 2.55 Chapter 3: Description of Environment 3.1 to Introduction Climatology and Meteorology Methodology Meteorological Data Recorded at Proposed Expansion Project 3.2 Site Ambient Air Quality Description of Sampling Locations Frequency and Parameters for Sampling Instruments used for Sampling Sampling and Analytical Techniques 3.6 (ii)
7 Item Page No Baseline Status Noise Environment Reconnaissance Baseline Status Water Environment Baseline Status Surface Water Quality Ground Water Quality Land Environment Reconnaissance Soil Characteristics Baseline status Physico-Chemical Characteristics Land use Pattern-Remote Sensing data Land use Map Analysis Spatial Data from SOI Topographical Sheets Contour Map and Elevations of Study Area Topography (Digital Elevation Model) Land use land cover statistics of buffer zone Biological Environment Introduction Reconnaissance of Study Area Sampling locations Methodology Vegetation structure and composition Flora in Core Zone Flora in Buffer Zone Terrestrial Fauna Terrestrial Fauna of the Core area Terrestrial fauna of the Buffer Zone Socio-Economic Environment Introduction Baseline Status Demographic Structure Infrastructure Facilities Economic Activity Health Status Awareness and opinion of the people about the project Socio-economic Survey Methodology Salient observations recorded during the survey Project Awareness and Feedback from Respondents Corporate Social Responsibility Floods in Chennai during Chapter 4: Impact Assessment & Mitigation Measures 4.1 to Introduction Prediction of Impacts during Construction Phase Air Environment Noise Environment 4.2 (iii)
8 Item Page No Water Environment Land Environment Biological Environment Socio-economic Environment Impacts of Material Transportation Prediction of Impacts on Vehicular Traffic Strom Water Management Rain Water Harvesting System Prediction of Impacts during Operation Phase Impact on Topography and Climate Impact on Air Quality Fugitive Emissions and Mitigation Measures Process Emissions and Mitigation Measures Boiler & DG set emissions (Flue Gas) Air Quality Model Point Source Emissions (Inputs Used for Model) Prediction of Air quality Impacts Impact on Noise Levels Impact on Community Impact on Occupational Health (Work Zone) Impact on Water Environment Wastewater Management Handling, Storage and Detoxification of Toxic Raw materials Impact on Land Use Impact on Soil Impacts due to Hazardous / Solid Waste Generation Impact on Terrestrial and aquatic ecology Impact on Socio-Economic Environment Potential Socio-economic impacts during operation phase Impact on Health Impact on Workers Health and Safety Transportation and Public Amenities Impacts on Cultural Resources Summary 4.35 Chapter 5: Environmental Management Plan 5.1 to Introduction Construction Phase Air Pollution Control Noise Level Water Quality Land Environment Ecological Management Infrastructure Facilities Operation Phase 5.4 (iv)
9 Item Page No Air Environment Fugitive Emissions and Control Measures Diffuse Emissions Emissions from Utilities Process Emissions Odour Management Noise Environment Water Environment Wastewater Management Ground Water Management Storm water Management Hazardous / Solid Waste Management Incinerator at NATCO Green Belt Development and Plantation Programme Socio-economic Environment Enterprises Social Commitment Raw Materials Storage, Handling and their Management Handling / Transportation of Solvents Spill Control Management Housekeeping, Predictive and Preventive Maintenance Fuel Storage, Handling and Management Occupational Safety and Health Aspects Medical Check-up Occupational Health Centre within Plant Premises Transport systems Concept of Waste Minimization, 3r s (Recycle, Reuse & recover 5.29 Techniques 5.7 Cost Provision for Environmental, Occupation Health & Safety Measures Environmental Monitoring Program Introduction Environmental Management System Environmental Management Cell Responsibilities Environmental Monitoring and Reporting Procedure Objectives of Monitoring Monitoring Schedule for Construction and Operation Phases Location of Monitoring Stations Monitoring and Data Analysis Air Quality Monitoring and Data Analysis Water and Wastewater Quality Monitoring and Data 5.40 Analysis Noise Levels Soil quality Reporting Schedules of the Monitoring Data Environmental Laboratory Air Quality and Meteorology Water and Wastewater Quality Noise Levels Occupational Safety and Health Aspects 5.42 (v)
10 Item Page No Flood Incident Mitigation Plan 5.46 Chapter 6: Analysis of Alternatives Analysis of Alternative Sites 6.1 Chapter 7: Risk Assessment and Disaster management Plan 7.1 to Introduction Hazard Identification Identification of Major Hazard Installations Based on GOI Rules, as amended in 1994 & Applicability of Manufacture, Storage and Import of Hazardous 7.4 Chemicals Rules, 1989 & Subsequent amendments Storage Facilities of Hazardous Chemicals Potential Hazards Hazard Analysis Fire and Explosion Index MCA Analysis Event Tree Analysis Methodology of Modeling exercise Consequence of MCA analysis Risk mitigation measures General Fire Prevention and Protective Equipment Solvent Storage Tanks / Drums Handling 7.26 Precautions Spill containment procedure Safety system and Protective Equipment (PPE) Specific Recommendations Combustible materials Flammable - Pool Fire/ Vapour cloud Explosions / 7.33 BLEVE Toxic Releases Hazard Control measures Mitigation Measures for Natural Disasters Disaster Management Plan On-site Emergency Preparedness Plan Purpose Accident Prevention Procedures / Measures Before Emergency During Emergency After Emergency Off-site Emergency Preparedness Program Purpose of Plan Before Emergency During Emergency After emergency Conclusion & Recommendations 7.54 Chapter 8: Project Benefits 8.1 to Introduction 8.1 (vi)
11 Item Page No Construction Phase Employment generation Community service Transportation Demography and Socio-economic Operational Phase Employment Other Benefits Prediction of Impacts on Socio-Economic Enterprises Social Commitment (ESC) Activities Conclusion 8.4 Chapter 9: Summary 9.1 Chapter 10: Disclosure of Consultant 10.1 to Introduction NABET Accreditation Declaration of Experts NABL Accreditation 10.6 (vii)
12 List of Figures Fig. No. Particulars Page No. 1.1 Project Site Location Map Google Map Showing Project Boundaries of Proposed Project Topographical map of 10 km study area Topographical map (study area) with location of industries Typical Manufacturing Process of API s & API Intermediates Plant Layout Windrose diagram for the study period (Summer) Ambient Air Quality Monitoring locations Noise monitoring locations Surface and Ground water Sampling Locations Soil types of Thiruvallur district, Tamil Nadu Seismic Zoning Map & Hazard Zoning Map of India Soil sampling locations in the study area Map showing satellite image with site Location Flow chart for Methodology Map Showing Water bodies and Drainage in Study Area Map Showing Contours with 5 m interval in Study Area Map showing Digital Elevation Model in study area Map Showing Land Use Land Cover in Study Area Graphical Presentation of Land use statistics Schematic Flow Diagram of Double Stage Scrubber System Predicted GLC of PM 10 in µg/m 3 24 hourly basis (Summer Season) Predicted GLC of SO 2 in µg/m 3 24 hourly basis (Summer Season) Predicted GLC of NO x in µg/m 3 24 hourly basis (Summer Season) Schematic Diagram of Effluent Treatment Plant - 3 Streams Water Balance Rain Water Recharge Pit in the Tank Greenbelt development Organisational Structure of Environment Health & Safety Plant Layout Typical flow Chart of Accidental Release of Hazardous Chemicals Factory management organisation chart Organization chart : Off Site Emergency preparedness plan 7.51 (viii)
13 List of Tables Table No. Particulars Page No. 1.1 Salient Features of the Proposed Expansion Project (a) 2.1 (b) Permitted (Existing) Products and their Capacities as per EC Permitted (Existing) Products and their Capacities as per CTO (a) Existing Water Requirement, Wastewater Generation and its Treatment (as 2.4 per EC) 2.2 (b) Existing Wastewater Generation and its Treatment (as per CTO) Existing Process Emissions and its Treatment Hazardous Waste Generation from the Existing Products (as per CTO) Summary of Employee Medical Health Status of Direct employees Action plan for reducing the CEPI implementation TNPCB Action plan (November 2010) for reducing the CEPI- Monitoring Permitted and Proposed Products, their quantities and its Status Proposed Products, their Capacity and Therapeutic Category Land Break-up Details List of Solvents & Hazardous Chemicals and its Consumption, Storage and 2.30 Handling 2.12 List of Other Chemicals and its Consumption, Storage & Handling Maximum Pollution Load for the Proposed Products on Various Combinations Product wise Process Emissions Proposed Solvent Balance Product wise Solvent Usage, Losses and Recovery Proposed (a) Product wise Water Input & Wastewater Quantity and Characteristics 2.49 Proposed 2.17(b) Product Wise segregation of effluent based on TDS & COD concentrations Product wise Hazardous Waste Generation - Proposed Summary of the Meteorological Data Generated in the Site Ambient Air Quality Monitoring Locations AAQ Monitoring parameters detectable limits with NAAQS Ambient Air Quality Status: Summer Season Workroom VOC concentrations at Plant Site Noise Monitoring Locations Equivalent Day- Night Noise Levels in the Study Area Noise Levels in Plant site Surface and Ground Water Quality Sampling Locations Surface Water Quality Ground Water Quality Soil Monitoring Locations Physico-chemical characteristics of Soil Extract and Soil Texture Land Use Land Covers Statistics of Buffer Zone Sampling locations in Buffer area Top 10 Tree species showing highest IVI in Core Zone Top 10 Herb species showing highest IVI in Core Zone Floral Diversity Index in Core and Buffer area Top 10 families of floral composition in buffer area Top 10 Tree species showing highest IVI in Buffer Zone Top 10 Shrub species showing highest IVI in Buffer Zone 3.50 (ix)
14 Table No. Particulars Page No Top 10 Herb species showing highest IVI in Buffer Zone Faunal composition in the study area Faunal diversity in the study area Socio-economic Surveyed Villages Summary of Demographic Structure Solvent wise Usage, its Losses and Recovery Process Emissions from Proposed Products Stack Emission Details and Flue Gas Characteristics Meteorological data on Percentile basis during study period Predicted Maximum Concentration in µg/m 3 Proposed Maximum Incremental and Resultant GLCs Proposed Water Balance, Waste Water Generation and Segregation Effluent Treatment Flow as per Segregation Raw and Treated Effluent Characteristics with Standards Existing & Proposed ETP Unit Capacities Hazardous / Solid Waste Generation handling and disposal Summary of Anticipated Impacts and Mitigation Measures Runoff volume for Rainwater Harvesting System List of Perennial native trees Identified for Greenbelt, Avenue and Block Plantations 5.3 List of Shrubs & Herbs proposed for plantation between the trees Budget Estimate for Greenbelt Development Plan Budget Allocation for ESC Activities Estimated Budget for Environmental, Health & Safety Management (Capital & 5.30 Recurring cost) 5.7 Environmental Monitoring Plan during Construction Stage Environmental Monitoring Plan during Operation Phase Description of applicable provisions of GOI rules 1989 as amended in 1994 & List of Hazardous Chemicals, daily consumption, Maximum Storage, Type of 7.5 Storage and Nature of Material 7.3 Hazardous materials properties, rating and TLV value - Solvent storage yard Hazard Maximum Storage and NFPA Rating Open storages Classification of Flammable/ Combustible Liquids Description of National Fire Protection Agency (NFPA) Classification Event Classification Various Physical Effects Due to Heat Radiation Over Pressure Effect of Explosion Consequences of MCA Analysis Storages Consequence Analysis for Toxic Release Scenario Existing Fire Extinguisher s Details at Site Safety data which are common to all raw materials and solvents Recommended Personal Protective Equipment s Major incompatibilities for storage and handling of hazardous chemicals Budgetary allocation for the ESC activities 8.3 (x)
15 List of Plates Plate No. Particulars Page No. 2.1 Existing units in plant premises Greenbelt in plant premises and site visit photos Proposed Existing Vacant Land for Expansion Online Monitoring facilities in the Industry Green belt in the existing core area Vegetation in the proposed core area Habitat setup with agriculture practice, wetlands & open lands in the buffer area 3.44 List of Charts Chart No. Particulars Page No Population Distribution Literacy Percentage Percentage of SC, ST and Other Population Occupational Structure of the Buffer Zone 3.57 (xi)
16 List of Annexures Annexure Particulars Page No. I RoC in favour of NATCO Organics Limited dated II EC from MoEF vide order F.No. J-11011/456/06/2006-IA-II (I) dated III CTE (TNPCB) under the Water Act, vide order no & Proceedings No TNPCB/T10/33317/TVLR/W/2007 and order No & Proceedings No. TNPCB/T10/33317/TVLR/A/ 2007 dated under Air Act. IV A CTO under Water Act vide consent order no & Proceedings No T10/TNPCB/F.33317/AMB/W/2010 and order No & Proceedings No. T10/TNPCB/F.33317/AMB/A/2010 dated IV B CTO under water act vide order no & Proceedings No T2/TNPCB/F.0081AMB/RL/AMB/W/2016 and orders No & Proceedings No. T2/TNPCB/F.0081AMB/RL/AMB/A/ 2016 under Air Act dated V Latest Hazardous waste authorizations vide No.17HRC dated & proceedings no. T2/TNPCB/F.0846AMB/HWA/RL/AMB/2017 dated VI NATCO Organics Limited" Amalgamation in to NATCO group of companies under the name and title of "NATCO Pharma Limited", as per the Court Order VII Copy of Certificate of Incorporation (Name Change) VIII USFDA certification 75 IX Lift of Moratorium by MoEF for projects located in Manali along with other industrial clusters vide OM No. J-11013/5/2010-IA.II(I) dated X Thiruvottiyur Taluk (Taluk Change) document XI CA Certificate 80 XII Signed ToR vide order F.No. J-11011/119/2017-IA.II(I) dated XIII Copy of Acknowledgement of Compliance status report of Consent to Operation from TNPCB XIV Pre-placement medical check-up format XV Flood Mitigation Plan XVI Approved EHS policy 109 XVII Latest Monitoring reports from third party laboratory XVIII Agreement for Water supply through private tankers XIX TNEB communication letter on 2100 KW Wind Power Mill 122 XX List of existing, additional and total plant and machinery 123 XXI Site Specific meteorological data XXII Ambient Air Quality Field data during Study Period XXIII National Ambient Air Quality Standards (NAAQS) XXIV Ambient noise level during study period XXV Ambient Noise Standards 180 XXVI Designated best use of CPCB classification of surface water XXVII Drinking Water Standards: BIS: XXVIII Soil Classification Standards 185 XXIX Check list of Flora present in Core Area XXX Checklist of Flora in the buffer area of the study area XXXI Check list of Avifaunains recorded in the Core area 196 XXXII Check list of Herpeto fauna recorded in the Core area 197 (xii)
17 Annexure Particulars Page No. XXXIII Check list of Invertebrates recorded in the Core area 198 XXXIV List of Mammals Species found/reported in buffer area 199 XXXV List of Reptiles found/reported in buffer area 200 XXXVI List of Amphibians found/reported in buffer area 201 XXXVII List of Birds found/reported in buffer area XXXVIII List of Fishes found/reported in buffer area 205 XXXIX List of Invertebrates found/reported in buffer area XL Population Breakup & Literacy Levels in the Study Area (2011 Census) XLI Households, Population and Workers in the Study Area (2011 Census) XLII Main, Marginal and Non-Working population in the Study Area ( Census) XLIII Educational Facilities and CBOs in the Study Area XLIV Medical Facilities in the Study Area XLV Other Infrastructural Facilities in the Study Area (2011 Census) XLVI Input data used for modelling XLVII TSDF Agreement XLVIII Latest regular Medical health checkup for one employee XLIX Damage distance and effect of heat radiation due to BLEVE for Ethanol L Damage distance and effect of heat radiation due to BLEVE for Hexane LI Damage distance and effect of heat radiation due to BLEVE for Bromo Benzene LII Damage contour of Benzyl Chloride LIII Damage contour of Acetic an hydride LIV Damage contour of Chloroform LV Mock Drill (xiii)
18 Abbreviation AAQ AAQM AAQMS AOI APIs ASP ATFD BDL CA CAGR CEO CEPI CMDA CMWSSB CS CTE CTO CGMP CMG COD CO CPCB CSR DCP DCS DEM DG DMF DMP DMSO DO EAC EAP EAPs EC ECOT EHS EIA EMP EMS ENT EPA ERDAS ESC ESE ETP F&EI FDA Expansion Ambient Air Quality List of Abbreviations Ambient Air Quality Monitoring Ambient Air Quality Management System Area of Interest Active Pharmaceutical Ingredients Activated Sludge Process Agitated Thin Film Dryer Below Detection Limit Chartered Accountant Compound Annual Growth Rate Chief Executive Officer Comprehensive Environmental Pollution Index Chennai Metropolitan Development Authority Chennai Metropolitan Water Supply & Sewerage Board Caustic soda Consent to Establishment Consent to Operation Current Good Manufacturing Practices Crisis Management Group Chemical Oxygen Demand Carbon Monoxide Central Pollution Control Board Corporate Social Responsibility Dry Chemical Powder Distributed Control System Digital Elevation Model Diesel Generator Dimethyl Formamide Disaster Management Plan Dimethyl sulfoxide Dissolved Oxygen Expert Appraisal Committee Environmental Legal and regulatory framework Action Program Environmental Action Plans Environmental Clearance Electrochemical oxidation treatment Environment, Health and Safety Environmental Impact Assessment Environmental Management Plan Environmental Management System Ear, Nose and Throat Environment (Protection) Act Earth Resources Data Analysis System Enterprise Social Commitment East of Southeast Effluent Treatment Plant Fire and Explosion Index Food and Drug Administration (xiv)
19 Abbreviation FETI FGD GBH GHF GIS GLC GMPs GPH GPS HAZOP HC HCOD HDPE HPRO HSD HTDS IDLH ISCST KLD KVA LCOD LEL LFT LISS LPH LTDS LULC MCA MCLS MEE MCC MCM MF MGLC MLSS MLVSS MoEF MoEF&CC MoU MSDS N,P,K,Ca NAAQ NAAQS NABET NABL NE-SW NIHL NNW NOC NRSC N-S Expansion Fire, Explosion and Toxicity Index Focused group discussion Girth at Breast Height General Hazard Factors Geographical Information System Ground Level Concentration Good Manufacturing Practices General Process Hazards Global Positioning System Hazard and Operability Study Hydrocarbons High Chemical Oxygen Demand High Density Polyethylene High pressure Reverse Osmosis High Speed Diesel High Total Dissolved Solids Immediately Dangerous to Life or Health Industrial Source Complex Short-Term Kilo Liters per Day Kilo Volt Ampere Low Chemical Oxygen Demand Lower Explosive Limit Liver Function Test Linear Imaging Self Scanning Sensor Litres Per Hour Low Total Dissolved Solids Land Use, Land Cover Maximum Credible Accident Most Credible Loss Scenario Multiple Effect Evaporator Main combustion chamber Million Cubic meter Material Factor Maximum Ground Level Concentration Mother liquor suspended solids Mother liquor volatile suspended solids Ministry of Environment and Forests Ministry of Environment and Forests & Climate Change Memorandum of Understanding Material Safety Data Sheet Nitrogen (N), Phosphorus (P),Potassium (K) and Calcium (Ca) National Ambient Air Quality National Ambient Air Quality Standards National Accreditation Board for Education and Training National Accreditation Board for Laboratories North East-South West Noise Induced Hearing Loss North of Northwest No Objection Certificate National Remote Sensing Centre North-South (xv)
20 Abbreviation NTU N-W OHS OSHA OSHAs OSR P&ID PAPs PAFs PAS PCC PEL PFR PHAST PLC PM PPEs PVC QA QC QCI R&D RCC RO RDS REET RF RPM RT RWH SDP SAFETI SE&NW SOI SOP SPCB SPH SRTM SSE SW TDS TLV TMP TNMWL TOC ToR TPA TPD TPH TSDF TNPCB Expansion Nephelometric Turbidity Unit North-West Occupational Health and Safety Occupational Safety and Health Administration Occupational Safety and Health Administration Specification Open space reservation land area. Piping and Instrumentation Diagram/Drawing Project Affected Persons Project Affected Families Public Address System Post Combustion Chamber Permissible Exposure Level Pre- Feasibility Report Process Hazard Analysis Software Tool Programmable Logic Control Particulate Matter Personal Protective Equipment s Polyvinyl Chloride Quality Assurance Quality Control Quality Council of India Research and Development Reinforce Concrete Cement Reverse Osmosis Respirable Dust Sampler Rare, Endangered, Endemic, Threatened Reserved Forest Respirable Particulate Matter Room Temperature Rain Water Harvesting Single Drum Pyrolyzer Software for the Assessment Fire Explosion and Toxic Impacts Southeast & Northwest Survey of India Standard Operating Procedure State Pollution Control Board Special Process Hazard Shuttle Radar Topography Mission South and Southeast Surface Water/Southwest Total Dissolved solids Threshold Limit Value Temperature Tamil Nadu Waste Management Limited Total Organic Carbon Terms of Reference Tons Per Annum Tons Per Day Tons Per Hour Treatment Storage & Disposal Facility Tamil Nadu Pollution Control Board (xvi)
21 Abbreviation USEPA UTM VCEs VOC ZLD Expansion United State Environment Protection Agency Universal Transverse Mercator Vapor Cloud Explosions Volatile Organic Carbon Zero Liquid Discharge (xvii)
22 Contents (Volume II) Sl. No. Item Page Details of Manufacturing Products Proposed APIs and Its Intermediates Campaign Products 1. Bendamustine HCl Bortezomib Decetabine Everolimus Temsilrolimus Trabectedine Busulfan Lenalidomide Nelarabine Thiotepa Azacitidine Chlorambucil Doxorubicin Hydrochloride Epothiline B Fulvestrant Pomolidomide Sirolimus Carmustine Melphalan Cabozantinib-S-Malate Dasatinib Monohydrate Erlotinib Hydrochloride Geftinib Imatinib Mesylate Lapatinib Ditosylate Monohydrate Nilotinib Hydrochloride Palbociclib Pazopanib Hydrochloride Sorafenib Tosylate Sunitinib Malate Dabigatran Etexilate Deferasirox Lansoprazole Lanthanum Carbonate Dihydrate Ledipasvir Ondansetron Hydochloride Dihydrate Pirfenidone Rizatriptan Benzoate Sacubitril Sertaline Hydrochloride Sumatriptan Succinate Ticagrelor Gaseous Emission Details for the Proposed products Solvent Details for the Proposed products (xviii)
23 Sl. No. Item Page Maximum Solvent Details for the Proposed products on Various Combinations Pollution load for the Proposed products (Per Day Basis) Maximum Pollution Loads for Proposed products on Various Combinations List of Hazardous Chemicals used in Proposed Products 379 MSDS for Hazardous Chemicals Proposed Products Abbreviations used in MSDS (xix)
24 Approved ToR & its Compliance
25 TC-1

26 TC-2
27 TC-3
28 TC-4
29 STANDARD TERMS OF REFERENCE (TOR) FOR EIA/EMP REPORT FOR PROJECTS/ ACTIVITIES REQUIRING ENVIRONMENT CLEARANCE 5(f):STANDARD TERMS OF REFERENCE FOR CONDUCTING ENVIRONMENT IMPACT ASSESSMENT STUDY FOR SYNTHETIC ORGANIC CHEMICALS INDUSTRY (DYES & DYE INTERMEDIATES; BULK DRUGS AND INTERMEDIATES EXCLUDING DRUG FORMULATIONS; SYNTHETIC RUBBERS; BASIC ORGANIC CHEMICALS, OTHER SYNTHETIC ORGANIC CHEMICALS AND CHEMICAL INTERMEDIATES) AND INFORMATION TO BE INCLUDED IN EIA/EMP REPORT A. STANDARD TERMS OF REFERENCE 1) Executive Summary 2) Introduction i. Details of the EIA Consultant including NABET accreditation ii. iii. Information about the project proponent Importance and benefits of the project 3) Project Description i. Cost of project and time of completion. ii. iii. iv. Products with capacities for the proposed project. If expansion project, details of existing products with capacities and whether adequate land is available for expansion, reference of earlier EC if any. List of raw materials required and their source along with mode of transportation. v. Other chemicals and materials required with quantities and storage capacities vi. vii. viii. ix. Details of Emission, effluents, hazardous waste generation and their management. Requirement of water, power, with source of supply, status of approval, water balance diagram, man-power requirement (regular and contract) Process description along with major equipments and machineries, process flow sheet (quantative) from raw material to products to be provided Hazard identification and details of proposed safety systems. x. Expansion/modernization proposals: c. Copy of all the Environmental Clearance(s) including Amendments thereto obtained for the project from MOEF/SEIAA shall be attached as an Annexure. A certified copy of the latest Monitoring Report of the Regional Office of the Ministry of Environment and Forests as per circular dated 30th May, 2012 on the status of compliance of conditions stipulated in all the existing environmental clearances including Amendments shall be provided. In TC-5
30 STANDARD TERMS OF REFERENCE (TOR) FOR EIA/EMP REPORT FOR PROJECTS/ACTIVITIES REQUIRING ENVIRONMENT CLEARANCE 4) Site Details addition, status of compliance of Consent to Operate for the ongoing Iexisting operation of the project from SPCB shall be attached with the EIA-EMP report. d. In case the existing project has not obtained environmental clearance, reasons for not taking EC under the provisions of the EIA Notification 1994 and/or EIA Notification 2006 shall be provided. Copies of Consent to Establish/No Objection Certificate and Consent to Operate (in case of units operating prior to EIA Notification 2006, CTE and CTO of FY ) obtained from the SPCB shall be submitted. Further, compliance report to the conditions of consents from the SPCB shall be submitted. i. Location of the project site covering village, Taluka/Tehsil, District and State, Justification for selecting the site, whether other sites were considered. ii. iii. iv. A toposheet of the study area of radius of 10km and site location on 1:50,000/1:25,000 scale on an A3/A2 sheet. (including all eco-sensitive areas and environmentally sensitive places) Details w.r.t. option analysis for selection of site Co-ordinates (lat-long) of all four corners of the site. v. Google map-earth downloaded of the project site. vi. vii. viii. ix. Layout maps indicating existing unit as well as proposed unit indicating storage area, plant area, greenbelt area, utilities etc. If located within an Industrial area/estate/complex, layout of Industrial Area indicating location of unit within the Industrial area/estate. Photographs of the proposed and existing (if applicable) plant site. If existing, show photographs of plantation/greenbelt, in particular. Landuse break-up of total land of the project site (identified and acquired), government/ private - agricultural, forest, wasteland, water bodies, settlements, etc shall be included. (not required for industrial area) A list of major industries with name and type within study area (10km radius) shall be incorporated. Land use details of the study area x. Geological features and Geo-hydrological status of the study area shall be included. xi. xii. xiii. Details of Drainage of the project upto 5km radius of study area. If the site is within 1 km radius of any major river, peak and lean season river discharge as well as flood occurrence frequency based on peak rainfall data of the past 30 years. Details of Flood Level of the project site and maximum Flood Level of the river shall also be provided. (mega green field projects) Status of acquisition of land. If acquisition is not complete, stage of the acquisition process and expected time of complete possession of the land. R&R details in respect of land in line with state Government policy. TC-6
31 STANDARD TERMS OF REFERENCE (TOR) FOR EIA/EMP REPORT FOR PROJECTS/ ACTIVITIES REQUIRING ENVIRONMENT CLEARANCE 5) Forest and wildlife related issues (if applicable): i. Permission and approval for the use of forest land (forestry clearance), if any, and recommendations of the State Forest Department. (if applicable) ii. iii. iv. Landuse map based on High resolution satellite imagery (GPS) of the proposed site delineating the forestland (in case of projects involving forest land more than 40 ha) Status of Application submitted for obtaining the stage I forestry clearance along with latest status shall be submitted. The projects to be located within 10 km of the National Parks, Sanctuaries, Biosphere Reserves, Migratory Corridors of Wild Animals, the project proponent shall submit the map duly authenticated by Chief Wildlife Warden showing these features vis-à-vis the project location and the recommendations or comments of the Chief Wildlife Warden-thereon. v. Wildlife Conservation Plan duly authenticated by the Chief Wildlife Warden of the State Government for conservation of Schedule I fauna, if any exists in the study area. vi. Copy of application submitted for clearance under the Wildlife (Protection) Act, 1972, to the Standing Committee of the National Board for Wildlife. 6) Environmental Status i. Determination of atmospheric inversion level at the project site and site-specific micrometeorological data using temperature, relative humidity, hourly wind speed and direction and rainfall. ii. iii. iv. AAQ data (except monsoon) at 8 locations for PM10, PM2.5, SO2, NOX, CO and other parameters relevant to the project shall be collected. The monitoring stations shall be based CPCB guidelines and take into account the pre-dominant wind direction, population zone and sensitive receptors including reserved forests. Raw data of all AAQ measurement for 12 weeks of all stations as per frequency given in the NAQQM Notification of Nov along with - min., max., average and 98% values for each of the AAQ parameters from data of all AAQ stations should be provided as an annexure to the EIA Report. Surface water quality of nearby River (100m upstream and downstream of discharge point) and other surface drains at eight locations as per CPCB/MoEF&CC guidelines. v. Whether the site falls near to polluted stretch of river identified by the CPCB/MoEF&CC, if yes give details. vi. vii. viii. ix. Ground water monitoring at minimum at 8 locations shall be included. Noise levels monitoring at 8 locations within the study area. Soil Characteristic as per CPCB guidelines. Traffic study of the area, type of vehicles, frequency of vehicles for transportation of materials, additional traffic due to proposed project, parking arrangement etc. TC-7
32 STANDARD TERMS OF REFERENCE (TOR) FOR EIA/EMP REPORT FOR PROJECTS/ACTIVITIES REQUIRING ENVIRONMENT CLEARANCE x. Detailed description of flora and fauna (terrestrial and aquatic) existing in the study area shall be given with special reference to rare, endemic and endangered species. If Schedule- I fauna are found within the study area, a Wildlife Conservation Plan shall be prepared and furnished. xi. Socio-economic status of the study area. 7) Impact and Environment Management Plan i. Assessment of ground level concentration of pollutants from the stack emission based on site-specific meteorological features. In case the project is located on a hilly terrain, the AQIP Modelling shall be done using inputs of the specific terrain characteristics for determining the potential impacts of the project on the AAQ. Cumulative impact of all sources of emissions (including transportation) on the AAQ of the area shall be assessed. Details of the model used and the input data used for modelling shall also be provided. The air quality contours shall be plotted on a location map showing the location of project site, habitation nearby, sensitive receptors, if any. ii. iii. iv. Water Quality modelling - in case of discharge in water body Impact of the transport of the raw materials and end products on the surrounding environment hall be assessed and provided. In this regard, options for transport of raw materials and finished products and wastes (large quantities) by rail or rail-cum road transport or conveyorcum-rail transport shall be examined. A note on treatment of wastewater from different plant operations, extent recycled and reused for different purposes shall be included. Complete scheme of effluent treatment. Characteristics of untreated and treated effluent to meet the prescribed standards of discharge under E(P) Rules. v. Details of stack emission and action plan for control of emissions to meet standards. vi. vii. viii. ix. Measures for fugitive emission control Details of hazardous waste generation and their storage, utilization and management. Copies of MOU regarding utilization of solid and hazardous waste in cement plant shall also be included. EMP shall include the concept of waste-minimization, recycle/reuse/recover techniques, Energy conservation, and natural resource conservation. Proper utilization of fly ash shall be ensured as per Fly Ash Notification, A detailed plan of action shall be provided. Action plan for the green belt development plan in 33 % area i.e. land with not less than 1,500 trees per ha. Giving details of species, width of plantation, planning schedule etc. shall be included. The green belt shall be around the project boundary and a scheme for greening of the roads used for the project shall also be incorporated. x. Action plan for rainwater harvesting measures at plant site shall be submitted to harvest rainwater from the roof tops and storm water drains to recharge the ground water and also to TC-8
33 STANDARD TERMS OF REFERENCE (TOR) FOR EIA/EMP REPORT FOR PROJECTS/ ACTIVITIES REQUIRING ENVIRONMENT CLEARANCE xi. xii. xiii. use for the various activities at the project site to conserve fresh water and reduce the water requirement from other sources. Total capital cost and recurring cost/annum for environmental pollution control measures shall be included. Action plan for post-project environmental monitoring shall be submitted. Onsite and Offsite Disaster (natural and Man-made) Preparedness and Emergency Management Plan including Risk Assessment and damage control. Disaster management plan should be linked with District Disaster Management Plan. 8) Occupational health i. Plan and fund allocation to ensure the occupational health & safety of all contract and casual workers ii. iii. iv. Details of exposure specific health status evaluation of worker. If the workers' health is being evaluated by pre designed format, chest x rays, Audiometry, Spirometry, Vision testing (Far & Near vision, colour vision and any other ocular defect) ECG, during pre placement and periodical examinations give the details of the same. Details regarding last month analyzed data of above mentioned parameters as per age, sex, duration of exposure and department wise. Details of existing Occupational & Safety Hazards. What are the exposure levels of hazards and whether they are within Permissible Exposure level (PEL). If these are not within PEL, what measures the company has adopted to keep them within PEL so that health of the workers can be preserved, Annual report of heath status of workers with special reference to Occupational Health and Safety. 9) Corporate Environment Policy i. Does the company have a well laid down Environment Policy approved by its Board of Directors? If so, it may be detailed in the EIA report. ii. iii. iv. Does the Environment Policy prescribe for standard operating process / procedures to bring into focus any infringement / deviation / violation of the environmental or forest norms / conditions? If so, it may be detailed in the EIA. What is the hierarchical system or Administrative order of the company to deal with the environmental issues and for ensuring compliance with the environmental clearance conditions? Details of this system may be given. Does the company have system of reporting of non compliances / violations of environmental norms to the Board of Directors of the company and / or shareholders or stakeholders at large? This reporting mechanism shall be detailed in the EIA report TC-9
34 STANDARD TERMS OF REFERENCE (TOR) FOR EIA/EMP REPORT FOR PROJECTS/ ACTIVITIES REQUIRING ENVIRONMENT CLEARANCE 10) Details regarding infrastructure facilities such as sanitation, fuel, restroom etc. to be provided to the labour force during construction as well as to the casual workers including truck drivers during operation phase. 11) Enterprise Social Commitment (ESC) i. Adequate funds (at least 2.5 % of the project cost) shall be earmarked towards the Enterprise Social Commitment based on Public Hearing issues and item-wise details along with time bound action plan shall be included. Socio-economic development activities need to be elaborated upon. 12) Any litigation pending against the project and/or any direction/order passed by any Court of Law against the project, if so, details thereof shall also be included. Has the unit received any notice under the Section 5 of Environment (Protection) Act, 1986 or relevant Sections of Air and Water Acts? If so, details thereof and compliance/atr to the notice(s) and present status of the case. 13) A tabular chart with index for point wise compliance of above TOR. B. SPECIFIC TERMS OF REFERENCE FOR EIA STUDIES FOR SYNTHETIC ORGANIC CHEMICALS INDUSTRY (DYES & DYE INTERMEDIATES; BULK DRUGS AND INTERMEDIATES EXCLUDING DRUG FORMULATIONS; SYNTHETIC RUBBERS; BASIC ORGANIC CHEMICALS, OTHER SYNTHETIC ORGANIC CHEMICALS AND CHEMICAL INTERMEDIATES) 1. Detailsonsolvents to be used,measuresfor solventrecovery and for emissions control. 2. Details of process emissions from the proposed unit and its arrangement to control. 3. Ambient air quality data should include VOC, otherprocess-specificpollutants* like NH3*, chlorine*, HCl*, HBr*, H2S*, HF*,etc.,(*-asapplicable) 4. Work zone monitoring arrangements for hazardous chemicals. 5. Detailed effluent treatment scheme including ssegregation of effluent streams for units adopting 'Zero' liquid discharge. 6. Action plan for odour control to be submitted. 7. A copy of the Memorandum of Understanding signed with cement manufacturers indicating clearly that they co-process organic solid/hazardous waste generated. 8. Authorization/Membership for the disposal of liquid effluent in CETP and solid/hazardous waste in TSDF, if any. 9. Action plan for utilization of MEE/dryers salts. 10. Material Safety Data Sheet for all the Chemicals are being used/will be used. 11. Authorization/Membership for the disposal of solid/hazardous waste in TSDF. 186 TC-10
35 STANDARD TERMS OF REFERENCE (TOR) FOR EIA/EMP REPORT FOR PROJECTS/ ACTIVITIES REQUIRING ENVIRONMENT CLEARANCE 12. Details of incinerator if to be installed. 13. Risk assessment for storage and handling of hazardous chemicals/solvents. Action plan for handling & safety system to be incorporated. 14. Arrangements for ensuring health and safety of workers engaged in handling of toxic materials. *** TC-11
36 NATCO Pharma Ltd.-Chemical Division- Chennai-EIA Report ToR Compliance Sl. No. M/s NATCO Pharma Ltd.- Chemical Division-Chennai, Manali Industrial Area, Thiruvottiyur (Tq.) (formerly Vaikkadu (V), Ambattur (Tq.), Thiruvallur District, Tamil Nadu MoEF&CC Approved Terms of Reference (ToR) for EIA Study and Compliance (Letter No. F.No.J-11011/119/2017-IA.II (I) dated ) Approved ToR Compliances (All Chapters, Sections, Figures & Tables, referred here are from EIA Report) A. Standard Terms of Reference(ToR) 1. Executive Summary Introduction, project description, resources requirement, baseline study, description of Environment, environmental impacts and mitigation measures, greenbelt development, EMP described briefly and presented at the beginning of the EIA report. 2. Introduction i) Details of the EIA Consultant including NABET accreditation ii) iii) Information about the project proponent Importance and benefits of the project 3. Project Description i) Cost of project and time of completion ii) Products with capacities for the proposed project. iii) If expansion project, details of existing products with capacities and whether adequate land is available for expansion, reference of earlier EC if any. The details of EIA consultant and NABET accreditation is presented in Chapter -10. Information about the project proponent is presented in Chapter-1, Section 1.2 (page # ). Importance of the proposed expansion project is described briefly in Chapter-2, Section (page# ) and project benefits are presented in Chapter-8 (page# ). The existing investment of Rs crores with additional investment of Rs.100 crores is being invested totaling to Rs crores. The existing capital cost of Rs.15 crores with additional cost of Rs. 5.0 crores is allocated towards environmental pollution control measures totaling to Rs.20 crores. The existing recurring cost for operation & maintenance is Rs.2.5 crores per annum with additional recurring will be Rs.12 Crores per annum totaling Rs.14.5 crores. Time of completion of the project activities and expected commercial production will be commenced during (Chapter-2, Section 2.4.3(page#2.19). Proposed products with capacity of each product along with therapeutic category are presented in Chapter-2, Section 2.4 (page# ), Table 2.7(page# ). Details of existing products with their capacity of each product are presented in Chapter-2, Table 2.1 (a) & (b) (page # 2.3). Existing and proposed Land use pattern break-up is presented in Chapter-2, Section 2.6 (page# ), Table 2.8(page#2.25). TC - 12 KKB Envirocare Consultants Pvt. Ltd., Hyderabad
37 NATCO Pharma Ltd.-Chemical Division- Chennai-EIA Report ToR Compliance Sl. No. iv) Approved ToR List of raw materials required and their source along with mode of transportation v) Other chemicals and materials required with quantities and storage capacities vi) Details of Emission, effluents, hazardous waste generation and their management. vii) Requirement of water, power, with source of supply, status of approval, water balance diagram, man-power requirement (regular and contract) TC - 13 Compliances (All Chapters, Sections, Figures & Tables, referred here are from EIA Report) Obtained Environmental Clearance from MoEF vide Lr. No.J-11011/456/06/2006- IA- II (I) dated in the name of M/s. NATCO Organics Ltd. The list of raw materials (chemicals) required for the manufacture of proposed products is presented in Chapter-2, Section 2.7 (page#2.27), Table 2.9 (page# ). The chemicals required for the process are mostly bought from the local (indigenous) markets. Mode of transportation of all raw materials to the project site is by road. List of Hazardous chemicals, list of other chemicals with storage capacity and list of solvent with their storage capacity is presented in Chapter-2, Section 2.7 (page#2.27), Table 2.10 (page# ). Existing emissions, effluents, hazardous waste generation and their management is described in Chapter-2, Section 2.3.3(page# 2.9), Section 2.3.1(page# ), Section (page# ). Proposed emissions, effluents, hazardous waste generation and their management is presented in Chapter-4, Solvents-Section (page# ),Table 4.1 (page # ); Process emissions- Section (page# ), Table 4.2 (page#4.10); Utilities Section (page#4.12); Effluents- Section (page# ); Hazardous waste- Section (page# ). Gross water requirement is 576 KLD of which fresh water requirement of 303 KLD. Treated effluent of 182 KLD will be recycled in cooling tower makeup and 91 KLD is recovered as steam condensate from boiler thereby fresh water requirement will be reduced. The balance water requirement will be met from CMWSSB and ground water through tankers supply (Annexure-XVIII). Power requirement after expansion will be 2350 KVA including existing 1175 KVA and will be met from TNEB grid. Additional power will be drawn from their wind electric generator which is for captive power for proponent. Water balance diagram is presented in Chapter-4, Fig.4.7 (page#4.26). Man-power requirement: Regular -350 and KKB Envirocare Consultants Pvt. Ltd., Hyderabad
38 NATCO Pharma Ltd.-Chemical Division- Chennai-EIA Report ToR Compliance Sl. No. viii) ix) Approved ToR Process description along with major equipment s and machineries, process flow sheet (Quantitative) from raw material to products to be provided Hazard identification and details of proposed safety systems x) Expansion/modernization proposals a) Copy of all the Environmental Clearance(s) including Amendments thereto obtained for the project from MoEF/SEIAA shall be attached as an Annexure. A certified copy of the latest Monitoring Report of the Regional Office of the Ministry of Environment and Forests as per circular dated 30th May, 2012 on the status of compliance of conditions stipulated in all the existing environmental clearances including Amendments shall be provided. In addition, status of compliance of Consent to Operate for the ongoing / existing operation of the project from SPCB shall be attached with the EIA- EMP report b) In case the existing project has not obtained environmental clearance, reasons for not taking EC under the provisions of the EIA Notification 1994 and/or EIA Notification 2006 shall be provided. Copies of Consent to Establish/No Objection Certificate and Consent to Operate (in case of units operating prior to EIA Notification 2006, CTE and CTO of FY ) obtained from the SPCB shall be submitted. Further, compliance report to the conditions of consents from the SPCB shall be submitted. 4. Site Details i) Location of the project site covering village, Taluka/Tehsil, District and State, Justification for selecting the site, whether other sites were TC - 14 Compliances (All Chapters, Sections, Figures & Tables, referred here are from EIA Report) Contract-100. Product wise manufacturing process description, flow charts, chemical reactions, material balance, pollution loads are presented in Volume-II of the EIA report separately. Identified hazards for the study and hazard analysis is presented in Chapter-7, Section 7.1 (page# ) and Section 7.2 (page# ) respectively. Safety procedures for general and individual hazards are presented in Chapter-7, Section 7.5(page# ). Copy of the Environmental Clearance for the project from MoEF vide Lr. No.J-11011/456/06/2006- IA- II (I) dated in the name of M/s. NATCO Organics Ltd., and its certified compliance report from MoEF&CC, regional office, Chennai is presented separately in the beginning of EIA report. TNPCB issued compliance status report of Consent to Operate is presented at Annexure-XIII. Industry obtained EC for the existing project is on Hence it is not applicable. Latest Consent for the Operation of the plant and discharge of sewage & trade effluent under water act vide consent order no & Proceedings No. T2/TNPCB/F.0081AMB/RL/ AMB/ W/2016 dated , whereas consent orders No & Proceedings No. T2/TNPCB/ F.0081AMB/RL/AMB/A/2016 dated under Air Act in the name of NATCO Organics Ltd. (Annexure-IV B). The proposed expansion will be at the existing site premises located at Manali Industrial Area, Thiruvottiyur Taluk, Thiruvallur District, Tamil Nadu. KKB Envirocare Consultants Pvt. Ltd., Hyderabad
39 NATCO Pharma Ltd.-Chemical Division- Chennai-EIA Report ToR Compliance Sl. No. ii) iii) iv) considered. Approved ToR A topo sheet of the study area of radius of 10km and site location on 1:50,000/1:25,000 scale on an A3/A2 sheet. (including all eco-sensitive areas and environmentally sensitive places) Details w.r.t. option analysis for selection of site Co-ordinates (lat-long) of all four corners of the site v) Google map-earth downloaded of the project site vi) Layout maps indicating existing unit as well as proposed unit indicating storage area, plant area, greenbelt area, utilities etc. If located within an Industrial area/estate/complex, layout of Industrial Area indicating location of unit within the Industrial area/estate. vii) Photographs of the proposed and existing (if applicable) plant site. If existing, show photographs of plantation/greenbelt, in particular. viii) ix) Land use break-up of total land of the project site (identified and acquired), government/ private - agricultural, forest, wasteland, water bodies, settlements, etc., shall be included. (not required for industrial area) A list of major industries with name and type within study area (10km radius) shall be incorporated. Land use details of the study area. x) Geological features and Geohydrological status of the study area shall be included xi) Details of Drainage of the project upto 5km radius of study area. If the TC - 15 Compliances (All Chapters, Sections, Figures & Tables, referred here are from EIA Report) (Chapter-1, Section 1.5 (page# ), Fig.1.1 (page# 1.8). Hence, other sites were not considered. Topographical map in 10 km radius Study Area in 1:50,000 scale on A3 sheet is shown in Fig. 1.3 (page#1.11). Not applicable. Co-ordinates (lat-long) of all the corners of project site are presented in Chapter-1, Section 1.5 (page#1.6). Google image of the project site is shown in Fig.1.2 (page#1.10). Plant lay out showing existing units and proposed units including storage area, plant area, green belt area, utilities etc. is shown in Fig.2.2 (page#2.26). Proposed project is within the vacant land of existing premises and the existing plant photographs including greenbelt are presented in Plates 2.1 to 2.3(page# ). No additional land for the proposed project. Proposed project is within the vacant land of existing premises and the land use break-up of the total land of the project site is presented in Table 2.8(page#2.25). List of major industries are presented in Chapter-1, Section 1.5 (page#1.6), Fig.1.4 (page#1.12). Map showing the Land Use Land Cover classification of the study area is presented in Fig (page#3.39). The statistical break-up of the land use classes of buffer zone are presented in Table (page#3.40) and depicted in Fig (page#3.40). Geological features and Geo-hydrological status of the study area is presented in Chapter-3, Section 3.4.1(page# ). Drainage map is depicted in Fig (page#3.36). Project site is not within 1 km radius of any major KKB Envirocare Consultants Pvt. Ltd., Hyderabad
40 NATCO Pharma Ltd.-Chemical Division- Chennai-EIA Report ToR Compliance Sl. No. Approved ToR site is within 1 km radius of any major river, peak and lean season river discharge as well as flood occurrence frequency based on peak rainfall data of the past 30 years. Details of Flood Level of the project site and maximum Flood Level of the river shall also be provided. (mega green field projects) xii) Status of acquisition of land. If acquisition is not complete, stage of the acquisition process and expected time of complete possession of the land. xiii) R&R details in respect of land in line with state Government policy. TC - 16 Compliances (All Chapters, Sections, Figures & Tables, referred here are from EIA Report) river. There is no land acquisition for the proposed project. Land is in possession of project proponent. Proposed project is within the vacant land of existing premises. Hence, there is no R&R in respect of the land is involved. 5. Forest and wildlife related issues (if applicable): Not applicable i) Permission and approval for the use of forest land (forestry clearance), if any, and recommendations of the Not applicable State Forest Department. (if applicable) ii) Landuse map based on High resolution satellite imagery (GPS) of the proposed site delineating the Not applicable forestland (in case of projects involving forest land more than 40 ha) iii) Status of Application submitted for obtaining the stage I forestry Not applicable clearance along with latest status shall be submitted. iv) The projects to be located within 10 km of the National Parks, Sanctuaries, Biosphere Reserves, Migratory Corridors of Wild Animals, the project proponent shall submit the map duly authenticated by Chief Not applicable Wildlife Warden showing these features vis-à-vis the project location and the recommendations or comments of the Chief Wildlife Warden-thereon. v) Wildlife Conservation Plan duly authenticated by the Chief Wildlife Warden of the State Government for Not applicable conservation of Schedule I fauna, if any exists in the study area. vi) Copy of application submitted for clearance under the Wildlife Not applicable (Protection) Act, 1972, to the KKB Envirocare Consultants Pvt. Ltd., Hyderabad
41 NATCO Pharma Ltd.-Chemical Division- Chennai-EIA Report ToR Compliance Sl. No. Approved ToR Standing Committee of the National Board for Wildlife 6. Environmental Status i) Determination of atmospheric inversion level at the project site and site-specific micrometeorological data using temperature, relative humidity, hourly wind speed and direction and rainfall ii) AAQ data (except monsoon) at 8 locations for PM 10, PM 2.5, SO 2, NO X, CO and other parameters relevant to the project shall be collected. The monitoring stations shall be based CPCB guidelines and take into account the pre-dominant wind direction, population zone and sensitive receptors including reserved forests. iii) Raw data of all AAQ measurement for 12 weeks of all stations as per frequency given in the NAQQM Notification of Nov along with - min., max., average and 98% values for each of the AAQ parameters from data of all AAQ stations should be provided as an annexure to the EIA Report. iv) Surface water quality of nearby River (100m upstream and downstream of discharge point) and other surface drains at eight locations as per CPCB/MoEF&CC guidelines. v) Whether the site falls near to polluted stretch of river identified by the CPCB/MoEF&CC, if yes give details. vi) vii) viii) ix) Ground water monitoring at minimum at 8 locations shall be included. Noise levels monitoring at 8 locations within the study area. Soil Characteristic as per CPCB guidelines Traffic study of the area, type of vehicles, frequency of vehicles for transportation of materials, additional traffic due to proposed project, parking arrangement etc. Compliances (All Chapters, Sections, Figures & Tables, referred here are from EIA Report) Site-specific micrometeorological data using temperature, relative humidity, hourly wind speed and direction and rainfall is recorded for the study period and presented in Annexure-XXI. AAQ data for summer at 8 locations for NAAQs parameters and VOC, HC has been collected. The monitoring stations are located taking in to account the pre-dominant wind direction, population zone and sensitive receptors including reserved forest and described in Chapter-3, Section 3.1.4(page#3.4), (Table 3.1.2, page#3.6, Fig.3.1.2, page#3.5). The baseline AAQ field data in study area results of all locations for the study period are presented in Annexure-XXII. Baseline status of study area have been discussed in Chapter-3, Section (page# ), and details of min., max., average and 98% compiled values are presented in Table (page# ). Surface water sampling at 9 locations are monitored and included in EIA report. No. Not applicable Ground water sampling at 9 locations are monitored and included in EIA report. Noise levels at 8 locations are monitored. Soil Characteristics at 14 locations are collected and analysed. The project site is 8.0 km from NH-16.The vehicular traffic of existing plant and proposed expansion is discussed in Chapter-2, Section (page#2.14). TC - 17 KKB Envirocare Consultants Pvt. Ltd., Hyderabad
42 NATCO Pharma Ltd.-Chemical Division- Chennai-EIA Report ToR Compliance Sl. No. Approved ToR x) Detailed description of flora and fauna (terrestrial and aquatic) existing in the study area shall be given with special reference to rare, endemic and endangered species. If Schedule- I fauna are found within the study area, a Wildlife Conservation Plan shall be prepared and furnished. Compliances (All Chapters, Sections, Figures & Tables, referred here are from EIA Report) The flora and fauna (terrestrial and aquatic) existing in the study area is described in Chapter- 3,Sections (page# ) and (page# ). As such there are no chances of occurrence of any rare or endangered or endemic or threatened (REET) species within the core or buffer area. It is apparent from the list that none of the species either spotted or reported is included in Schedule-I of the Wildlife Protection Act. xi) Socio-economic status of the study area. 7. Impact and Environment Management Plan i) Assessment of ground level concentration of pollutants from the stack emission based on site-specific meteorological features. In case the project is located on a hilly terrain, the AQIP Modeling shall be done using inputs of the specific terrain characteristics for determining the potential impacts of the project on the AAQ. Cumulative impact of all sources of emissions (including transportation) on the AAQ of the area shall be assessed. Details of the model used and the input data used for modeling shall also be provided. The air quality contours shall be plotted on a location map showing the location of project site, habitation nearby, sensitive receptors, if any. ii) iii) iv) Water Quality modeling - in case of discharge in water body Impact of the transport of the raw materials and end products on the surrounding environment shall be assessed and provided. In this regard, options for transport of raw materials and finished products and wastes (large quantities) by rail or rail-cum road transport or conveyor cum- rail transport shall be examined. TC - 18 Socio-economic status of the study area is presented in Chapter-3, Section 3.6 (page# ). Impact on Air quality due to fugitive emissions, process emissions, boiler & DG sets emissions, Air quality modeling results are described and presented in Chapter-4, Section (page# ). Input data used for modeling is presented in Annexure-XLVI. Not applicable. As the industry is proposing to upgrade the existing ETP with Zero Liquid Discharge. Treated effluent will be continued to be reused in the Cooling towers. This is an API manufacturing unit with a daily maximum production will be about 0.18 Tons. Maximum number of transport vehicles per day will increase from an average of 3 nos for transportation of raw materials. Only road transport is feasible for raw materials, product and waste transportation in view of small quantities of materials. The NH-16 is 8.0 km to the project site. Hence the impact is negligible (Chapter 4, Section 4.2.9(page#4.35). A note on treatment of wastewater The brief description of existing effluent treatment KKB Envirocare Consultants Pvt. Ltd., Hyderabad
43 NATCO Pharma Ltd.-Chemical Division- Chennai-EIA Report ToR Compliance Sl. No. Approved ToR from different plant operations, extent recycled and reused for different purposes shall be included. Complete scheme of effluent treatment. Characteristics of untreated and treated effluent to meet the prescribed standards of discharge under E(P) Rules v) Details of stack emission and action plan for control of emissions to meet standards. vi) Measures for fugitive emission control vii) Details of hazardous waste generation and their storage, utilization and management. Copies of MoU regarding utilization of solid and hazardous waste in cement plant shall also be included. EMP shall include the concept of wasteminimization, recycle/ reuse/recover techniques, Energy conservation, and natural resource conservation viii) Proper utilization of fly ash shall be ensured as per Fly Ash Notification, A detailed plan of action shall be provided ix) Action plan for the green belt development plan in 33% area i.e. land with not less than 1,500 trees per ha. Giving details of species, width of plantation, planning schedule etc. shall be included. The green belt shall be around the project boundary and a scheme for greening of the roads used for the project shall also be incorporated. x) Action plan for rainwater harvesting measures at plant site shall be submitted to harvest rainwater from the roof tops and storm water drains to recharge the ground water and also to use for the various activities at the project site to conserve fresh water and reduce the water requirement from other sources. Compliances (All Chapters, Sections, Figures & Tables, referred here are from EIA Report) system is presented in Chapter-2, Section (page# ). A complete scheme of waste water management with characteristics is presented in Chapter-4, Section ( ); Fig.4.6 and Fig.4.7 (page# ). The stack emission details and mitigation measures are presented in Chapter-4, Section (page# ). Fugitive emissions and their mitigation measures are presented in Chapter-4, Section (page# ). Hazardous/solid waste generated from different sources, their storage, utilization and management is presented in Chapter-4, Section (page# ). Proposed waste-minimization measures, reduce, recovery and reuse concepts are described briefly in Chapter-5, Section 5.6 (page# ). No fly ash generation for this proposal as the industry proposing furnace oil for utilities. Green belt development and plantation programme (green belt developed in 3.51Ha (33.2% of total area)) is described in Chapter-5, Section (page# ) and green belt depicted in plant layout in Fig.5.2 (page#5.19). The road side tree plantation is proposed under CSR activities Chapter-8, Section 8.4(page#8.4). The project proponent is proposed to utilize the rainwater by harvesting through appropriate rain water-harvesting mechanism. Artificial recharge measures like rain water harvesting (RWH) helps to recharge of the ground water which augments the yield of bore wells. The description and design of RWH system and runoff volume available for ground water recharge is presented in Chapter-5, Section (page# ) TC - 19 KKB Envirocare Consultants Pvt. Ltd., Hyderabad
44 NATCO Pharma Ltd.-Chemical Division- Chennai-EIA Report ToR Compliance Sl. No. Approved ToR xi) Total capital cost and recurring cost/annum for environmental pollution control measures shall be included xii) Action plan for post-project environmental monitoring shall be submitted xiii) Onsite and Offsite Disaster (natural and Man-made) Preparedness and Emergency Management Plan including Risk Assessment and damage control. Disaster management plan should be linked with District Disaster Management Plan 8. Occupational health i) Plan and fund allocation to ensure the occupational health & safety of all contract and casual workers ii) iii) Details of exposure specific health status evaluation of worker. If the workers' health is being evaluated by pre-designed format, chest x rays, Audiometry, Spirometry, Vision testing (Far & Near vision, colour vision and any other ocular defect) ECG, during pre-placement and periodical examinations give the details of the same. Details regarding last month analyzed data of above mentioned parameters as per age, sex, duration of exposure and department wise. Details of existing Occupational & Safety Hazards. What are the exposure levels of hazards and whether they are within Permissible Exposure level (PEL). If these are not within PEL, what measures the company has adopted to keep them within PEL so that health of the workers can be preserved. TC - 20 Compliances (All Chapters, Sections, Figures & Tables, referred here are from EIA Report) The existing capital cost of Rs.15 crores with additional cost of Rs. 5.0 crores is allocated towards environmental pollution control measures totaling to Rs.20 crores. The existing recurring cost for operation & maintenance is Rs.2.5 crores per annum with additional recurring will be Rs.12 Crores per annum totaling Rs.14.5 crores per annum. The item wise break-up of estimated cost for capital and recurring cost is presented in Table 5.4(page#5.21). Post-project environmental monitoring is described in Chapter-5, Section & (page# ). Disaster management plan for On-site and Off-site emergency preparedness plan is presented in Chapter-7, Section 7.8(page# ). Natural disaster mitigation measures are presented in Chapter-7, Section 7.7(page# ). Occupational health & safety is described in Chapter-5, Section 5.4 (page# ) and fund allocation to occupational health with recurring cost is presented in Table 5.6 (page#5.30). The annual medical check-up for the year 2017 for the employees of all the departments are as per the prescribed format including various diagnostic services has been carried out and maintaining the record. The pre-placement medical check-up format is at Annexure-XIV. Summary of department wise annual health check status of employee are presented in Chapter-2, Section (page# ). As per consequence of MCA analysis, heat radiation and toxic exposure level is presented in Chapter-7, Section 7.4(page# ). KKB Envirocare Consultants Pvt. Ltd., Hyderabad
45 NATCO Pharma Ltd.-Chemical Division- Chennai-EIA Report ToR Compliance Sl. No. iv) Approved ToR Annual report of health status of workers with special reference to Occupational Health and Safety 9. Corporate Environment Policy i) Does the company have a well laid down Environment Policy approved by its Board of Directors? If so, it may be detailed in the EIA report. ii) Does the Environment Policy prescribe for standard operating process / procedures to bring into focus any infringement / deviation / violation of the environmental or forest norms /conditions? If so, it may be detailed in the EIA. iii) What is the hierarchical system or Administrative order of the company to deal with the environmental issues and for ensuring compliance with the environmental clearance conditions? Details of this system may be given. iv) Does the company have system of reporting of non-compliances / violations of environmental norms to the Board of Directors of the company and / or shareholders or stakeholders at large? This reporting mechanism shall be detailed in the EIA report 10. Infrastructural Facilities Details regarding infrastructure facilities such as sanitation, fuel, restroom etc. to be provided to the labour force during construction as well as to the casual workers including truck drivers during operation phase. TC - 21 Compliances (All Chapters, Sections, Figures & Tables, referred here are from EIA Report) The annual periodical medical check-up for the year 2017 for the employees of all the departments are as per the prescribed format with reference to Occupational Health and Safety has been carried out and maintaining the record for future reference. The corporate environmental policy is described in Chapter-2, Section (page#2.15). A copy of approved EHS policy is at Annexure-XVI. The EHS Policy is described as (Annexure-XVI). Proponent is having a dedicated EHS department headed by Manager rank employee with 15 years of experience in the field of EHS management. There are about 7 employees working in EHS department. The EHS head is directly reporting to the General Manager-Operations who is directly overseen the EHS department (Chapter-2, Section (page# 2.15). Proponent has established the reporting mechanism of violations / deviations /noncompliances with respect to Environment. Regular management review meetings will be conducted at site level with all functional heads and chaired by Director & Executive Vice President. The minutes of meeting/decision will be presented to the Board by the Director & Executive Vice President (Chapter-2, Section (page# 2.15). Dedicated washrooms/toilets provided for men & Women. Potable cooled drinking water facilities provided across the facility. Separate rest rooms provided for men & women. Canteen facility provided. Occupational Health centre will be upgraded with full time resident factory medical officer & nursing staff round the clock. Proposed infrastructure facilities during construction phase are presented in Chapter-5, Section (page# ). Existing amenities/facilities will be strengthened/ Upgraded during operation phase are presented in Chapter-2, Section 2.4.1(page# ). KKB Envirocare Consultants Pvt. Ltd., Hyderabad
46 NATCO Pharma Ltd.-Chemical Division- Chennai-EIA Report ToR Compliance Sl. No. Approved ToR 11. Enterprise Social Commitment (ESC) i) Adequate funds (at least 2.5 % of the project cost) shall be earmarked towards the Enterprise Social Commitment based on Public Hearing issues and item wise details along with time bound action plan shall be included. Socio-economic development activities need to be elaborated upon. 12. Any litigation pending against the project and/or any direction/order passed by any Court of Law against the project, if so, details thereof shall also be included. Has the unit received any notice under the Section 5 of Environment (Protection) Act, 1986 or relevant Sections of Air and Water Acts? If so, details thereof and compliance/atr to the notice(s) and present status of the case. 13. A tabular chart with index for point wise compliance of above ToRs. B. Specific ToR 1. Details on solvents to be used, measures for solvent recovery and for emissions control 2. Details of process emissions from the proposed unit and its arrangement to control 3. Ambient air quality data should include VOC, other process specific pollutants like NH 3, Chlorine, HCl, HBr, H 2 S,HF etc.as applicable 4. Work zone monitoring arrangements for hazardous chemicals Compliances (All Chapters, Sections, Figures & Tables, referred here are from EIA Report) An amount of Rs. 5.0 Crores are earmarked towards ESC activities (Table 8.1(page#8.3). The proposed socio-economic development activities are presented in Chapter-8, Section 8.3 (page# ), Table 8.1(page#8.3). The public hearing is exempted under para 7(ii) of EIA notification since unit is located in Manali Industrial Area. No litigation/court case pending against this proposed project in any court of law. Separate Chapter presented in EIA report at the beginning under ToRs compliance. The list of raw materials including solvents is presented in Table 2.9 (page# ). Solvent recovery measures and for emissions control is described in Chapter-4, Section (page# ). Maximum Process emissions with their quantities and treatment method are presented in Table 4.2(page#4.10) and control measures are presented in Chapter-4, Section (page# ). All the NAAQs parameters including VOC and HC are included in the Baseline Ambient air quality data and presented in Chapter-3, Section 3.1.8(page# ), Table 3.1.4(page# ). Industry installed 3 Online VOC monitoring system with Alarm mechanism within the plant premises at suitable Work zone places to know fugitive emission concentrations in the Ambient Air. In addition to this Industry regularly monitoring all the work zone places with Hand held instrument (Chapter-5, Section (page# ). 5. Detailed effluent treatment scheme The effluent treatment scheme including including segregation of effluent segregation of effluent streams for units adopting streams for units adopting 'Zero' TC - 22 KKB Envirocare Consultants Pvt. Ltd., Hyderabad
47 NATCO Pharma Ltd.-Chemical Division- Chennai-EIA Report ToR Compliance Sl. No. liquid discharge Approved ToR 6. Action plan for odour control to be submitted. 7. A copy of the Memorandum of Understanding signed with cement manufacturers indicating clearly that they co-process organic solid/hazardous waste generated. 8. Authorization/Membership for the disposal of liquid effluent in CETP and solid/hazardous waste in TSDF, if any. 9. Action plan for utilization of MEE/dryers salts. 10. Material Safety Data Sheet (MSDS) for all the Chemicals are being used/will be used. 11. Authorization/Membership for the disposal of solid/hazardous waste in TSDF. Compliances (All Chapters, Sections, Figures & Tables, referred here are from EIA Report) 'Zero' liquid discharge is presented in Chapter-4, Section (page# ). Action plan for odour control is presented in Chapter-5, Section (page# ). Hazardous/solid waste generated from different sources, their storage, utilization and management is presented in Chapter-4, Section (page# ). Industry had an agreement with TSDF for disposal of Hazardous / Solid waste and will continue the same in proposed expansion. Copy of TSDF agreement is presented at Annexure-XLVII. CETP is not applicable to this industry as the industry is continued to operate the ETP with ZLD concept. Industry is continued to do R&D activity to utilize the ATFD salts from the activity. MSDS for all the chemicals to be used is presented in Volume-II of EIA report. Industry had an agreement with TSDF for disposal of Hazardous / Solid waste and will continue the same in proposed expansion. Copy of TSDF agreement is presented at Annexure-XLVII. 12. Details of incinerator if to be installed Industry has installed Incinerator in the existing plant premises and details are presented in Chapter- 2, Section 2.3.5(page# ). 13. Risk assessment for storage and handling of hazardous chemicals/solvents. Action plan for handling & safety system to be incorporated. 14. Arrangements for ensuring health and safety of workers engaged in handling of toxic materials. C. Additional ToRs 1. Layout plan earmarking the space for Green belt of atleast 10m width around the periphery of the unit with perennial native trees shall be submitted. 33% of the unit area shall be developed as green area with trees. 2. A plan for implementation of Zero Liquid Discharge shall be submitted. Risk mitigation measures during storage, handling and for spill (small/large), fire and handling as well as toxic releases is presented in Chapter-7, Section 7.5(page# ). Health and safety of workers engaged in handling of toxic materials is discussed in Chapter-4, Section (page# ). Plant layout showing width of the green belt along the periphery of the unit is presented in Chapter-5, Fig 5.2 (page# 19). Perennial native trees are presented in Table 5.2 (page# 20). The effluent treatment scheme including segregation of effluent streams for units adopting 'Zero' liquid discharge is presented in Chapter-4, Section (page# ). TC - 23 KKB Envirocare Consultants Pvt. Ltd., Hyderabad
48 NATCO Pharma Ltd.-Chemical Division- Chennai-EIA Report ToR Compliance Sl. No. Approved ToR 3. Chemical name along with CAS no of the proposed product shall be included in the EIA report. 4. At least 5 % of the project cost shall be earmarked for Enterprises Social Commitment (ESC). ESC plan for 5 years with facilities like drinking water (RO), led/solar panel, Computer/smart class, to the nearby villages shall be submitted. Compliances (All Chapters, Sections, Figures & Tables, referred here are from EIA Report) Chemical name along with CAS no. of the proposed products are presented in Chapter-2, Table 2.7(page# ). Rs. 5.0 Crores (5% of additional investment of Rs.100 Cr.) are earmarked for Enterprises Social Commitment (ESC). ESC plan for 5 years with facilities are presented Chapter-5, Section (page# 5.22), Table 5.5 (page# 23) TC - 24 KKB Envirocare Consultants Pvt. Ltd., Hyderabad
49 Executive Summary
50 NATCO Pharma Ltd., Chemical Division Chennai-EIA report Executive Summary 1.0 Introduction M/s NATCO Pharma Limited, Chemical Division, Chennai proposes to expand its Active Pharmaceutical Ingredients (APIs) & its Intermediates manufacturing with R&D facility in the existing premises of Ha located in R.S.Nos. 73/1A, 73/2, 74/7B, 78/1B, 79/1, 79/2B, 79/3, 79/4B, 79/5, 79/6A, 79/6B, 79/7, 80/1, 80/2, 80/3, 80/4, 84/1, 84/2, 84/3A, 84/5A, 84/6, 84/7A, 85/1, 85/2B, 86/2B, 86/2C, 86/2D2, 86/3B, 86/4, 86/5, 86/6, 86/7, 86/8, 86/9 of Manali Industrial Area, Thiruvottiyur Taluk (formerly Vaikkadu (V), Ambattur (Tq.)), Thiruvallur District, Tamil Nadu. The existing investment of Rs Crores with additional investment of Rs.100 Crores is being invested totaling Rs crores. Total land of Ha is in possession of project proponent. The expansion proposal is to obtain Environmental Clearance (EC) from the Ministry of Environment, Forests and Climate Change (MoEF&CC) to manufacture 16 campaign products at a time out of 42 APIs proposed products and R&D activity with a production capacity of TPA from existing production capacity of TPA. The existing capital cost Rs.15 Crores with additional cost of Rs.5 crores is allocated towards Occupational Health, Safety & environmental pollution control measures totaling to Rs. 20 Crores. Existing recurring (operation and maintenance) cost is Rs. 2.5 crores per annum with additional recurring cost will be about Rs.12 Crores per annum totaling to Rs.14.5 Crores per annum. The EIA report is prepared considering the MoEF&CC approved Terms of Reference (ToR) vide No. J-11011/119/2017-IA II (I) dated and submitted to expert appraisal committee (EAC) for its appraisal. The expert appraisal committee has exempted the public hearing under para 7(ii) of EIA notification. All Synthetic Organic Chemicals Industry located in a notified Industrial Area/estate are listed at S. No. 5(f) of Schedule of EIA notification 2006 and its amendments under Category-B but due to the applicability of general condition (located in Critically Polluted Area), it is considered under Category-A and is apprised at Central level by Expert Appraisal Committee (EAC). 2.0 Project Description NATCO Pharma, Chemical Division manufactures Active Pharmaceutical ingredients (APIs) in bulk quantities for both domestic and international markets were established in the year 2007 in Manali Industrial Area. All the drugs manufactured meets international standards, which bear testimony to its commitment to adopt strict quality standards set by international quality agencies. ES.1 KKB Envirocare Consultants Pvt. Ltd., Hyderabad
51 NATCO Pharma Ltd., Chemical Division Chennai-EIA report Executive Summary 1. Name & Address M/s NATCO Pharma Ltd. Chemical Division-Chennai, Manali Industrial Area, Thiruvottiyur Taluk (formerly Vaikkadu (V), Ambattur (Tq.)), Thiruvallur District, Tamil Nadu. 2. Area of the project Ha 3. Latitude and Longitude 13 11'19.5"N and "E 4. Elevation 4 m 5. Products Manufacture of 16 campaign products at a time out of 42 APIs proposed products and R&D activity with a production capacity of TPA 6. Production capacity MT/Year 7. Capacity of Boilers Existing: 3 TPH furnace oil fired boiler. Additional: 6 TPH furnace oil fired boiler Total after expansion: 6 TPH furnace oil fired boiler and existing 3 TPH boiler will be standby 8. Capacity of DG sets Existing: 1010 KVA and 300 KVA. Additional: 2x10¹⁰ KVA & 100 KVA Total after expansion: 3 X 10¹⁰ KVA & 100 KVA Existing 300 KVA DG set will be removed. DG sets are used as standby during power failure. 9. Water requirement 576 KLD (Fresh water 303 KLD and Reused treated effluent of 182 KLD in cooling tower makeup and 91 KLD recovered as steam condensate from boiler). Fresh water consumption will be reduced. 10. Power requirement 2350 KVA; 3250 HP 11. Fuel requirement Furnace oil : 400 lph HSD-630 lph for DG sets 12. Manpower incl. Existing 350 nos. Direct & 100 nos. Indirect 13. EMP Budget for Pollution control measures EMP Recurring cost 14 ESC Budget Rs. 5 Crores Rs. 20 Crores Including existing Rs Crores per annum including existing Rs. 2.5 Crore per annum 2.1 Process Description The manufacturing process consists of chemical synthesis extending to a maximum of eighteen stages and minimum of one stage of processing involving different types of chemical reactions. These drugs are mainly used for human Medication after formulation activity for various diseases. Technology for manufacturing proposed products is available from in-house R&D & Process consultants. Industry will implement the proven technologies developed in the R&D for the cost effective & environmental friendly practices. The process description, flow chart, route of synthesis and material balance etc. for the manufacturing of proposed products are presented in volume-ii of EIA report separately. In the manufacturing process various kinds of solvents will be used, so the quantity of different solvents used, recovered, lost and solvent balance cycle is described in EIA report. ES.2 KKB Envirocare Consultants Pvt. Ltd., Hyderabad
52 NATCO Pharma Ltd., Chemical Division Chennai-EIA report Executive Summary Proposed products with their production capacity and Therapeutic use S. Quantity Quantity Product No. kgs//day (TPA) CAS No. Therapeutic Category 1. Bendamustine HCl Antineoplastic agent 2. Bortezomib Antineoplastic agent 3. Decetabine Antineoplastic agent 4 Everolimus Antineoplastic agent 5 Temsilrolimus Antineoplastic agent 6 Trabectedine Antineoplastic agent 7 Busulfan Antineoplastic agent 8 Lenalidomide Antineoplastic agent 9 Nelarabine Antineoplastic agent 10 Thiotepa Antineoplastic agent 11 Azacitidine Antineoplastic agent 12 Chlorambucil Antineoplastic agent 13 Doxorubicin Hydrochloride Antineoplastic agent 14 Epothiline B Antineoplastic agent 15 Fulvestrant Antineoplastic agent 16 Pomolidomide Antineoplastic agent 17 Sirolimus Immunosuppressive agents 18 Carmustine Antineoplastic agent 19 Melphalan Antineoplastic agent 20 Cabozantinib-S-Malate Antineoplastic agents 21 Dasatinib Monohydrate Antineoplastic agents 22 Erlotinib Hydrochloride Antineoplastic agents 23 Geftinib Antineoplastic agents 24 Imatinib Mesylate Antineoplastic agents 25 Lapatinib Ditosylate Monohydrate Antineoplastic agents 26 Nilotinib Hydrochloride Antineoplastic agents 27 Palbociclib Antineoplastic agents 28 Pazopanib Hydrochloride Antineoplastic agents 29 Sorafenib Tosylate Antineoplastic agents 30 Sunitinib Malate Antineoplastic agents 31 Dabigatran Etexilate Anticoagulant 32 Deferasirox Chelating Agents 33 Lansoprazole Proton pump inhibitors 34 Lanthanum Carbonate Dihydrate Renal and genitourinary agent 35 Ledipasvir Antiviral 36 Ondansetron Hydochloride Dihydrate Antimetic 37 Pirfenidone Anti-inflammatory agent 38 Rizatriptan Benzoate Antimigraine 39 Sacubitril Cardiovascular Agent 40 Sertaline Hydrochloride Selective serotonin reuptake inhibitors 41 Sumatriptan Succinate Antimigraine 42 Ticagrelor Platelet Aggregation Inhibitor Total 16 products at time out of total 42 products R & D Activity Developmental Products (D) Total 16 products at time out of total 42 products and R&D products Source: NATCO Pharma Limited - Chemical Division, Chennai ES.3 KKB Envirocare Consultants Pvt. Ltd., Hyderabad
53 NATCO Pharma Ltd., Chemical Division Chennai-EIA report 3.0 Description of the Environment Executive Summary 3.1 Topography The project study area (10 km) is exhibiting plain topography. This proposed expansion project site is located at a distance (aerial) of 8 km (W) from National Highway No.16 (Chennai- Kolkata); about 0.25 km (W) from Andarkuppam village; about 0.9 km from Kanniyammanpettai village (W); Manali Town at 1.6 km (S); Tiruvottiyur railway station at 4.4 km in SE direction; Chennai International Airport at 23 km in SSW direction; Harbour (Chennai Port) at 7 km (SSE);. 5.5 km (E) to Bay of Bengal; Land Use Category: Special and Hazardous Use Zone as per Chennai Metropolitan Development Authority (CMDA). 3.2 Study period Baseline environmental data generation of study area was carried out during March to May Data has been generated by following the approved procedures of the Ministry of Environment, Forests and Climate Change and the Central Pollution Control Board guidelines. Study area of 10 km radial distance around the site has been considered for the EIA study. 3.3 Meteorology Meteorological data for summer season 2017 have been generated in the plant site. The predominant wind direction during the study period is SE, SSE and SSW directions. The average wind speed ranges from 0.5 to 5.7 m/s. The minimum and maximum temperature during study period is 21.4 o C and 41.2 o C respectively. 3.4 Ambient Air Quality The National Ambient Air Quality Standards (NAAQS) parameters & VOC were monitored at eight locations during the study period. The maximum 24 hourly PM 10 and PM 2.5 concentrations at all locations varied from µg/m 3 and µg/m 3 respectively. The maximum concentrations of SO 2 were observed in the range from μg/m 3. The NOx concentration was in the range from μg/m 3. The Volatile Organic Compounds monitored at difference locations in the study area were found in the range of BDL-0.4 ppm. In plant site the VOC conc. are in the range of ppm. The NH 3 concentrations at all locations are ranged from BDL - 42µg/m 3. Other parameters CO, Pb, HC etc., of ambient air quality in the study area are found below detectable limit. 3.5 Ambient Noise Levels Ambient noise levels were monitored at eight locations within study area. The observed noise level in the study area ranges from 52.2 to 61.7 db (A) during day time and ES.4 KKB Envirocare Consultants Pvt. Ltd., Hyderabad
54 NATCO Pharma Ltd., Chemical Division Chennai-EIA report Executive Summary 42.6 to 55.4 db (A) during the night time. The noise levels at all the locations in study area during day & night are meeting the Noise standards in respective of category of Area / zone. 3.6 Water Quality Nine samples of surface water were collected in the study area. Most of the sources are used for other purpose than drinking. Metrowater supply the drinking water in the area. Nine samples of groundwater were collected in the study area. Survey in the selected sample villages within 10 km radius revealed that all the sample villages use bore water supplied through overhead tanks, public stand posts and house connections for domestic purposes other than drinking. All the surveyed villages are supplied drinking water by Metrowater. The bore wells etc. are used for other purposes. All sample locations can be used for drinking purpose after conventional treatment followed by disinfection except at Kosasthalaiyar river (north side) and sea water. In ground water, higher concentrations indicate as hard waters because of Geological conditions and also site is in the very old industrial area having different kind of industries located in the area. The analysis results show that TDS, alkalinity, hardness, chlorides are higher than acceptable limits as per IS Soil Quality Fourteen soil samples were collected and analyzed. The predominant soil texture is loam, silty loam, silt clay loam and clay loam type. The ph values in the study area are varying from showing moderately acidic to moderately alkaline during study period. Organic carbon present in soil samples collected show average sufficient to more than sufficient except at plant site and near Kodipallam locations, which is less to medium. Nitrogen presence varies from kg/ha indicates more than sufficient, whereas phosphorus present varies from kg/ha indicate more than sufficient. Potassium present varied from kg/ha indicates more than sufficient. 3.8 Sensitive Ecosystem There are no ecologically sensitive areas like national park, wildlife sanctuary, wetland, and archaeological monuments present within 10 km radius of the project site. There is no reserved forest in the study area. None of the plant species and animals present in the study area belongs to threatened or endangered categories. 3.9 Biological Environment There are no biosphere reserves within 10km radius of the study area. As there are no rare or endangered or endemic or threatened (REET) species of plants and animals, the proposed project is not going to pose any threat to local flora and fauna. ES.5 KKB Envirocare Consultants Pvt. Ltd., Hyderabad
55 NATCO Pharma Ltd., Chemical Division Chennai-EIA report Flora Executive Summary The plant resources in core area consisted of 43 species belonging to 39 genera and 19 families. The predominant life forms include Trees (14sp) followed by Herbs (23sp) & Shrubs (6sp). The plant resources of the buffer area account about 282 plants species belonging to 232 genera and 92 families. The predominant life forms includes Herbs (108 sp) followed by Trees (77sp), Shrubs (40sp), Climbers (128 sp), Grasses (17sp) & Hydrophytes (11 sp) of which Leguminosae (40 sp) was the most specious family followed by Poaceae (18sp), Acanthaceae (14sp) & Malvaceae (13 sp), which represent most of the vegetation is of non-forest flora Fauna In the core zone, no mammals were recorded during the study period. Where as in birds 4 species were recorded, species such as Plain prinia, Red vented bulbul & Common Babbler are the common species which are encountered during the survey period. In Herpeto fauna 3 species were recorded namely Common garden lizard, Common Indian bull frog & tree frog. Invertebrates, includes 2 species, common species are Common Mormon & Damsel fly are the common species. In the buffer zone a total of 145 species of fauna were recorded of which Mammals 15 sp, Birds 62 sp, Reptiles 12 sp, Amphibians 4 sp, Invertebrates 32 sp & Fishes 20 sp. Mammals includes Squirrel, Common Mongoose, Rhesus Monkey are the key stone species of the area. The Reptiles represented with 12 species belonging to 2 orders & 4 families. 4 species of amphibians Tree Frog and South Indian Toad are common in occurrence. Among the birds, 62 species are recorded; important species of the area are Asian Palm Swift, Cattle Egret, Grey Heron, Black Kite, Small Green Bee-eater, Black Drongo & Pied kingfisher. 4.0 Impact Assessment and Mitigation Measures 4.1 Air Environment Process emissions Manufacturing of APIs and its intermediates will result in gaseous emissions like HCl, SO 2, H 2, CO 2, methyl bromide, O 2, N 2, Cl 2, chloroethane, Dimethylamine, and NH 3 emissions are liberated from the process. Emissions from the reactors will be connected to dual scrubber with suitable chilled or room temperature liquid to scrub the gases effectively with water / caustic / dilute HCl based on the nature of the gas. HCl will be scrubbed using water and caustic lye solution. The SO 2, methyl bromide, Cl 2 emissions will be scrubbed using caustic soda lye solution. CO 2 will be scrubbed using CS lye solution. NH 3 will be scrubbed using chilled water. H 2 will be diffused with flame arrestor and N 2, & O 2 will be dispersed into atmosphere. Dimethylamine will be scrubbed in water. The scrubbed ES.6 KKB Envirocare Consultants Pvt. Ltd., Hyderabad
56 NATCO Pharma Ltd., Chemical Division Chennai-EIA report Executive Summary solutions are sent to ETP for further treatment and reuse. Its impact will be reduced by releasing them through stack of suitable height. The vents of the scrubber s gases will be dispersed into atmosphere through a stack above the production block. Hence it is necessary to minimize the process emissions at source as well as to control effectively before sending out to atmosphere Fugitive emissions The total solvent handled for manufacturing 16 campaign products will be KLD. Around 50% (23 KLD) of the solvents will be distilled out from the reactors after the reaction for reuse. About 47.46% (21.94 KLD) will come out as spent solvents which will be sent to distillation reactor for further recovery of solvents for reuse / sold to authorized recyclers, 0.13% in product, 0.56% will be in effluent & residue and the remaining 1.84% in handling loss. Solvent Input Effluent Solvent in Organic residue Handling loss Solvent Recovery Recovered Spent from solvents for reactor for in-house reuse recovery In product KLD 0.2 KLD 0.06 KLD 0.85 KLD 23 KLD KLD 0.06 KLD 50 % % 0.13 % 100% 0.43 % 0.13% 1.84% 97.6 % To maximize the solvent recovery efficiency, solvent in effluent also recovered through steam stripper, Hence total solvent recovery will be 98.03%, industry has employed the effective solvent handling technics in the process. Mostly Solvents are handled in closed conditions to minimize the losses in the form of evaporation and also industry will take effective measures for reduction of fugitive emissions by providing vent condensers to the storage tanks, day tanks and receivers with breather valves. Chilled water & chilled brine circulation will be provided to the condensers which ensures the recovery of around 98% and also controlled by closed operations and handling methods. The reactors used for handling the solvents shall be connected with mechanical seals to avoid the solvent vapour loss and also provided with double condensers with receivers. To minimize the vapour loss in closed centrifuge operation, a closed handling system will be adopted and the centrifuge vents are connected with adequate vent condensers with chilled brine circulation. ES.7 KKB Envirocare Consultants Pvt. Ltd., Hyderabad
57 NATCO Pharma Ltd., Chemical Division Chennai-EIA report Executive Summary The purpose of solvent recovery system is to recover solvents from spent solvent streams and to reuse the pure solvent in manufacturing process. Industry is having integrated solvent recovery system in the process to recover the pure and spent solvents after reaction. The entire distillation operation of all streams is carried out in reactors. Vent condensers are provided to all reactors where solvents are being distilled. The vent condensers will be circulated with chilled water in the primary condenser and chilled brine in the secondary condenser. The pure solvent collected and reused in the manufacturing process. The solvents which are not fit for use are sent to authorized recovery units for recovery. To control the fugitive emissions generated during various operations in the industry, the mitigation measures delineated will be adopted Emissions Utilities Boiler, Incinerator and DG sets are the point source emissions from the proposed expansion project. The plant has a one furnace oil based steam boiler with a capacity of 3 TPH wherein oil consumption is 200 lph. In present expansion program, it is proposed to add 6 TPH furnace oil based steam boiler and the existing 3 TPH boiler will be standby. Total fuel consumption for steam generation after expansion is maximum 400 lit/hr. Generated steam is going to be used for process/ operation units. About 400 lph Furnace oil will be used for steam generation from 6 TPH boiler, Sulfur dioxide (SO 2 ) and Oxides of Nitrogen (NOx) will be the major pollutants. Existing stack height of 40 m is meeting the CPCB guidelines of 39.6 m stack height considering the 4% sulfur content in the furnace oil. The NOx emissions from the boilers will be controlled by controlling combustion measures, which will be approached by way of low NOx burners or by air stagging in boiler. These are in addition to the existing 3TPH furnace oil fired boiler, which will be standby. Existing incinerator (100 kg/hr) will be utilized with 40m stack attaching to wet scrubber. Stack as per CPCB guidelines will be provided to the proposed DG sets of 2x10¹⁰ KVA and 100 KVA. These are in addition to the existing DG sets of 1010 KVA and 300 KVA However, 300 KVA DG set will be removed. DG sets will be used as standby during power failure. Diesel about 630 lit / hr will be used at full operation load in the DG sets. The various measures proposed to minimize the pollution from the boiler are as follows: To facilitate wider dispersion of pollutants, 40m height stack will be installed. Stacks will be provided to DG sets as per CPCB / SPCB Guidelines. Incinerator (100 kg/hr) with stack height of 40m attached with scrubber. Gaseous pollutants will be generated during steam boiler operation, considered as point source emissions (SO 2, NO x, & SPM) which are harmful to the human health and ES.8 KKB Envirocare Consultants Pvt. Ltd., Hyderabad
58 NATCO Pharma Ltd., Chemical Division Chennai-EIA report Executive Summary environment. Proposed steam boiler of 6 TPH is considered as reference point (10 km, 10 km). The stack emission details and flue gas characteristics along with emission rate for individual pollutants used for prediction of air quality impacts including existing emission details of steam boiler and Incinerator are given below. Source Stack Height Diameter (m) (m) Temperature ( o C) Flue Gas Flow rate (m 3 /hr) Exit Gas Velocity (m/sec) PM SO 2 NOx kg/hr Furnace Oil Fired Steam Boilers 6 TPH (proposed) TPH (Existing Standby) Incinerator Incinerator kg/hr Diesel Generator (DG) sets 1010 KVA KVA KVA KVA Note: Proposed DG sets of 2x10¹⁰ KVA and 100 KVA. These are in addition to the existing DG set of 1010 KVA. DG sets will be used as standby during power failure. Existing 300 KVA will be removed after expansion The model result has the highest SPM concentration of µg/m 3 at receptor location of 0.71 km and µg/m 3 at 1.12 km from the project site for a maximum total emission rate of g/s from proposed steam boiler of 6 TPH and Incinerator. The concentration of SPM will travel to a maximum predicted distance of around 10 km towards NW and NNW side of project site and all the values are less than 0.04 µg/m 3. Predicted concentration values of SO 2 on 24 hourly basis for an estimated emission load (7.964 g/s) from proposed steam boiler of 6 TPH. The predicted maximum 24 hourly concentration of SO 2 is varied from 3.99 to 8.95 µg/m 3 within a distance of 2.5 km from project site. The impact zone covers NW-NNE sector in accordance with prevailing winds (SE-SSE) covers up to a distance of 10 km. The SO 2 impact from the proposed expansion project would diminish to 0.5 µg/m 3 at 10 km radial distance from project site. Accordingly SO 2 impact from the proposed project would be well within the prescribed limits, NAAQS for residential, rural and other areas during normal operation phase. For estimated emission load of NOx (1.547g/sec), predicted ground level concentration of NOx for proposed boiler and incinerator in the form of isopleths (24 hourly averages) is shown up to 10 km. The maximum NOx predicted values are in the range of 0.85 to 2.2 ES.9 KKB Envirocare Consultants Pvt. Ltd., Hyderabad
59 NATCO Pharma Ltd., Chemical Division Chennai-EIA report Executive Summary µg/m 3 which is reflecting as in SO 2. Predicted values are at downwind distance in NW -NNE direction during summer season. Predicted NOx levels are 0.2 µg/m 3 at 10 km radial distance at wind ward side. It indicates that all the values are well within the prescribed NAAQS for residential, rural and other areas even after superimposing on existing background level concentration of NOx. The predicted values indicate that affected area covers at wind ward direction (NW, NNE) up to 10 km. The predicted concentration of SO 2 is higher when compare with NOx values, being industry is using high Sulphur (4 %) content of oil and is reflecting in emission load, whereas SPM for summer season is negligible when compare with back ground concentration. Pollutant Maximum Incremental Level (µg/m 3 ) The GLC predictions Maximum Baseline (µg/m 3 ) Maximum Resultant (µg/m 3 ) NAAQ Standard (24 hrs) (µg/m 3 ) PM SO NOx From the above prediction for proposed APIs and its intermediates unit, it is clear that maximum ground level concentrations of PM 10, NOx and SO 2 emissions from the proposed plant emissions will be µg/m 3, µg/m 3, 32.2 µg/m 3 respectively, which are within standards. Also, the maximum impact zone for all the pollutants is within 0.7 km radial zone from the proposed stacks. The nearest village is Andarkuppam, which is at a distance of 0.25 km in W direction to the plant site but is not in prevalent wind direction. Hence, the expected impact can be termed as of insignificant. Besides, GLC s prediction on the location of baseline monitoring stations also shows insignificant increment as a result of proposed expansion project over the existing ambient air quality. 4.2 Noise Environment The only noise generating sources are DG sets, motors and rotating machinery like pumps/blowers/ compressors etc. DG sets will be installed with inbuilt acoustic enclosures. DG sets will be functioning only at the time of power failure. There is no need for the workers to be near this unit continuously. However the workers in this area will always provided with ear muffs. The nearest habitation is Andarkuppam village; which is at a distance of 0.25 km from the plant boundary with a 10 m width greenbelt. Hence no impact of noise will be felt at this village. Under the general health check up scheme as per factory act, the workers will be examined for any noise induced Hearing Loss (NIHL) by a trained ENT Doctor. ES.10 KKB Envirocare Consultants Pvt. Ltd., Hyderabad
60 NATCO Pharma Ltd., Chemical Division Chennai-EIA report 4.3 Water Environment Executive Summary The sources of wastewater generation are from the process, floor & reactor washings, utilities, Q.C, R&D, scrubber and plant domestic waste. Total proposed wastewater will be 195 KLD, which will be segregated into Stream- 1 (TDS/COD > mg/l), Stream- 2 (TDS/COD < mg/l and > 5000 mg/l) and Stream -3 (TDS/COD < 5000 mg/l) considering TDS / COD concentrations and collected by gravity into a collection tank separately. These effluents will be pumped to the RCC lined tanks for storage and neutralization then sent to ETP and treated with ZLD concept. The treated effluent is reused in cooling towers. Flow chart is given below. Effluent Treatment Flow as per Segregation Effluent Characteristics Stream -1 (Process) TDS > mg/l COD > mg/l Stream- 2 (Process, Washings, Scrubber, QC, R&D and Domestic) TDS < mg/l COD < mg/l Stream 3 (Utility) TDS < 5000 mg/l COD < 5000 mg/l Quantity (KLD) Treatment Flow Collection Equalization Neutralization Settling Holding Stripper MEE MEE Concentrate to ATFD. Stripped Solvent sent for Incineration / cement industries for co-processing. Salt sent to Tamil Nadu Waste Management Limited (TNWML). Vapour condensate sent to Secondary RO. ETP Primary RO HP RO Secondary RO. Treated in ETP consists of primary treatment, electro chemical oxidation, two stage secondary treatment & sludge treatment. Tertiary treatment consists of Primary RO, HP RO, and Secondary RO. Secondary RO permeate recycled to cooling towers, HP RO rejects sent to MEE & ATFD along with HTDS. Treated in lamella clarifier and sent to primary RO along with Stream-2 treated water for treatment in Tertiary treatment system. 4.4 Land Environment The proposed expansion project site (10.57 Ha) is plain existing industrial land as there is no crop development in this project site. Therefore, the NATCO Pharma plant activities are unlikely to alter the agricultural and land-use pattern in the study region Hazardous / Solid Waste Hazardous/Solid waste generated from the various stages of proposed expansion of APIs and its intermediates manufacturing plant is given as under. ES.11 KKB Envirocare Consultants Pvt. Ltd., Hyderabad
61 Sl. No. NATCO Pharma Ltd., Chemical Division Chennai-EIA report Description 1. Process Organic residue 2. Distillation residue (1% of solvent recovery) 3. Spent carbon (a) Inorganic salt (Process) (b) Evaporation salt (Process) Evaporation salt (Non-Process) 6. ETP Sludge 7. Incinerator ash 8. Spent Catalyst (Spent Raney Nickel catalyst-0.03, Spent Palladium Catalyst-0.03) Hazardous/ Solid Waste Generation, Handling and Disposal Schedule as HW rules 28.1 of Schedule -I 36.1 of Schedule -I 28.3 of Schedule -I 28.1 of Schedule -I 35.3 of Schedule -I 35.3 of Schedule -I 35.3 of Schedule -I 37.2 of Schedule-I 28.2 of Schedule-I Other Hazardous Waste generation from the Plant Detoxified Container / Liners drums, HDPE 33.1 of 9. Carboys, Fiber Drums, Schedule-I PP Bags Spent solvents with moisture (22 KLD) Recovered solvents from spent solvents Spent Mixed solvents (2 KLD from SRS KLD with 50% moisture from ETP) 13. Waste oils & Grease 14. Used Lead acid Batteries 15. Date expired Off specification products/ chemicals Spill control Wastes/ Residues containing Oil 28.6 of Schedule -I 28.6 of Schedule -I 28.6 of Schedule -I 5.1 of Schedule-I A1160 of Schedule-III 28.5 of Schedule-I 28.4 of Schedule-I 5.2 of Schedule-I Proposed Quantity (TPD) Proposed Quantity (TPA) Handling Method HDPE Bags / Drums HDPE Bags Drums Nos./ month 22 KLD 7920 KL/A 20 KLD 7200 KL/A 2.4 KLD 864 KL/A Stored in Scrap yard Tanks / Drums Tanks / Drums Tanks/ Drums -- 4 KL/A MS Drums Nos/A Stored in Covered shed HDPE Bags and stored in covered shed Executive Summary Disposal Sent to Authorized Cement Industries (or) TNWML for incineration (or) disposed in in-house incineration in the plant premises Sent to Tamil Nadu Waste Management Limited (TNWML) Sold to Authorized Recyclers (or) Sent to TNWML After Detoxification sent to outside agencies or recyclers Recovered within the premises duly sending the residue to TNWML (or) On-site incineration of distillation residue. Reuse in process (or) sold to authorized recyclers Sent to Cement industries for Co-Processing (or) Sent to TNWML for incineration (or) On-site Incineration (Existing) Sent to authorized re-processors (or) TNWML Sent to suppliers on buyback basis. Sent to TNWML (or) Cement Industries for processing (or) On-site Incineration (existing Incinerator) Sent to TNWML * Solid waste quantities maximum on various combinations i.e., 16 products on campaign products at a point of time and R&D products **50% pure solvents recovered in process reactors for reuse and balance will be spent solvents. ES.12 KKB Envirocare Consultants Pvt. Ltd., Hyderabad
62 NATCO Pharma Ltd., Chemical Division Chennai-EIA report Executive Summary Non-Hazardous Waste Generation, Handling and Disposal Sl. No. 1 2 Source Non-hazardous waste (Domestic canteen waste, discarded papers) Non-hazardous waste (Paper/cartons /packing materials, glass, plastic/used PPE, etc.) Proposed Quantity (TPD) Proposed Quantity (TPA) Used Insulation waste Metal scrap (MS/SS/ Aluminum) Handling Packed in drums / HDPE bags Stored in Scrap yard Stored in Scrap yard Stored in Scrap yard Disposal Handed over to local waste collection system Sent to outside agencies / recyclers Biomedical Waste and E- Waste Generation, Handling & Disposal Sl. No Name of the waste Category : Yellow (h) Decontaminated media from Microbiology Lab Category: White Waste sharps from OHC (Needles, syringes, scalpels, blades, glass, etc.) Category : Yellow (c) Soiled Waste from OHC (cotton, dressings, soiled plaster casts, other material) Category : Red) Contaminated Waste (Recyclable) (wastes generated from disposable items other than the waste sharps such as tubings, catheters, intravenous sets etc) Quantity (kg/day) Quantity (TPA) E waste Disposal option Pre-treat to sterilize with nonchlorinated chemicals on-site as per BMW Rules and sent to PCB authorized agency for incineration. Autoclaving and sent to PCB authorized agency. Sent to PCB authorized agency for incineration. Autoclaving and shredding and sent to PCB authorized agency. Sent to authorized E-waste collection centres/ registered dismantlers / authorized recyclers/ return back to manufacturers. Hence, impacts on land due to the solid / hazardous waste are not envisaged. In addition to these mitigation measures, proponent will be dedicated to maintain healthy greenbelt, which can have beneficial impact to land use, land cover and for prevention of erosion of topsoil. 4.5 Socio-Economic Environment Population in the study area as per 2011 census is persons. Literacy pattern of the study area was reported to be around 88% of the total population of the study area. Total work force in the area was reported to be around 87%. ES.13 KKB Envirocare Consultants Pvt. Ltd., Hyderabad
63 NATCO Pharma Ltd., Chemical Division Chennai-EIA report Executive Summary Operation phase of proposed expansion project will require workforce of Direct (350) and Indirect (100) persons including the existing staff. Preference will be given to local people. Migration of persons with better education and professional experience will result in increase in literacy and betterment of the surrounding villages. Under the Enterprise Social Commitment, the Industry will develop a policy of developing the villages in the vicinity by identifying the requirements. 5.0 Handling of Hazardous Chemicals, Waste and Risk Assessment The APIs and its intermediates manufacturing industry has to handle many such chemicals that are hazardous in nature. Once these chemicals are used for some reactions, some hazardous wastes are generated. The industry will continue to provide special training to the workers handling Hazardous chemicals / wastes. Only highly trained personnel with personal protective equipment s (PPE s) will be allowed to handle such chemicals or wastes under strict supervision. 6.0 Occupational Health Hazards The principle of occupational health hazards posing danger to the health of personnel are boiler area, reactors area, incinerator area, loading and unloading sections in the store area, solvent storage area, acid and alkali handling/storage areas, oil storage areas, Handling storage and disposal of Hazardous wastes etc., EHS cell will ensure employees in these areas to use PPEs with proper precautions. First aid boxes are placed in all activity areas. Occupational Health Center with Ambulance facility is available at the plant. 7.0 Greenbelt Development Industry developed the Greenbelt in and around the plant boundary to extent of 3.51Ha (33.2%). The green cover proved beneficial such as retention of soil moisture, prevention of soil erosion, recharge of ground water, noise attenuation, dust control and moderation of the micro-climate of the area. 8.0 Post- Project Environment, Health & Safety Monitoring Proponent is having a dedicated EHS department headed by Manager rank employee with 15 years of experience in the field of EHS management. There are about 7 employees working in EHS department. The EHS head is directly reporting to the General Manager- Operations who is directly overseen the EHS department. Proponent has established the reporting mechanism of violations / deviations /non- compliances with respect to Environment. Regular management review meetings will be conducted at site level with all functional heads and chaired by Director & Executive Vice President. The minutes of meeting /decision will be presented to the Board by the Director & Executive Vice ES.14 KKB Envirocare Consultants Pvt. Ltd., Hyderabad
64 NATCO Pharma Ltd., Chemical Division Chennai-EIA report Executive Summary President. Industry has allocated of Rs. 65 lakhs as recurring cost for Environmental, Health and Safety Monitoring including green belt development. 8.1 Construction Phase The proposed expansion project envisages construction of production blocks, upgradation of ETP, setting up of machinery, storage facilities etc., are expected to last for about years. Environmental monitoring measures during construction stage are given below. Ambient air quality parameters viz., PM, CO, SO 2, and NOx will be monitored to ensure that ambient air quality standards would be met all the time. Basic amenities such as drinking water, sanitation & lighting will be provided to the construction workers. 8.2 Operation Phase Air emissions from process areas, Boiler, Incinerator, DG sets, Utilities, wastewater reuse, hazardous and non- hazardous waste generation are envisaged. The attributes which merit regular monitoring based on the environmental setting and nature of project activities are listed below: Source emissions and ambient air quality Groundwater levels and ground water quality in surrounding bore wells ETP effluent quality before and after treatment Hazardous and solid waste characterization (process hazardous waste, oily wastes, ETP sludge, used and waste oil) Soil quality Noise levels (Ambient, machinery noise levels, occupational exposures) Ecological preservation and afforestation. Health checkup (every year) will be made as per the guidelines prescribed by the statutory body 9.0 Project Benefits Expansion of APIs and its intermediates manufacturing facility not only increases the market availability of therapeutic drugs but also reduces the import burden on the country and also support the government by paying the taxes to the exchequer. In addition to this certain social contributions will help in economic growth of the area. Adequate additional plantation is proposed inside and outside the plant. The trees will maintain regional ecological balance and conform to soil and hydrological conditions. Indigenous species would be preferred. The management will continue to support the local administration and ES.15 KKB Envirocare Consultants Pvt. Ltd., Hyderabad
65 NATCO Pharma Ltd., Chemical Division Chennai-EIA report Executive Summary other form of assistance for the development of public amenities in this region. The social requirements will be identified such as drinking water requirement, promotions of educational institutions, vocational training, medical facilities, etc., to the villagers. The health programme outlines a routine monitoring of health and safety of the work force. Project will generate direct and indirect employment preferably from the nearby villages and unavailable technical persons from outside. Total Employment will be 350 persons as direct & 100 persons indirect after expansion. Industry proposes to allocate Rs.500 lakhs towards Enterprise Social Commitment. ES.16 KKB Envirocare Consultants Pvt. Ltd., Hyderabad
66 Chapter 1 Introduction
67 NATCO Pharma Ltd., Chemical Division-Chennai EIA Report Chapter 1: Introduction Chapter 1 Introduction 1.1 Preamble The Government of India plans to incentivise bulk drug (API) manufacturers, including both state-run and private companies, to encourage Make in India programme and reduce dependence on imports of active pharmaceutical ingredients (API), nearly 85 per cent of which come from China. Source: India in Business, Ministry of External Affairs, GoI, Investment and Technology Promotion Division. In order to meet this increased demand, M/s NATCO Pharma Limited, Chemical Division, (formerly NATCO Organics Limited) Chennai proposes to expand its Active Pharmaceutical Ingredients (APIs) & its intermediate manufacturing unit with R&D facility in the existing plant premises land area of Ha ( sq.m). The unit is located in Manali Industrial Area. The project site was reclassified from Primary Residential use zone to Special and Hazardous use zone by Chennai Metropolitan Development Authority (CMDA). A copy of Registrar of Companies in favor of NATCO Organics Limited dated is at Annexure-I. Industry was established in the year 2007 and obtained Environmental Clearance from MoEF in favor of M/s NATCO Organics Ltd., vide order F.No. J-11011/456/06/2006-IA-II (I) dated (Annexure-II). Obtained Consent to Establishment from Tamil Nadu Pollution Control Board (TNPCB) under the Water Act, vide consent order no & Proceedings No. TNPCB/T10/33317/TVLR/W/2007 dated and consent order No & Proceedings No. TNPCB/T10/33317/TVLR/A/ 2007 dated under Air Act in the name of NATCO Organics Ltd. (Annexure-III). First Consent for the operation of the plant and discharge of sewage & trade effluent was issued by TNPCB the under Water Act vide consent order no & Proceedings No. T10/TNPCB/F.33317/AMB/W/2010 dated and consent order No & Proceedings No. T10/TNPCB/F.33317/AMB/A/2010 dated under Air Act in the name of NATCO Organics Ltd. (Annexure-IV A). Obtained the Latest Consent to Operation of the plant and discharge of sewage & trade effluent under water act vide consent order no & Proceedings No. 1.1 KKB Envirocare Consultants Pvt. Ltd., Hyderabad
68 NATCO Pharma Ltd., Chemical Division-Chennai EIA Report Chapter 1: Introduction T2/TNPCB/F.0081AMB/RL/AMB/W/2016 dated , whereas consent orders No & Proceedings No. T2/TNPCB/F.0081AMB/RL/AMB/A/2016 dated under Air Act in the name of NATCO Organics Ltd. and is valid upto (Annexure- IV B). Application for consent for the operation of the plant and discharge of sewage & trade effluent under water act & Air act is submitted and is in process. Further, latest authorizations for operating facility for collection/reception/treatment/ storage/transport and disposal of Hazardous Waste is issued vide Authorization No.17HRC dated & proceedings no. T2/TNPCB/F.0846AMB/HWA/RL/AMB/2017 dated in the name of NATCO Pharma limited, Chemical Division, Chennai and valid upto (Annexure-V). The NATCO Organics Limited" has been amalgamated in to NATCO group of companies under the name and title of "NATCO Pharma Limited", Chemical Division- Chennai from onwards as per the Court Order (Annexure-VI). A copy of the Certificate of the Incorporation from Registrar of Companies is enclosed at Annexure-VII. A letter has been submitted to TNPCB on Name change on and TNPCB acknowledged on Application for Name change in EC was submitted to MoEF&CC on Submitted an online application for expansion to MoEF&CC for ToR and obtained ToR from MoEF&CC vide F.No. J-11011/119/2017-IA.II (I) dated in the name of M/s. NATCO Pharma Ltd., Chemical Division-Chennai. 1.2 Project Proponent NATCO Pharma Limited (Public Limited Company) is one of the leading Pharmaceutical companies in India, engaged in the development, manufacturing and distribution of Active Pharmaceutical Ingredients (APIs), API Intermediates and Pharmaceutical Formulations. NATCO Pharma Limited was incorporated in Hyderabad in the year 1981 with an initial investment of INR.3.3 million, with a modest beginning of operation as a single unit with 20 employees, NATCO today has five manufacturing facilities spread across India which dedicated modern research laboratories, capabilities in New Drug Development, etc. NATCO currently consist of more than 3500 employees, consistently ranked among fastest growing pharmaceutical companies in India. NATCO is utilizing its collective professional experience to kick its transformation in to a major player in the global pharmaceutical industry. Shri V.C. Nannapaneni, Chairman & Managing Director, has over 42 years of experience in the Pharmaceutical Industry. He has worked in the USA for more than a decade in various Pharmaceutical companies. He holds Bachelors and Master s Degree in Pharmacy from Andhra University, Visakhapatnam (A.P), in addition to this he also holds a Master s degree in Pharmaceutical Administration from the 1.2 KKB Envirocare Consultants Pvt. Ltd., Hyderabad
69 NATCO Pharma Ltd., Chemical Division-Chennai EIA Report Chapter 1: Introduction Brooklyn College of Pharmacy, USA. Currently, along with general management he also oversees the New Drug Discovery programme of the company. Mr. P.S.R.K Prasad, Director and Executive Vice President - Corporate Engineering Services, presently are looking after the General Administration, Engineering, regulatory, training, environmental matters, safety, health, production and maintenance activities of the Company. He has done BE Mechanical Engineering from Andhra University. Previously he was associated with Ahmedabad Textile Industries Research Association, Coromandel Fertilizers Ltd., Stiles India Ltd., Tirupati, Saudi Ceramic Co., Riyadh, K.S.A. Mr. Prasad has got vast and good knowledge in procuring right equipment(s) and machinery for production processes and to provide all utility services and to utilize the resources like manpower, material in an optimum way and to ensure safety of life and property. Mr. G. Vasan, General Manager Operations of NATCO Pharma Limited, Chemical Division Chennai and he is also the Authorised Signatory of proposed project in the site, his experience is more than 29 years in Pharma Industries and Speciality Chemical Industries. He has done Master Degree in Science and Mr. Vasan has a hands on-experience in production of bulk drugs and scale up activities by complying with all EHS/GMP standards. Our commitment lies in providing the required quality API's and Intermediates to our existing customers to our Country on prime and also to the other countries. We cater to a cross section of clients in Asia, Canada, Brazil, Australia and USA. Our Company s strength in research and people has been the cornerstone of its success, sustaining large investments in research initiatives of Rs.172 crores during the five years leading to Our Company is integrated across the value chain APIs to formulations - in the manufacture of select products leading to corresponding advantages in terms of cost, quality and logistics. Our Company addresses opportunities across the oncology, CNS, gastrointestinal, migraine and anti-depressant segments, each of which is growing in size and scope. Our company established its brand as a strong global oncology player, respected for its ability to develop world class generic products at one of the lowest costs. Our company has selected to grow its presence in value added niches where it addresses the needs of specialists with a corresponding throughout per medical representative that is considerably higher than the Indian pharmaceutical industry average. Our company is one of few in India to manufacture cytotoxic drugs across two plants, an index of its commitment to invest in infrastructure and process sophistication in size and scope. 1.3 KKB Envirocare Consultants Pvt. Ltd., Hyderabad
70 NATCO Pharma Ltd., Chemical Division-Chennai EIA Report Chapter 1: Introduction NATCO Pharma Limited, Chemical Division-Chennai is a manufacturer of API (Active Pharmaceutical Ingredients)/ bulk drug, located in Chennai. It is ensured that the environmental discharges are well within the limits stipulated by the Ministry of Environment, Forests and Climate Change (MoEF&CC) / Tamil Nadu Pollution Control Board (TNPCB). There are no court cases or litigations against the Proponent. The project location has certified by USFDA (Annexure-VIII). 1.3 Regulatory Framework A policy framework has been developed to complement the legislative provisions. The Policy Statement for Abatement of Pollution, National Conservation Strategy and Policy Statement on / Environment & Development were brought out by the MoEF in 1992, to develop and promote initiatives for the protection and improvement of the environment. The EAP (Environmental Legal and regulatory framework Action Programme) was formulated in 1993 with the objective of improving environmental services and integrating environmental considerations into development programmes. The major following acts and rules have been promulgated by the government from time to time for protection and preservation of environment, which the industry proposes to follow and comply with. There are many Acts / Rules / Notifications issued by different regulatory authorities of which, few are mentioned below The Environment (Protection) Act (EPA), 1986 as amended in 1991 and the rules thereunder The Water Act,1974 and the rules thereunder The Air Act,1981 and the rules thereunder The Factories Act 1948 and the rules thereunder The Public Liability Insurance Act, 1991 as amended 1992 and the rules thereunder Environmental Impact Assessment Notification dated 14 th September 2006 and its amendments along with the rules thereunder Hazardous & other wastes (Management & Trans boundary Movement) Rules, Solid Waste Management Rules, 2016 Construction and Demolition Waste Management Rules, Chemical Accident (Emergency Planning, Preparedness and Response) Rules, 1996 The Manufacture, Storage and import of Hazardous chemicals (Amendment) Rules 2000 Noise Pollution (Regulation and Control) Rules, 2000 and its amendments The Batteries (Management and Handling) Rules KKB Envirocare Consultants Pvt. Ltd., Hyderabad
71 NATCO Pharma Ltd., Chemical Division-Chennai EIA Report Chapter 1: Introduction Ozone Depleting Substances (Regulation and Control) Rules Plastic Waste Management Rules, 2016 E-waste (Management) Rules, 2016 Biomedical Waste Management Rules, 2016 The Petroleum Act 1934 and its amendments The Petroleum Rules 2002 and its amendments Gas Cylinder Rules 2016 and its amendments The Explosive Act 1884 and its amendments The Explosive Rule 1983 and its amendments India Boiler Act 1923 and its amendments The Indian Boiler Regulations 1948/1952 and its amendments The Indian Electricity Rules 1956 and its amendments The Standards of Weights & Measures Act 1976 and its amendments The Standards of Weights & Measures (Packaged Commodities) Rules 1977 and its amendments The Static & Mobile Pressure vessels (unfired) rules 1981 and its amendments The Motor Vehicle Act 1988 and its amendments The Central Motor Vehicle Rules 1989 and its amendments Building and other construction Act and its amendments Indian Electricity Act 1910 / 2003 and its amendments The Chemical Weapons Conservation Act 2000 and its amendments Energy Conservation Act 2001 and its amendments The current EIA study has been conducted to fulfill the requirement of the regulatory provisions as enacted in EPA, 1986 (as amended thereon). As per the EIA notification-2006, the company needs to get the Environmental Clearance prior to installation & commissioning of the above proposed expansion project. All Synthetic Organic Chemicals Industry located in a notified Industrial Area/estate are listed at S. No. 5(f) of Schedule of EIA notification 2006 and its amendments under Category-B but due to the applicability of general condition (located in critically polluted area), it is considered under Category-A and is apprised at Central level by Expert Appraisal Committee(EAC). There is no interlink and interdependent project for this Expansion project CPCB CEPI index to Manali Industrial Area The Ministry of Environment & Forest (MoE&F) vide Office Memorandum of even no. dated had imposed a moratorium up to on consideration of projects for Environmental Clearance to be located in 43 critically polluted areas / industrial clusters identified by Central Pollution Control Board (CPCB). Manali Industrial area (sl.no. 20) has a CEPI index of KKB Envirocare Consultants Pvt. Ltd., Hyderabad
72 NATCO Pharma Ltd., Chemical Division-Chennai EIA Report Chapter 1: Introduction The TNPCB prepared action plan to Manali industrial area in August 2010 to improve the environmental quality of this area from 17 Ultra Red category of industries located in Manali Industrial area. Source: The CPCB conducted monitoring in the Critically Polluted Areas (CPAs) in 2013 and reassessed the CEPI score and taking into consideration that action plans for improving the environment quality take time to yield results. The MoEF has lifted the moratorium on consideration of projects for environmental clearances in respect of projects to be located in the Manali along with other industrial clusters vide OM No. J-11013/5/2010-IA.II(I) dated (Annexure-IX). 1.4 Proposed Project The project proponent proposed to expand its existing Active Pharmaceutical Ingredients (APIs) & its intermediate manufacturing and R&D facility in the existing plant premises of Ha ( sq.m) located in R.S.Nos. 73/1A, 73/2, 74/7B, 78/1B, 79/1, 79/2B, 79/3, 79/4B, 79/5, 79/6A, 79/6B, 79/7, 80/1, 80/2, 80/3, 80/4, 84/1, 84/2, 84/3A, 84/5A, 84/6, 84/7A, 85/1, 85/2B, 86/2B, 86/2C, 86/2D2, 86/3B, 86/4, 86/5, 86/6, 86/7, 86/8, 86/9 of Manali Industrial Area, Thiruvottiyur Taluk (formerly Vaikkadu (V), Ambattur (Tq.)), Thiruvallur District, Tamil Nadu. Under Jurisdiction of Thiruvallur District, Ambattur Taluk was divided into two taluks namely Ambattur Taluk and a new Madhavaram Taluk vide Govt. Order (Standing) No. 485 dated and again Madhavaram was divided into two taluks namely Madahvaram and New Thiruvottiyur in The Manali is shifted to Thiruvottiyur taluk, Thiruvallur District (Annexure-X). Since then Revenue village Manali falls under Thiruvottiyur Taluk. The existing investment of Rs Crores with additional investment of Rs.100 Crores is being invested totaling Rs crores (Annexure-XI). The expansion proposal is to obtain Environmental Clearance (EC) from the Ministry of Environment, Forests and Climate Change (MoEF&CC) to manufacture 16 campaign products at a time out of 42 APIs proposed products and R&D activity with a production capacity of TPA (Additional TPA, Existing production capacity of TPA; Total production TPA). The products manufactured are used in Pharmaceutical formulation industry and the therapeutic category of the products is Anti-neoplastic agent, Immuno suppressive agent, Anti-coagulant, Chelating agent, Proton Pump inhibitors, Renal and genitourinary agent, Antiviral, Antimetic, Anti-Inflammatory, Anti-migraine, Cardiovascular agent, selective serotonin reuptake inhibitors, Platelet Aggregation inhibitor etc., which are applicable for human consumption around the world after formulation activity. 1.6 KKB Envirocare Consultants Pvt. Ltd., Hyderabad
73 NATCO Pharma Ltd., Chemical Division-Chennai EIA Report Chapter 1: Introduction Proposed products will be manufactured on the basis of proven technologies from in-house R&D and private consultants for the cost effective and environment friendly practices. The manufacturing process of APIs & its Intermediate consists of chemical synthesis extending to a maximum of 18 stages and minimum of 1 stage of processing involving various chemical reactions. These APIs are mainly used for human medication after formulation activity for various diseases. 1.5 Project Site The proposed expansion will be at the existing plant premises located in Manali Industrial Area, Thiruvottiyur Taluk (formerly Vaikkadu (V), Ambattur (Tq.)), Thiruvallur district, Tamil Nadu (Fig.1.1). The project site lies between 13 11'20.40" North latitude and " East longitude. The project site is well connected by the National and State High Ways. Project site co-ordinates of all corners are presented below. Sl. Sl. Latitude Longitude No. No. Latitude Longitude '33"N 80 15'56"E '13"N 80 16'10"E '32"N 80 15'58"E '11"N 80 16'10"E '28"N 80 15'57"E '11"N 80 16'9"E '26"N 80 16'3"E '11"N 80 16'9"E '19"N 80 16'1"E '11"N 80 16'8"E '19"N 80 16'2"E '12"N 80 16'7"E '15"N 80 16'1"E '13"N 80 16'1"E '14"N 80 16'7"E '11"N 80 16'1"E '13"N 80 16'7"E '12"N 80 15'54"E '13"N 80 16'8"E '24"N 80 15'55"E The proposed site covers an area of about Ha of existing land (No additional land acquired for expansion) and is located in Manali Industrial Area. This industrial area is Special and Hazardous Use Zone as per Chennai Metropolitan Development Authority (CMDA). Total Greenbelt area is 3.51 Ha (33.2% of Ha). In addition industry has given 1.05 Ha (10%) for Open Space Reservation (OSR) land for Greenbelt. Industry also developed the lawn in an area of 0.39 Ha (3.7% of Ha). The total land is in possession of project proponent. This proposed expansion project site is located at a distance (aerial) of 8 km (W) from National Highway No.16 (Chennai- Kolkata); about 0.25 km (W) from Andarkuppam village; about 0.9 km from Kanniyammanpettai village (W); Manali Town at 1.6 km (S); Tiruvottiyur railway station at 4.4 km in SE direction; Chennai International Airport at 23 km in SSW direction; Harbour (Chennai Port) at 7 km (SSE); Ennore Port at 11 km (NNE); and Bay of Bengal at 5.5 km (E). The manufacturing facility is well connected to Chennai by Road i.e., National Highway No.16, rail and airways. The transportation of raw material and finished products can be arranged by road, rail and air to the domestic and international destinations. 1.7 KKB Envirocare Consultants Pvt. Ltd., Hyderabad


74 NATCO Pharma Ltd., Chemical Division-Chennai EIA Report Chapter 1: Introduction Fig. 1.1: Project Site Location Map 1.8 KKB Envirocare Consultants Pvt. Ltd., Hyderabad
75 NATCO Pharma Ltd., Chemical Division-Chennai EIA Report Chapter 1: Introduction There are no National Park or Wild life Sanctuary / Eco sensitive areas within 10 km radius of study area. There is no Reserved Forest in study area.the proposed expansion project site boundaries with latitude and longitude in google image is shown in Fig.1.2 and the Topographical map in 10 km radius study Area is shown in Fig The study area map locating the project site and nearby industries are shown in Fig.1.4. List of the industries existing within the study area are as under: Toshiba JSW Power System Pvt. Ltd., Manali Industrial Area. Raj Petro specialties Pvt. Ltd., Manali Industrial Area. Madras Fertilizers Ltd., Manali Industrial Area. Tamil Nadu Petro products Limited (TPL), Manali Industrial Area. Chennai Petroleum Corporation Ltd., Manali Industrial Area. Cetex Petrochemical Ltd., Manali Industrial Area. Supreme Petrochemical Ltd., Manali Industrial Area Balmer Lawrie & Co. Ltd., Manali Industrial Area Coromandal International Ltd., Ennore, Chennai Indian Additives Ltd., Manali Industrial Area Manali Petro Chemicals Ltd., Manali Industrial Area Kothari Petro Chemicals Ltd., Manali Industrial Area Ennore Thermal Power Station, Ennore, Chennai Piramal Health Care Ltd., Ennore, Chennai SRF Ltd., Manali Industrial Area. IOT Infrastructure & Energy Services Ltd., Manali Industrial Area. The salient features of environmental setting are presented in Table 1.1. The proposed expansion is within the existing site located in Notified Industrial area i.e., Manali Industrial area and is plain land. Keeping in view of proposed expansion of APIs and its intermediate, M/s NATCO Pharma limited desired to carry out the environmental impact assessment (EIA) due to proposed expansion of APIs and its intermediate production to TPA from existing production capacity of TPA and appointed M/s KKB Envirocare Consultants Pvt. Ltd., (NABET accredited environmental consultant) Hyderabad for required study in accordance with the EIA Notification of 14 th September 2006 and its subsequent amendments / notifications of the MoEF&CC, New Delhi. The EIA study comprises establishment of baseline environmental quality data for one season with respect to major environmental components, viz. air, water, noise, land, biological and socio-economics, identification and prediction of significant environmental impacts due to proposed expansion of APIs & its Intermediates manufacture followed by delineation of appropriate Environmental Management Plan and also Hazardous & Risk assessment analysis and delineation of approach to disaster management plan. 1.9 KKB Envirocare Consultants Pvt. Ltd., Hyderabad


76 NATCO Pharma Ltd., Chemical Division-Chennai EIA Report Chapter 1: Introduction Fig. 1.2: Google map showing Project Boundaries of proposed project 1.10 KKB Envirocare Consultants Pvt. Ltd., Hyderabad

77 NATCO Pharma Ltd., Chemical Division-Chennai EIA Report Chapter 1: Introduction Fig. 1.3: Topographical map of 10 km Study Area 1.11 KKB Envirocare Consultants Pvt. Ltd., Hyderabad

78 NATCO Pharma Ltd., Chemical Division-Chennai EIA Report Chapter 1: Introduction Fig. 1.4: Topographical map (study area) with location of industries 1. Natco Pharma Limited 2. Toshiba JSW Power System Pvt. Ltd. 3. Raj Petro specialties Pvt. Ltd. 4. Madras Fertilizers Ltd. 5. Tamil Nadu Petro products 6. Chennai Petroleum Limited (TPL) Corporation Ltd. 7. Cetex Petrochemical Ltd. 8. Supreme Petrochemical Ltd. 9. Balmer Lawrie & Co. Ltd. 10. Coromandal International 11. Indian Additives Ltd. 12. Manali Petro Chemicals Ltd. Ltd., Ennore 13. Kothari Petrochemicals 14. Ennore Thermal Power 15. Piramal Health Care Ltd., Ltd. Station, Ennore Ennore 16. SRF Ltd. 17. IOT Infrastructure & Energy Services Ltd KKB Envirocare Consultants Pvt. Ltd., Hyderabad
79 NATCO Pharma Ltd., Chemical Division-Chennai EIA Report Chapter 1: Introduction Table 1.1: Salient Features of the Proposed Expansion Project Sl. No. Item Details Geographical Co-ordinates Centre of the site 1. Latitude Latitude: "N Longitude Longitude: "E 2. Plant Site Elevation 4 m msl 3. Topo Sheet Nos New: D4408, D4407, D4404 and D Land use at the proposed project site Special and Hazardous Use Zone as per Chennai Metropolitan Development Authority (CMDA). 5. Nearest Highway NH-16 (previously NH-5) (Chennai- Kolkata) is 8 km in W direction 6. Nearest Railway Station Tiruvottiyur at 4.4 km in SE direction. 7. Nearest Airport Chennai International Airport at 23 km in SSW direction. 8. Nearest village Anadarkuppam at 0.25 km (W) Kanniyammanpettai village at 0.9 km (W) Manali Town at 1.6 km (S) 9. Harbour Harbour (Chennai Port) at 7 km (SSE) Ennore Port at 11 km (NNE) 10. Interstate boundary 26.8 km (N) to interstate boundary (Andhra Pradesh) 11. Nearest river Kosasthalaiyar River at 1.8 km (NE) 12. Bay of Bengal 5.5 km (E) 13. Nearest Water Bodies Kadapakkam Panchayat Lake 1.5 km (NW) Retteri Lake at 6.3 km (SW) Puzhal Lake at 8 km (WSW) Rare or endangered or endemic or Nil within 10 km radius 14. threatened (REET) species of animals or birds. Ecologically sensitive zones or Protected areas as per Wildlife Protection Act, Reserved Forests (RF) Nil 16. Critically polluted areas as per Manali Industrial Area MoEF&CC Notification 17. Seismic zone Zone III (Moderate) 18. Defence installations Nil 1.6 Prior Environmental Clearance Process The environmental protection is an important and essential requirement in the developmental process. It will be duly integrated at every stage in industrial and economic developments to make them sustainable over long term. In this direction, the MoEF&CC, Government of India formulated policies, enacted Environment (protection) Act in 1986 and stipulated regulatory procedures governing industrial and other major developments in the country to prevent and mitigate the potential environmental & ecological hazards due to indiscriminate exploitation of natural resources. The MoEF&CC made prior Environmental Clearance (EC) mandatory for certain developmental projects through its notification dated 1.13 KKB Envirocare Consultants Pvt. Ltd., Hyderabad
80 NATCO Pharma Ltd., Chemical Division-Chennai EIA Report Chapter 1: Introduction , which includes scoping of environmental impact assessment study through Terms of Reference (ToR) approval, in the process of prior environmental clearance for scheduled development projects Approved Terms of Reference (ToR) for EIA Study The procedure applicable for category A project has been followed during filling up of Form-1 covering the brief description about proposed expansion project, pre-feasibility report (PFR), and draft ToR for EIA studies and submitted to EAC for approval of ToR. In the first stage, scoping, the application with Form-1, Pre-feasibility report (PFR) and draft ToR was duly scrutinized on April, 18, 2017 by the EAC (Industry-2) constituted by MoEF&CC. The committee has exempted the public hearing under para 7(ii) of EIA notification. The committee prescribed the Additional ToR along with Standard ToR as available in MoEF&CC website for preparation of EIA-EMP report for production capacity of TPA (F.No. J-11011/119/2017-IA. II(I) dated (Annexure-XII) and are followed for undertaking detailed EIA study and preparation of EIA-EMP for proposed expansion project to obtain prior environmental clearance. 1.7 Environmental Impact Assessment The EIA is an anticipatory tool with the objective of environmental protection and to facilitate the decision-making process by clearly evaluating the environmental consequences of the proposed expansion activity before the implementation of the project. Early identification and characterization of critical environmental impacts allows the public and the government to form a view about the environmental acceptability of a proposed developmental / expansion project and what conditions should be imposed to prevent or mitigate risks and adverse impacts associated with the project implementation. The EIA study for the proposed project is carried out based on summer season baseline environmental quality data and prediction of impacts from proposed expansion project on all components of environment. Keeping in view of the approved ToR, the EIA report is prepared and is submitted to the MoEF&CC for its appraisal.the structure of EIA report is mostly as per the generic structure given in Appendix-III of EIA notification The report contains the following Chapters. Chapter 1 - Introduction gives brief outline of the proposed expansion project and project proponent, description of the nature, size and location of the project and its justification. It also outlines the statutory requirement of obtaining prior Environmental Clearance. It also includes the scope of the study as per the approved Terms of Reference KKB Envirocare Consultants Pvt. Ltd., Hyderabad
81 NATCO Pharma Ltd., Chemical Division-Chennai EIA Report Chapter 1: Introduction Chapter 2 - Project Description, plant layout and infrastructure facilities incorporating all industrial and environmental activities of the project for setting up of the proposed expansion project for manufacture of various types of APIs & its Intermediates. It also gives information about manufacturing process, raw materials requirement, utilities, product wise pollution loads and existing plant environmental scenario etc. Chapter 3 - Baseline environmental study giving details about status of meteorology, air quality, water, noise, land, ecology and socio-economic environment of the study area based on information collected through field study or from secondary sources. Chapter 4 - deals with the anticipated environmental impacts and impacts mitigation measures. This has been developed based on the Chapter 2 and Chapter 3, by correlating the activities under the proposed expansion project and their impacts on the receiving environmental attributes. Chapter 5 - delineates the Environmental management plan (EMP) including greenbelt development and post-project environmental monitoring plan as well as frequency of monitoring and the budgetary provisions for pollution control measures. Chapter 6 - describes analysis of alternate site. Chapter 7 - discusses the additional studies viz. Risk assessment study and public consultation required for the project. Chapter 8 - highlights the project benefits. Chapter 9 - attempts to summarize the entire report and conclude the outcome of the study. Chapter 10 - provides the brief profile of consultant organization and the NABET Accreditation including declaration by experts Objective The objective of the study is to prepare EIA report based on the following guidelines provided by MoEF&CC: Present status of air, water, land, socio-economic and biological components of the environment including noise and other parameters of human interest for one season (summer) within the study area covering 10 km radial distance around the project site for conventional chemical pollutants. Identification of forest land, agricultural land, waste land, water bodies etc. in the area of interest. Identification, quantification, prediction and evaluation of significant impacts from the proposed project during construction and operation phases KKB Envirocare Consultants Pvt. Ltd., Hyderabad
82 NATCO Pharma Ltd., Chemical Division-Chennai EIA Report Chapter 1: Introduction Preparation of an Environmental Management Plan (EMP) including post-project environmental monitoring plan to be adopted for mitigation of anticipated adverse impacts, if any Methodology The various steps involved in Environmental Impact Assessment study of the proposed production enhancement plant are divided into the following phases: Identification of significant environmental parameters and to study the existing status within the impact zone with respect to air, water, noise, soil, biological and socioeconomic components of the environment. Study of various activities of the proposed project and to identify the area s leading to impact/change in environmental quality. Identification/Prediction of impacts for the identified activities and to study levels of impact on various environmental components. Evaluation of impacts after superimposing the predicted impacts over the baseline quality. Formulation of Environmental Management Plan including post-project monitoring plan for implementation in the proposed project. The scope of study include a detailed characterization of baseline environment in an area of 10 km radius with the plant site as the center for various Environmental components viz., Air, Noise, Water, Land, Biological and Socio-Economic Environment. For the present study the plant site is considered as core zone and the area lying within 10 km radius from the plant site is considered as buffer zone. The baseline data collected during summer season from March-May The details of methodology work plan in the 10 km study area under individual components of environment are as follows: Air Environment - Assessment of prevailing ambient air quality status within 10 km radial distance project around the site with respect to primary air pollutants, viz. NAAQS parameters, VOC & HC. The air quality sampling locations will be selected keeping in view the predominant downwind direction, at likely maximum GLC from proposed project, residential areas, and sensitive receptors. - Collection of site specific micro-meteorological data, viz. wind speed, rainfall, hourly wind direction, relative humidity and temperature during ambient air quality survey period. - Prediction / delineation of Impact from proposed project on surrounding impact zone (10 km radial distance) 1.16 KKB Envirocare Consultants Pvt. Ltd., Hyderabad
83 NATCO Pharma Ltd., Chemical Division-Chennai EIA Report Chapter 1: Introduction - Evaluation of adequacy of the proposed air pollution control measures - Delineation of air environment management plan for construction and operation phases - Designing greenbelt and identification of suitable local plant species in the greenbelt considering of air pollutants and local biodiversity Noise Environment - Measurement of existing noise levels in the study area - Identification of high level noise zones/vibrations, if any, requiring mitigation measures - Prediction and evaluation of impacts due to increase in noise generation sources at proposed units on the surrounding environment - Recommendations on mitigation measures for noise pollution and to control noise impacts Water Environment - Assessment of existing status of water quality with respect to physico-chemical characteristics of surface and in the groundwater resources within the study area through field studies - Estimation of water requirement, water balance, generation, re-utilization for the treated effluent in utilities - Assessment of the nature of effluents likely to be generated and predicting impacts - Assessment of treated wastewater to reuse Land Environment - Study the land for proposed project activities and land use breakup - Geology features, geo hydrological status, soil characteristics, topography, land use, vegetation in the study area - Evaluation of solid/hazardous wastes likely to be generated and to suggest management options for environmentally compatible disposal / management Biological Environment - Inventory of flora and fauna in the study region - Assessment of terrestrial, aquatic ecology status in study area including reserved forests and wild life sanctuary - Identification of rare and endangered species, if any in the study area - Delineation of measures for abatement / reduction of biological stress and regional management plan for Biological environment 1.17 KKB Envirocare Consultants Pvt. Ltd., Hyderabad
84 NATCO Pharma Ltd., Chemical Division-Chennai EIA Report Chapter 1: Introduction - Delineation of greenbelt development plan keeping in view the selected plant species and attenuation factors for noise and air pollutants Socio-economic Environment - Socio-economic survey through questionnaire to assess the awareness and their perception about the proposed project - Compilation of baseline status of the socio-economic profile in the study area with reference to: Demographic structure, viz. total population and population density, sex ratio, schedule caste and schedule tribe, literacy and employment Telecommunications, archaeological sites. Cultural and Aesthetic attributes in the study area including places of historical/archaeological importance - Delineation of social welfare measures for implementation depending on local requirements Occupational Health - Number of workers to be employed - List of hazardous operations/activities - The procedure to be adopted for assessment of occupational health including the details of medical examination and the facilities Environmental Management Plan and Post-Project Environmental Monitoring Program - Delineation of EMP for air, water, noise, land, biological and socio-economic environments based on anticipated environmental impacts and mitigation measures - Delineation of post-project environment quality monitoring programme to be pursued by the project proponent. - Recommendations on detailed environmental monitoring programme and methodologies to be pursued by the project proponent Hazard & Risk Assessment Hazard identification and Risk assessment based on maximum credible accident analysis, consequence analysis to indicate damage distances in the worst possible accident scenario and delineation of risk mitigation measures and approach to disaster management plan KKB Envirocare Consultants Pvt. Ltd., Hyderabad
85 Chapter 2 Project Description
86 NATCO Pharma Ltd., Chemical Division-Chennai-EIA Report Chapter 2: Project Description Chapter 2 Project Description 2.1 Type of Project Over the years, the production of Active Pharmaceutical Ingredients (APIs) has made significant progress. The drug and pharmaceutical industry in India meets around 70% of the country s demand for APIs & its intermediates, pharmaceutical formulation, chemicals, tablets, capsules. The Indian pharmaceutical industry is well set for rapid expansion. As a result of the expansion, the Indian pharmaceutical and healthcare market is undergoing a spurt of growth in its coverage, services, and spending in the public and private sectors. M/s NATCO Pharma Ltd., Chemical Division, Chennai, Tamil Nadu proposed to expand its APIs & its Intermediates manufacturing facility of TPA from i.e., Total TPA in existing plant premises (10.57Ha) on 16 campaign products and R&D activity at a time out of 42 products. As per the prevailing environmental regulatory framework, the proposed development requires prior environmental clearance (EC) from MoEF&CC and CTE from the Tamil Nadu Pollution Control Board (TNPCB) to manufacture 16 products out of 42 APIs & its Intermediates along with R&D with a total production of TPA. The existing investment of Rs Crores with additional investment of Rs.100 Crores is being invested totaling Rs crores 2.2 Project Justification Need of Project The Indian pharmaceutical industry valued at $16 billion has portrayed tremendous progress with reference to infrastructure development, technology base creation and a wide range of production. The pharmaceutical industry produces APIs belonging to major therapy groups. India ranks 4 th worldwide accounting for 8 per cent of the world's production (in terms of volume) and 13th in terms of value. It is estimated that by the year 2015, the Indian pharmaceutical industry has the potential to achieve over Rs.2,00,000 Crore in formulations and bulk drug production. The industry now produces bulk drugs belonging to all major 2.1 KKB Envirocare Consultants Pvt. Ltd., Hyderbad
87 NATCO Pharma Ltd., Chemical Division-Chennai-EIA Report Chapter 2: Project Description therapeutic groups requiring complicated manufacturing process and has also developed Good Manufacturing Practices (GMPs) facilities for the production of different dosage forms. The Pharma industry exports APIs and pharmaceuticals worth over $ 14.9 billion in It ranks 17 th in terms of export value of bulk activities and dosage. Indian exports cover more than 200 countries including the highly regulated markets of USA, Europe, Japan and Australia. At a growth rate of 12 per cent per year, the pharmaceutical industry in India is well set for rapid expansion. As a result of the expansion, the Indian pharmaceutical and healthcare market is undergoing a spurt of growth in its coverage, services, and spending in the public and private sectors. In the increased threat of the Human life in our country with the suffering of Cancer and the affordability of the medicine cost and the easily availability of the medicine, it is planned to increase the product portfolio. In order to satisfy this need, variety of Products is the need of our country. The expansion of the industry will be beneficial to the region. The company will bring new job opportunities for the local people. They will, therefore, become economically stronger. In order to meet the market demand, M/s NATCO Pharma limited, Chemical Division, Chennai proposed to expand its production facility by increasing existing APIs production and adding new APIs manufacturing and R&D facility to TPA. 2.3 Existing Plant Scenario Industry obtained Environmental Clearance (EC) for the existing operations in June 2007 and its certified EC compliance report from MoEF&CC, regional office, Chennai is presented as separate chapter at the beginning of the report. Project located in an area of Ha. Consent to Establishment (CTE) obtained in August The latest Consent to Operation (CTO) is issued by TNPCB in June A renewal application for CTO of the plant and discharge of sewage & trade effluent under water act & Air act is submitted to TNPCB and is in process. The compliance status report of Consent to Operation is submitted to TNPCB and acknowledgement copy is at Annexure-XIII. The industry is permitted 18 products as per EC and permitted 16 products as per CTO 2016 ( TPA) manufactured so that the total production capacity at any point of time will not exceed TPA (Table 2.1 (a) & (b)). The permitted water requirement and wastewater generation and its treatment as per EC are presented in Table 2.2(a) and wastewater generation and its treatment as per CTO 2016 are presented in Table 2.2(b). The existing plant photographs along with greenbelt and proposed land for expansion are presented in Plates 2.1, 2.2 and 2.3 respectively. 2.2 KKB Envirocare Consultants Pvt. Ltd., Hyderbad
88 NATCO Pharma Ltd., Chemical Division-Chennai-EIA Report Chapter 2: Project Description Table 2.1 (a): Permitted (Existing) Products and their Capacities as per EC S. Quantity Quantity Name of the product No. (Kgs/Annum) (TPA) 1 Allylestrenol Drospirenone Daunomycin Hydrochloride Altretamine Epirubicin Hydrochloride Idarubicin Hydrochloride Nandrolone Decanoate Chlorambucil Doxorubicin Hydrochloride Fulvestrant Testosterone Decanoate Geftinib Imatinib Methane Sulfonate GB-5 intermediate Temozolomide Sumatriptan Setraline Hydrochloride Melphalan Total Production Quantity ( TPA) Table 2.1 (b): Permitted (Existing) Products and their Capacities as per CTO 2016 S. Quantity Quantity Name of the product No. (Kgs/Annum) (TPA) 1 Allylestrenol Drospirenone Daunomycin Hydrochloride Altretamine Epirubicin Hydrochloride Idarubicin Hydrochloride Nandrolone Decanoate Chlorambucil Doxorubicin Hydrochloride Fulvestrant Testosterone Deconoate Geftinib Imatinib Methane Sulfonate GB-5 intermediate Temozolomide Melphalan Total Production Quantity Source: NATCO Pharma Limited- Chemical Division, Chennai 2.3 KKB Envirocare Consultants Pvt. Ltd., Hyderbad
89 NATCO Pharma Ltd., Chemical Division-Chennai-EIA Report Chapter 2: Project Description Table 2.2 (a): Existing Water Requirement, Wastewater Generation and its Treatment (as per EC) Description Water Requirement (KLD) Wastewater Generation in KLD Treatment Process Utilities & Kettle 30 washings 30 Boiler Feed 70 6 Cooling Tower (make up) 25 3 Wet Scrubber make up Domestic Gardening 25 - Total The effluent generated from the plant is KLD which is treated in the ETP installed in the site. The Zero Liquid Discharge (ZLD) is achieved through the Multi Effect Evaporator (MEE) system followed by Advanced Thin Film Drier (ATFD). The treated water is recycled in the cooling tower makeup. Table 2.2 (b): Existing Wastewater Generation and its Treatment (as per CTO) Sl. Maximum daily Description of Outlet Point of disposal No. discharge in KLD Effluent Type: Sewage 1. Sewage 20 Reused Effluent Type: Trade Effluent 1. Trade Effluent Reused (Low TDS) 2. Trade Effluent-2 (High TDS) Treated in MEE followed by ATFD 2.4 KKB Envirocare Consultants Pvt. Ltd., Hyderbad


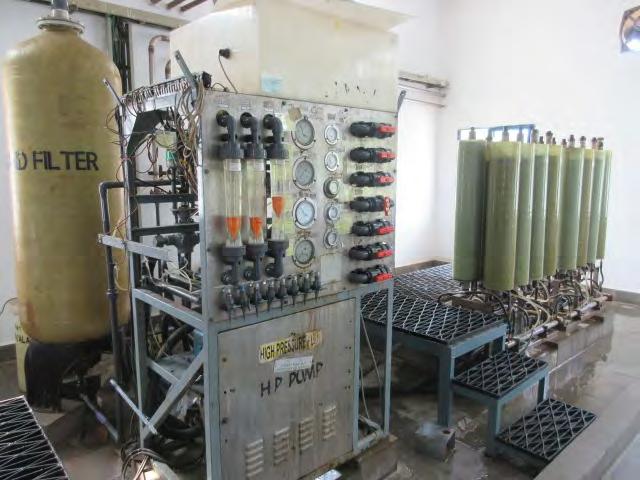
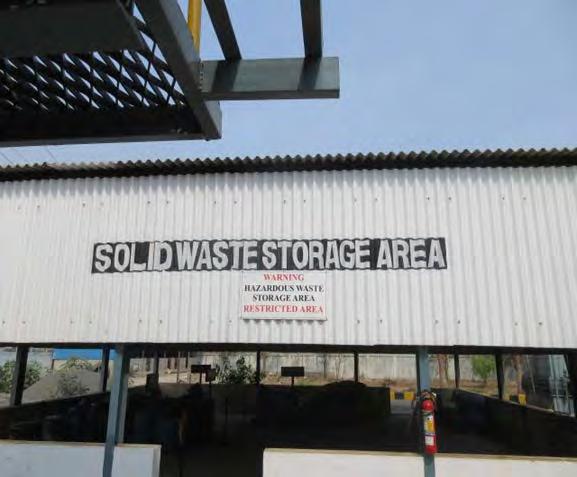

90 NATCO Pharma Ltd., Chemical Division-Chennai-EIA Report Chapter 2: Project Description Solid/ Hazardous waste Storage Area Plate 2.1: Existing units in plant premises 2.5 KKB Envirocare Consultants Pvt. Ltd., Hyderbad

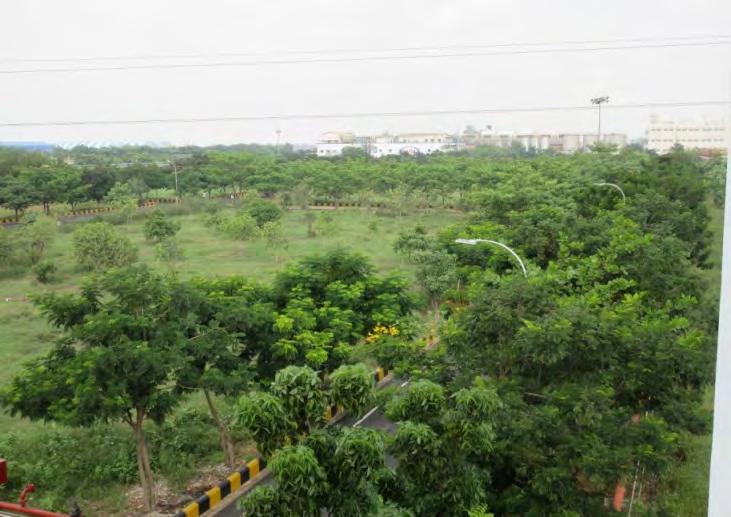


91 NATCO Pharma Ltd., Chemical Division-Chennai-EIA Report Chapter 2: Project Description Plate 2.2: Greenbelt in plant premises & site visit photos 2.6 KKB Envirocare Consultants Pvt. Ltd., Hyderbad

 concepts.")
 is reused and High TDS (1.305) is treated in MEE followed by ATFD.")
; Low TDS (having TDS < 25,000 mg/l) along with domestic sewage and utilities")
92 NATCO Pharma Ltd., Chemical Division-Chennai-EIA Report Chapter 2: Project Description Plate 2.3: Proposed Existing Vacant Land for Expansion Effluent Treatment System As per the EC, the water consumption is KLD excluding the recycled treated water. Wastewater generation is KLD including domestic wastewater of 20 KLD. As per CTO, the existing water consumption is KLD excluding the recycled treated water. Wastewater generation is 57 KLD including domestic wastewater of 20 KLD. The effluent management system is practiced as Zero Liquid Discharge"(ZLD) concepts.the Zero Liquid Discharge (ZLD) is achieved through the Multi Effect Evaporator (MEE) system followed by Advanced Thin Film Drier (ATFD). The treated water is recycled in the cooling tower makeup. Trade effluents from Low TDS ( KLD) is reused and High TDS (1.305) is treated in MEE followed by ATFD. The Zero Liquid Discharge (ZLD) is achieved through the Multi Effect Evaporator (MEE) system followed by ATFD. The domestic wastewater is discharged into ETP for further treatment. Wastewater from production block is segregated into two streams; High TDS (having TDS >25,000 mg/l); Low TDS (having TDS < 25,000 mg/l) along with domestic sewage and utilities wastewater are collected for treatment. These streams from the source of generation are directly conveyed through dedicated HDPE lines to high TDS collection tank and Low TDS 2.7 KKB Envirocare Consultants Pvt. Ltd., Hyderbad
93 NATCO Pharma Ltd., Chemical Division-Chennai-EIA Report Chapter 2: Project Description effluent collection tank. The domestic sewage from each block is collected separately and treated combined with LTDS. The treatment system adopted by the industry consists of the following systems. High TDS Effluent Treatment High TDS & High COD effluent which generated from production block, RO Reject from Primary RO plant are subjected to ph adjustment and feed into Multiple Effect Evaporator (MEE) to enrich the concentration level. The desired concentrate sent to ATFD to obtain the salts and the Salts from ATFD are disposed to Tamil Nadu Waste Management Limited (TNWML) for land filling. Vapour Condensate from MEE & ATFD will sent to secondary RO plant for further recovery and the Permeate from Secondary RO Water is recycled for cooling tower make up. ATFD steam condensate will reuse as a boiler feed. Low TDS Effluents & Domestic Sewage Treatment The total wastewater (Process and non-process) falling under the category of low TDS effluent i.e with TDS levels less than mg/l. The trade effluents generated from process, floor & reactor washings, utility blow downs, scrubber water bleed and domestic sewage are contribute to low TDS effluent. Effluent Treatment plant with capacity of 125 KLD for primary and secondary treatment (activated sludge process) for treatment of Low TDS effluents and domestic sewage water is constructed. Primary Treatment: Wastewater from each production block is collected, pumped and transferred to ETP through HDPE pipelines. The wastewater is passed through oil and grease traps for removal of oil and grease and floating materials. Effluent is collected in equalization cum neutralization tank. Effluent is thoroughly mixed with the help of air to get a homogeneous mixture of Wastewater; both composition and flow rate of the effluent to be treated. The equalization tank is equipped with pumps to provide a constant flow rate to the neutralization and equalization. After equalization, the effluent is neutralized with NaOH or acid to bring the ph level to about 7, the neutralized effluent is pumped to Clariflocculator to clarify the effluent and remove the suspended solids. The clarified effluent is sent to secondary treatment and settled sludge from Clariflocculator is pumped to decanter Centrifuge sludge tank. The sludge collected from decanter centrifuge is dried and disposed to TNWML Secondary Treatment: The secondary treatment is a biological treatment (Activated Sludge Process) process. A two stage activated sludge process is adopted. 2.8 KKB Envirocare Consultants Pvt. Ltd., Hyderbad
94 NATCO Pharma Ltd., Chemical Division-Chennai-EIA Report Chapter 2: Project Description I-Stage: The rectangle aeration tank with capacity of 1200 m 3 is provided with two floating aerators and oxygen mix flow system for Activated Sludge Process. The clarified effluent is fed to the system, which maintains the bacterial culture in mixed liquor suspended solids. The effluent from the aeration tank is passed in a clarifier where the activated sludge is separated from the treated wastewater. A portion of the settled activated sludge is recycled to aeration tank to maintain the desired concentration of MLSS in aeration tank. The overflow from the primary clarifier is send to second stage of activated sludge process called as extended aeration at aeration tank II. If the sludge generation is more in the system, then same will be withdrawn by pumping to the Decanter Centrifuge sludge feed tank. II nd Stage: There is rectangular aeration tank operated with two floating aerators. The treatment process involved in the aeration tank II is same as in aeration tank - I. The overflow from the aeration tank II is connected to the secondary clarifier. In the secondary clarifier, based on the MLVSS value in Aeration Tank-II, bottom sludge will be re-circulated from secondary clarifier to Aeration Tank-II or it will be transferred to Decanter Centrifuge sludge feed tank. In the decanter centrifuge, sludge will be dewatered, the centrate are transferred to EN tank for further treatment and sludge collected from decanter centrifuge is dried and disposed to TNWML. Clarified treated effluent from secondary clarifier will be transferred to feed sump. Tertiary Treatment: The treated effluent collected from feed sump is sent to Primary RO plant of capacity 125 KL/day and % of water is recovered and collected in RO Permeate tank. Treated effluent from primary RO permeate tank has further purified in Secondary RO Plant Capacity 100 KL/day to recover % pure and hardness free water. The treated effluent will be re-used for cooling tower makeup. Reject water from Primary RO & Secondary RO Plant are sent to MEE for concentration and salt recovery Solvent Recovery System The purpose of solvent recovery system is to recover solvents from spent solvent streams and to reuse the pure solvent in manufacturing process. Industry is having integrated solvent recovery system in the process to recover the spent solvents after reaction. The entire distillation operation of all streams is carried out in SS reactors. Vent condensers are provided to all reactors where solvents are being distilled. The vent condensers will be circulated with chilled water in the primary condenser and chilled brine in the secondary condenser. The 90-95% pure solvent collected and reused in the manufacturing process. The solvents which are not fit for use are sent to authorized recovery units for recovery. 2.9 KKB Envirocare Consultants Pvt. Ltd., Hyderbad
95 NATCO Pharma Ltd., Chemical Division-Chennai-EIA Report Chapter 2: Project Description Process Emissions Management Manufacturing of APIs and its intermediates will result in gaseous emissions. Gaseous emissions will be scrubbed in stages with water and caustic solution based on the characteristics of gases. Process emissions from campaign basis for existing products and its treatment are presented in Table 2.3. Industry is having 8 scrubbers to scrub the process emissions. Existing gaseous emissions HCl, SO 2, Bromine, Methyl bromide, Methyl Chloride, Cl 2, Dimethyl Sulfide and CO 2 are sent to multistage scrubbers. The gaseous emissions are being monitored on monthly basis and ph of the scrubbing liquid is being checked on regular basis. Sl. No. Table 2.3: Existing Process Emissions and its Treatment Process Emission Maximum Quantity on various combinations (kg/day) Treatment 1 H Diffused with Flame Arrestor 2 CO Scrubbed by using CS lye solution 3 HCl 32.1 Scrubbed by using water & CS lye solution 4 Dimethyl Sulfide Scrubbed by using CS lye solution 5 Bromine Scrubbed by using water & CS lye solution 6 Methyl Bromide Scrubbed by using CS lye solution 7 SO Scrubbed by using CS lye solution 8 Cl Scrubbed by using CS lye solution 9 N Dispersed into Atmosphere Hazardous / Solid Waste Storage and Disposal Hazardous / Solid waste will be segregated, detoxified and collected in the HDPE drums/ bags and will be stored in the covered and raised platform with Leachate collection system. The existing solid waste and other waste generated, handling and disposal method from the various stages of APIs & its intermediates manufacturing plant is presented in the Table 2.4. Spillages such as wastewater / solid wastes / raw materials are possible and the risk of this would be limited to within the premises of the manufacturing facility. A precautionary measure like spillage control management is practiced in the industry. Table 2.4: Hazardous Waste Generation from the Existing Products (as per CTO) S. No. Name of the Hazardous Waste Quantity (TPA) 1. Process Residue and Wastes Disposal TSDF, Gummidipoondi for Landfill/ incineration 2. Spent Catalyst Spent Carbon TSDF Gummidipoondi for 4. Off Specification Products Incineration 5. Date -Expired Products Spent Solvents 8.64 Authorized recycler for recovery 2.10 KKB Envirocare Consultants Pvt. Ltd., Hyderbad
96 NATCO Pharma Ltd., Chemical Division-Chennai-EIA Report Chapter 2: Project Description S. No. 7. Name of the Hazardous Waste Chemical Sludge from waste water treatment Quantity (TPA) Disposal TSDF Gummidipoondi for Landfill/ Incineration Waste generated from process is collected and packed in HDPE bags, segregated as inorganic and organic solid waste. The solid waste collected in HDPE bags and stored in a covered shed on a platform by ensuring that there will not be any leakage/spillage on to the ground. Organic solid waste is sent to Tamil Nadu Waste Management Limited (TNWML), Gummidipoondi for incineration. Platforms with cement flooring are constructed with leachate collection. Pallets provided for the storage of solid waste bags. The inorganic solid waste generated is being disposed to TNWML, Gummidipoondi through proper documentation. Spent Carbon generated in process is collected in HDPE bags and being disposed to TSDF, Gummidipoondi for Incineration Liquid Organic Waste Storage Organic liquid waste generated in the plant is stored in HDPE drums and transferred to storage platform. The spent mixed solvent generated are collected in HDPE drums and transferred to the storage platform. The HDPE drums are stored in a covered shed on RCC platforms with leachate collection facility to avoid land contamination. These wastes are sent to Authorized Cement industries / TSDF, Gummidipoondi for incineration Incinerator System The incinerator (100 kg/hr) with stack height of 40m attached with scrubber is provided to process packeted solid wastes, drummed solid waste and liquid organic wastes/solvents. The system includes the following unique features to ensure the wastes are destroyed in a safe, controlled and efficient manner: Sl. No. 1 Waste Classification Solid waste from process 2 Liquid Nature Quantity (Kg/hr) Sludge, Spent 50 All liquid streams 50 Handled In Stationary Pyrolyser Combustion Chambers Calorific Value (Assumed) (Kcal/Kg) The combustion and flue gas cleaning system operates under safe negative pressure at all times. This prevents the combustible products to atmosphere prior to being processed through the entire incineration system KKB Envirocare Consultants Pvt. Ltd., Hyderbad
97 NATCO Pharma Ltd., Chemical Division-Chennai-EIA Report Chapter 2: Project Description Both Main Combustion Chamber (MCC) and Post Combustion Chamber (PCC) are maintained at excess air condition at sufficient temperature and residence time to ensure the complete oxidation of wastes The waste feeding system for both solids and liquids are automatically ceased when the temperatures are not maintained above and below the pre-determined set points Highly combustible i.e. high energetic liquid wastes are introduced into the MCC and PCC through self-atomized lances The flue gases from MCC and Single Drum Pyrolyser (SDP) due to waste burning are retained at PCC for a residence time which is in excess of the minimum residence time required for complete oxidation The highly efficient air cleaning system traps the particulate matters and neutralizes the acidic gases prior to their release into the atmosphere System has got the in-built safety interlocks. If any operational parameter goes outside the pre-determined boundary limits, it will cause an automatic shutdown of portion/all of the incineration depending upon the particular upset parameter The incinerator provided is not being used presently because of low waste generation. However, it will be used after expansion Fuel Consumption Furnace oil of about 200 lph is used in the existing 3 TPH furnace oil fired boiler with stack height of 40m from ground level. Diesel about 270 lph is used at full operation load in the existing DG sets of 1010 KVA and 300 KVA. DG sets will be used as standby during power failure Raw Material Storage and Its Safety Features The following are various warehouse storages exist in plant premises Area Raw Material Store Solvent Storage Area Solvent Storage Yard (Tank Farm Area) Engineering Stores Type of Storage Bags, Bottles, drums & Containers Solvent Drum Storage Solvent Bulk storage Engineering spares storage Safety features at Storage areas Dedicated trained team at warehouse management. Dedicated warehouses provided for acids/alkalis/toxic /flammable chemicals. Flammable chemical storage is fitted with low exposure limit (LEL) sensors with alarm system, fire alarm system, required number of suitable fire extinguishers and fire hydrant system provided KKB Envirocare Consultants Pvt. Ltd., Hyderbad
98 NATCO Pharma Ltd., Chemical Division-Chennai-EIA Report Chapter 2: Project Description Dedicated dispensing system connected with scrubber is provided for dispensing of toxic / corrosive / odour compounds. Spill containment facilities provided at warehouse wherever required. Spill kits provided in every storage area with required quantity of spill control materials. Toxic chemicals are stored in a dedicated store room with lock and key, entry procedure in place, entry restricted to limited trained and authorized persons and trained on toxic chemicals handling procedures and emergencies. Regular mock drills conducted. Pallet trucks/hoists used for transferring chemicals thereby minimizing the manual intervention. Bulk volumes are transferred through closing pipelines systems. Low level & high level alarms, for day tanks/storage tanks and splash guards for pipeline flanges. Nitrogen blanketing system with breather valves provided for all solvent storage tanks in tank farm and fire sprinkler system provided in tank farm. Earthing & bonding is provided. Lightening arrestors provided. Bulk tankers unloading permit system is being followed for unloading solvents from road tankers. MSDS for all chemicals are available at every storage area, production blocks, Occupational Health Centre, Safety department. Training conducted on MSDS and hazard labeling of chemicals. Chemical compatibility charts are provided at every storage area & production blocks. Training conducted to all employees. Gas cylinders storage: Gas cylinders are provided with mouth guard and properly arranged with chain locks to avoid toppling. Spill control kits & self-contained breathing apparatus (SCBA) sets provided. Flexible Local exhaust hoods connected to scrubbing system provided for handling any emergencies/ leakages. Mock drills conducted on gas leakage emergency Vehicular Traffic At present 3 staff Cabs with each capacity of 15 employees run to and from to the plant site to bring employees to the industry and take back to their home. The two wheelers are around 30; four wheelers about 04 and trucks 1no. Transport system: All the raw materials and finished products are transported by road. There will be about 9 truck trips per day to the factory. Traffic signs are placed in the battery limit. The drivers of the vehicles will be provided with TREM cards and will be explained the measure to be adopted during various emergencies KKB Envirocare Consultants Pvt. Ltd., Hyderbad
99 NATCO Pharma Ltd., Chemical Division-Chennai-EIA Report Chapter 2: Project Description S. No Occupational Health & Safety Features Industry is having the Occupation Health Centre within the plant premises with factory medical officer; nursing staff in day shifts & Ambulance facility are available round the clock. Industry is evaluating the specific health status of worker during pre-placement and regularly on half yearly basis. The pre-placement medical check-up format covering complete blood picture, biochemistry, Serum Creatinine, urine examination, vision test, X-ray chest PA view, LIPID Profile, Audiogram and ECG is at Annexure-XIV. The half yearly periodical medical check-up for the year 2017 for the employees of all the departments are conducted and various diagnostic services has been carried out and maintaining the record for future reference. Summary of employee medical heath record of direct employees is given below in Table 2.5. Remaining 44 employees are indirect employees; we are in the channel to do the annual medical check-up for indirect employees. Table 2.5: Summary of Employee Medical Health Status of Direct employees Dept. Personnel & Admin No. of Employees Age Age Age Age Male Female Male Female Male Female Male Female Production QC QA EHS Maintenance IT & 7 Operation Stores Total All the equipment s are ensured to have all safety features to protect the employee (such as machine guards/interlocks/hooters/earthing/relief valves/vibration control/ noise levels within the limits by providing acoustic enclosures, etc.). Permissible exposure levels are measured at regular intervals while the equipment s are in operation to ensure that the permissible exposure levels (PELs) are within the limits. If any area PEL is more than the limits, suitable engineering controls & administrative controls will be implemented (such as local exhaust ventilation system exhaust hoods/exhaust fans/hvac, etc. and sign boards, standard operating instructions & training to all relevant employees, etc.). Also personnel protective equipment s (PPEs) will be provided to protect the employee from exposure and is well within the PEL limits (Full body suits, dedicated breathing air compressor & distribution system and bubble hoods/ SCBA/ PAPR/respiratory masks/ ear muffs / antistatic shoes/hand gloves/face shields, portable exhaust systems, etc.) KKB Envirocare Consultants Pvt. Ltd., Hyderbad
100 NATCO Pharma Ltd., Chemical Division-Chennai-EIA Report Chapter 2: Project Description Existing Infrastructure Internal roads are laid with WBM (water bound mecadum) road followed Black Top / Bitumen roads and cement roads are provided in some of the areas. Transportation facilities, vehicle parking, water supply, In-house ETP-ZLD facility, Power supply, Occupational Health Centre, Ambulance, Conference halls, Training hall, Fire station, Telecommunication facility, rain water harvesting, canteen facility etc., are available. Dedicated washrooms/toilets provided for Men & Women. Potable drinking water facilities and First Aid Boxes are provided at various locations of the plant. Separate rest rooms provided for men & women contract labours. Canteen facility provided. Occupational Health centre has provided with factory medical officer & nursing staff in day shift Additional infrastructure after flood effect Additional infrastructure has been developed based on the damage due to flood effect in 2015 which is prepared by Proponent after several discussions with all related departments like Production, Engineering, Experts inputs and Learnt from previous experiences. DG sets are elevated in Ground floor at 1 m height and all Electrical panels, PLCs, Servers shifted to first floor with cover shed. Other priorities are detailed in Annexure-XV Corporate Environment Policy The company has a well laid down Environment Policy approved by its Board of Directors. The environment, health & safety (EHS) policy approved and signed by Chairman & Managing Director in the year 2017(Rev.05). A copy of approved EHS policy is at Annexure- XVI. To comply with approved EHS policy, proponent developed standard operating procedures/ work instructions for EHS activities. Industry is having a dedicated EHS department headed by Manager rank employee with 15 years of experience in the field of EHS management. There are about 7 employees working in EHS department. The EHS head is directly reporting to the General Manager- Operations who is directly overseen the EHS department. Proponent has established the reporting mechanism of violations / deviations /non- compliances with respect to Environment. Regular management review meetings will be conducted at site level with all functional heads and chaired by Director & Executive Vice President. The minutes of meeting /decision will be presented to the Board by the Director & Executive Vice President Environmental Monitoring Industry installed online continuous AAQ monitoring station (Mobile Van) in plant premises and connected to TNPCB website- Care Air Centre. We also installed online ph, 2.15 KKB Envirocare Consultants Pvt. Ltd., Hyderbad
101 NATCO Pharma Ltd., Chemical Division-Chennai-EIA Report Chapter 2: Project Description TDS, TSS, COD & BOD analysers along with CCTV facility to monitor the treated effluent quality as per TNPCB/CPCB guidelines and real time monitoring data s are uplinked to TNPCB Water Quality Watch centre. Online 3 VOC analysers are installed with alarms at various locations within the industry and data s are uplinked to Care Air centre- TNPCB. In addition to this, Industry is monitoring the ambient air quality (AAQ), Stack emissions monitoring at Boiler, DG sets, effluent treatment at various stages of treatment, Noise levels, VOC within plant premises from time to time with the help of third party laboratory services and results are attached at Annexure-XVII. The analysis results are found within prescribed standards for all the parameters. The industry has established in-house laboratory to monitor the effluent parameters and also equipped with portable instruments to measure VOC/sound levels etc Action Plan Compliance as per TNPCB / CPCB Tamil Nadu Pollution Control Board has prepared an action plan for compliance and control of pollution for reducing the Comprehensive Environmental Pollution Index (CEPI). NATCO has initiated action plan, both short term & long term measures to improve the environmental quality so as to reduce CEPI (Table 2.6). The monitoring activities by the industry are presented in Table 2.7. Photographs of Online Monitoring activities are given in Plate 2.4. Table 2.6: Action plan for reducing the CEPI implementation S. Description Status Remarks No. Long term Action plan 1 Rain water Harvesting pond to be provided. Short term Action plan Effluent Treatment Plant with Zero Liquid Discharge Installing On-line Continuous Ambient Air Monitoring System Installing Online Ambient Continuous VOC Monitoring System-3 Nos (Areas) Implemented Effluent generated is segregated based on its characteristics and sent to ETP -ZLD Online Continuous Ambient Air Monitoring System parameters such as PM 2.5, SOx, NOx & CO) uplinked to TNPCB Care Air center from August-2010 Online Ambient Continuous VOC Monitoring System provided and data s are uplinked to TNPCB from August Rain water Harvesting pond is provided & during rainy season all the rain water has been collected into the Pond & reusing the same for gardening purpose. Action plan Implemented Action plan Implemented VOC analyzers are installed in 1. Production area 2. ETP area and 3. MEEP area. Action plan has been Implemented 2.16 KKB Envirocare Consultants Pvt. Ltd., Hyderbad
102 NATCO Pharma Ltd., Chemical Division-Chennai-EIA Report Chapter 2: Project Description S. No. 4 5 Description Status Remarks On-line Stack continuous Monitoring System for incinerator Hazardous Waste storage and Handling As suggested by TNPCB, we are not operating Incinerator since from the inception. Hazardous waste will be segregated and collected in the HDPE drums / bags as appropriate and will be stored in the covered and raised platform with provision of leachate collection system We are collecting, storing and transporting all the incineration waste to TNWML to incinerate in their facility. Action plan has Implemented Hazardous waste are segregated, collected and stored appropriately before sending to the Tamil Nadu Waste Management Limited(TNWML) Table 2.7: TNPCB Action plan (November 2010) for reducing the CEPI- Monitoring S. TNPCB action plan Action by Industry Monitoring status No. Air Environment Online Ambient Continuous VOC To monitor the VOC levels Monitoring System provided at: Data s are uplinked to TNPCB 1 at the vulnerable points of 1. Production area website from August the processing area 2. ETP area and 3. MEEP area. 2 To monitor the hazardous waste incinerator stack, SO 2 scrubber, HCl Scrubber. As suggested by TNPCB, we are not operating Incinerator since from the inception. Additional measures taken by the industry for Air Environment Installing On-line Installed online Continuous Ambient 3 Continuous Ambient Air Monitoring System Air Monitoring System parameters such as PM 2.5, SOx, NOx & CO. Prior operation, industry installed 4 SO 2 gas from process Two stage scrubber with caustic lye as scrubbing media 5 HCl gas from process 6 Other process emissions Water & Soil Environment 1 2 ETP area Hazardous Waste Storage area Prior operation, industry installed scrubber with caustic lye as scrubbing media Prior operation, industry installed scrubbers with water / caustic lye as scrubbing media based on the characteristics of gas Effluent generated is segregated based on its characteristics as HTDS/HCOD, LTDS/LCOD and Domestic waste water and sent through closed pipes to Effluent Treatment Plant with Zero Liquid Discharge (ETP ZLD system). Hazardous waste is being segregated and collected in the HDPE drums / bags as appropriate and is being stored in the covered and raised platform with provision of leachate collection system We are collecting, storing and transporting all the incineration waste to TNWML to incinerate in their facility. Data uplinked to TNPCB Care Air centre from August-2010 Regularly checking the ph and recording in the scrubber log book Online ph, TDS, TSS, COD & BOD analysers along with CCTV facility to monitor the treated effluent quality as per TNPCB/CPCB guidelines and real time monitoring data s are uplinked to TNPCB Water Quality Watch centre. Treated water is being used in Cooling towers. Regularly sending to the Tamil Nadu Waste Management Limited (TNWML) KKB Envirocare Consultants Pvt. Ltd., Hyderbad


103 NATCO Pharma Ltd., Chemical Division-Chennai-EIA Report Chapter 2: Project Description Plate 2.4: Online Monitoring facilities in the Industry Online AAQ monitoring Mobile station PM2.5, SO2, NOx, CO sensors in Online AAQ Station VOC analyzer at Production area VOC analyzer at ETP area CPCB Real Time Monitoring report Snap Shot PCB website Real Time Monitoring report Snap Shot TSS, ph, Conductivity sensors in ETP TOC analyzer at ETP TSS, ph, Conductivity sensors in ETP CCTV CCTV CCTV observing Flow meter Flow meter 2.18 KKB Envirocare Consultants Pvt. Ltd., Hyderbad
104 NATCO Pharma Ltd., Chemical Division-Chennai-EIA Report Chapter 2: Project Description 2.4 Proposed Expansion Project The proposed expansion activity is within the existing plant premises lies between N latitude and E longitude located in R.S.Nos. 73/1A, 73/2, 74/7B, 78/1B, 79/1, 79/2B, 79/3, 79/4B, 79/5, 79/6A, 79/6B, 79/7, 80/1, 80/2, 80/3, 80/4, 84/1, 84/2, 84/3A, 84/5A, 84/6, 84/7A, 85/1, 85/2B, 86/2B, 86/2C, 86/2D2, 86/3B, 86/4, 86/5, 86/6, 86/7, 86/8, 86/9 of Manali Industrial Area, Thiruvottiyur Taluk (formerly Vaikkadu (V), Ambattur (Tq.)), Thiruvallur District, Tamil Nadu. The unit is located in Manali Industrial Area. The project site was reclassified from Primary Residential use zone to Special and Hazardous use zone by Chennai Metropolitan Development Authority (CMDA). This proposed expansion project site is located at a distance (aerial) of 8 km (W) from National Highway No.16 (Chennai- Kolkata); about 0.25 km from Andarkuppam village; about 0.9 km from Kanniyammanpettai village (W); Manali Town at 1.6 km (S); Tiruvottiyur railway station at 4.4 km in SE direction; Chennai International Airport at 23 km in SSW direction; Harbour (Chennai Port) at 7 km (SSE) Ennore port at 11 km (NNE) and 5.5 km (E) to Bay of Bengal. The list of permitted / proposed products, their production capacities, status after expansion is presented in Table 2.8. Out of 18 existing products, 12 products are dropped, 6 products quantity increased, 36 new products are added. Proposed products, CAS No., their capacity along with Therapeutic category are presented in Table 2.9. The total products will be 42 after expansion and will be manufactured 16 products at a time. Sl. No. Table 2.8: Permitted and Proposed Products, their quantities and its Status Product Permitted (TPA) Additional (TPA) Total after Expansion (TPA) Status 1 Allylestrenol Dropped 2 Drospirenone Dropped 3 Daunomycin Hydrochloride Dropped 4 Altretamine Dropped 5 Epirubicin Hydrochloride Dropped 6 Idarubicin Hydrochloride Dropped 7 Nandrolone Decanoate Dropped 8 Chlorambucil Increased 9 Doxorubicin Hydrochloride Increased 10 Fulvestrant Increased 11 Testosterone Decanoate Dropped 12 Geftinib Increased 13 Imatinib Methane Sulfonate Dropped 14 GB-5 intermediate Dropped 15 Temozolomide Dropped 16 Sumatriptan Dropped 17 Setraline Hydrochloride Increased 18 Melphalan Increased 19 Bendamustine HCl New 20 Bortezomib New 21 Decetabine New 22 Everolimus New 2.19 KKB Envirocare Consultants Pvt. Ltd., Hyderbad
105 NATCO Pharma Ltd., Chemical Division-Chennai-EIA Report Chapter 2: Project Description Sl. No. Product Permitted (TPA) Additional (TPA) Total after Expansion (TPA) Status 23 Temsilrolimus New 24 Trabectedine New 25 Busulfan New 26 Lenalidomide New 27 Nelarabine New 28 Thiotepa New 29 Azacitidine New 30 Epothiline B New 31 Pomolidomide New 32 Sirolimus New 33 Carmustine New 34 Cabozantinib-S-Malate New 35 Dasatinib Monohydrate New 36 Erlotinib Hydrochloride New 37 Imatinib Mesylate New 38 Lapatinib Ditosylate Monohydrate New 39 Nilotinib Hydrochloride New 40 Palbociclib New 41 Pazopanib Hydrochloride New 42 Sorafenib Tosylate New 43 Sunitinib Malate New 44 Dabigatran Etexilate New 45 Deferasirox New 46 Lansoprazole New 47 Lanthanum Carbonate Dihydrate New 48 Ledipasvir New 49 Ondansetron Hydochloride Dihydrate New 50 Pirfenidone New 51 Rizatriptan Benzoate New 52 Sacubitril New 53 Sumatriptan Succinate New 54 Ticagrelor New Source: M/s NATCO Pharma Limited-Chemical Division, Chennai Table 2.9: Proposed Products, their Capacity and Therapeutic Category S. Quantity Quantity Product No. kg/day (TPA) CAS No. Therapeutic Category 1. Bendamustine HCl Antineoplastic agent 2. Bortezomib Antineoplastic agent 3. Decetabine Antineoplastic agent 4 Everolimus Antineoplastic agent 5 Temsilrolimus Antineoplastic agent 6 Trabectedine Antineoplastic agent 7 Busulfan Antineoplastic agent 8 Lenalidomide Antineoplastic agent 9 Nelarabine Antineoplastic agent 10 Thiotepa Antineoplastic agent 11 Azacitidine Antineoplastic agent 12 Chlorambucil Antineoplastic agent 13 Doxorubicin Hydrochloride Antineoplastic agent 14 Epothiline B Antineoplastic agent 15 Fulvestrant Antineoplastic agent 16 Pomolidomide Antineoplastic agent 2.20 KKB Envirocare Consultants Pvt. Ltd., Hyderbad
106 NATCO Pharma Ltd., Chemical Division-Chennai-EIA Report Chapter 2: Project Description S. No. Product Quantity kg/day Quantity (TPA) CAS No. 17 Sirolimus Therapeutic Category Immunosuppressive agents 18 Carmustine Antineoplastic agent 19 Melphalan Antineoplastic agent 20 Cabozantinib-S-Malate Antineoplastic agent 21 Dasatinib Monohydrate Antineoplastic agent 22 Erlotinib Hydrochloride Antineoplastic agent 23 Geftinib Antineoplastic agent 24 Imatinib Mesylate Antineoplastic agent 25 Lapatinib Ditosylate Monohydrate Antineoplastic agent 26 Nilotinib Hydrochloride Antineoplastic agent 27 Palbociclib Antineoplastic agent 28 Pazopanib Hydrochloride Antineoplastic agent 29 Sorafenib Tosylate Antineoplastic agent 30 Sunitinib Malate Antineoplastic agent 31 Dabigatran Etexilate Anticoagulant 32 Deferasirox Chelating Agents 33 Lansoprazole Proton pump inhibitors 34 Lanthanum Carbonate Renal and genitourinary Dihydrate agent 35 Ledipasvir Antiviral 36 Ondansetron Hydochloride Dihydrate Antimetic 37 Pirfenidone Anti-inflammatory agent 38 Rizatriptan Benzoate Antimigraine 39 Sacubitril Cardiovascular Agent 40 Sertaline Hydrochloride Selective serotonin reuptake inhibitors 41 Sumatriptan Succinate Antimigraine 42 Ticagrelor Total 16 products at time out of total 42 products R & D Activity Developmental Products (D) Total 16 products at time out of total 42 products and R&D products Amenities/ facilities Platelet Aggregation Inhibitor Industry will continue to provide and upgrade the following amenities / facilities in the proposed expansion project. Canteen Potable drinking water Training block Laying of Black top / Concrete internal roads Fire hydrant facility Eye/body wash showers at all prominent places First Aid kits at all prominent places 2.21 KKB Envirocare Consultants Pvt. Ltd., Hyderbad
107 NATCO Pharma Ltd., Chemical Division-Chennai-EIA Report Chapter 2: Project Description Head nurse for emergency medication Occupational health centre Rest Room for employees Seating facilities for those employees who do their work standing and ergonomically designed seating facilities for those who do their work seating Pre-employment and routine medical examinations and the necessary follow up actions Communication systems like Phone, Internet with safety measures, etc. Security system at the entrance etc Health and Sanitation Facilities To ensure optimum hygienic conditions in the plant area, proper closed drainage network will be extended in the expansion area to avoid water logging and outflow. Adequate health related measures will be provided to ensure clean and healthy environment Project Cost and Time of Completion The existing investment of Rs Crores with additional investment of Rs.100 Crores is being invested totaling Rs Crores. The existing capital cost Rs.15 Crores with additional cost of Rs.5 Crores is allocated towards Occupational Health, Safety & environmental pollution control measures totaling to Rs. 20 Crores. Existing recurring (operation and maintenance) cost is Rs. 2.5 Crores per annum with additional recurring cost will be about Rs.12 Crores per annum totaling to Rs.14.5 Crores per annum. The timelines for commencement of proposed construction activity will be from October 2017 as it is expected that the expansion project will be in a position to obtain Environmental Clearance from MoEF&CC and Consent to Establishment from the State Pollution Control Board. The commercial production is expected to be commenced during Products Process Description The proposed expansion unit to manufacture 42 APIs, its intermediates with R&D facility with a production capacity of TPA on campaign basis, total 16 campaign products at a time and R&D activity against existing production capacity of TPA. Most pharmaceutical substances are manufactured utilizing 'batch' process. The same equipment with potentially different configurations and the same operating personnel are often used to make a different intermediate or substance, utilizing different raw materials, executing different processes, and generating different waste streams. Bulk pharmaceutical substances typically consist of structurally complex organic chemical under precise conditions. These substances are used in the manufacture of the dosage form of a formulated pharmaceutical 2.22 KKB Envirocare Consultants Pvt. Ltd., Hyderbad
108 NATCO Pharma Ltd., Chemical Division-Chennai-EIA Report Chapter 2: Project Description product and are manufactured by Chemical synthesis, Isolation/recovery from natural sources and/or Combination of above. Based on the inputs provided by the project proponent with list of products with therapeutic category, production capacity, process description, process flow chart, route of synthesis, material balance has been estimated. Manufacturing of API s & its intermediates consists of chemical synthesis extending to a maximum of 18 stages and minimum of one stage of processing involving different type of chemical reactions. The product wise Raw materials requirement, Route of Synthesis, process description, Process flow sheet, chemical reactions, stage wise material balance material balances and overall pollution load generated per batch per day, gaseous emissions, solvent consumption details are computed. The maximum pollution load generation for the combination of various products also estimated. The material balances, process flow sheet and process description of all the 42 products are presented in Volume-II separately Active Pharmaceutical Ingredients (APIs) and its Intermediates Technology for manufacturing proposed products is available from in-house R&D & private consultants. Industry will implement the proven technologies in the R&D for the cost effective & environmental friendly practices. It is important to understand the regulatory framework in which pharmaceutical products are manufactured. To protect the public from unsafe or ineffective pharmaceutical products, Indian constitution established a stringent regulatory system to control the Research & Development, manufacture and marketing of pharmaceutical products. The Food and Drug Administration (FDA) was delegated the responsibility for : (i) Evaluating the safety and efficacy of new drugs; (ii) Determining if the benefits of the drug outweigh the risks and warrant approval for sale; and (iii) Reviewing toxicological performance of active pharmaceutical ingredients. For most new pharmaceutical compounds, FDA oversight begins soon after the discovery of the compound. The manufacture of pharmaceutical products can be divided into three main stages: Research & Development Conversion of organic and natural substances into bulk pharmaceutical substances or ingredients through fermentation, extraction, and / or chemical synthesis; and Formulation of the final pharmaceutical product KKB Envirocare Consultants Pvt. Ltd., Hyderbad
109 NATCO Pharma Ltd., Chemical Division-Chennai-EIA Report Chapter 2: Project Description A typical APIs & its intermediates process technology: Production of Bulk Pharmaceutical Substances Most pharmaceutical substances are manufactured utilizing 'batch' process. In a batch process, a particular substance or intermediate is manufactured on a 'campaign' basis for periods ranging from a few days to several months until sufficient material is manufactured to satisfy the projected sales demand. At the end of the manufacturing campaign, another pharmaceutical intermediate or substance is made. The same equipment with potentially different configurations and the same operating personnel are often used to make a different intermediate or substance, utilizing different raw materials, executing different processes, and generating different waste streams. Bulk pharmaceutical substances typically consist of structurally complex organic chemical under precise conditions. These substances are used in the manufacture of the dosage form of a formulated pharmaceutical product and are manufactured by: Chemical synthesis Isolation/recovery from natural sources and/or Combination of above. In the proposed project, APIs and its intermediates are manufactured using chemical synthesis technology which is described below and a typical schematic process flow chart is depicted in Fig Chemical Synthesis Most of the compounds used today as pharmaceutical products are prepared by chemical synthesis, generally by a batch process. The products manufactured are used in Pharmaceutical formulation industry and the therapeutic category of the products is Antineoplastic agent, Immuno suppressive agent, Anti-coagulant, Chelating agent, Proton Pump inhibitors, Renal and genitourinary agent, Antiviral, Antimetic, Anti-Inflammatory agent, Antimigraine, Cardiovascular agent, selective serotonin reuptake inhibitors, Platelet Aggregation inhibitor etc., which are applicable for human consumption around the world after formulation activity. The manufacture of pharmaceutical compounds using chemical synthesis involves a complex series of processes including many intermediate stages and chemical reactions performed in a step-by-step fashion. Depending on the process, the operator (or programmed computer) adds reagents, increases or decreases the flow rate of chilled water or steam, and starts and stops pumps to draw the reactor contents into another vessel. At other stages in the process, solutions may be pumped through filters or centrifuges, recycled within the process, or pumped to recycling or disposal facilities. Co-products, such as salts, may be sold to potential buyers for 2.24 KKB Envirocare Consultants Pvt. Ltd., Hyderbad


110 NATCO Pharma Ltd., Chemical Division-Chennai-EIA Report Chapter 2: Project Description reuse. Spent acids, metals and catalysts may be recovered and reused onsite or given to authorized vendors. The material from each intermediate step may be isolated and transferred to the next step of the process for continued processing until the final compounds are derived. These steps may be all conducted at the same manufacturing site, or if the intermediate is isolated, it may be transferred to another site for further processing. It is impossible to provide a single process flow diagram for this industry since each bulk pharmaceutical substance is different in its manufacture and several intermediates may be produced in a step-wise fashion prior to the manufacture of the final active ingredient. Reactors Fig. 2.1: Typical Manufacturing process of API s & API Intermediates Raw materials or ingredients, including solvents, used to produce the intermediate or bulk substances are charged into the reactor vessel. Liquid ingredients are drawn into the reactor either by closed pumping or through vacuum from drums and day storage tanks. Solids may be charged manually or via mechanical means such as through a vacuum system / interlocking systems. Once the reactor vessels are charged with the solvent and raw materials, the reaction takes place. The reactor can be operated at atmospheric pressure, elevated pressure or under vacuum. Because of their flexibility, reactors may be used in a variety of ways. Besides hosting chemical reactions, they can act as mixers, heaters / coolers, holding tanks, crystallizers, and evaporators. Typical reactions performed include reduction, hydrogenation, 2.25 KKB Envirocare Consultants Pvt. Ltd., Hyderbad
111 NATCO Pharma Ltd., Chemical Division-Chennai-EIA Report Chapter 2: Project Description bromination, chlorination etc. Temperature, pressure and the degree of mixing are carefully monitored to achieve the desired product and to ensure worker safety. Separation Several separation mechanisms are employed by the pharmaceutical industry including extraction, decanting, centrifugation and filtration. These mechanisms may be employed jointly or individually, in multiple stages, to separate the intermediate or bulk substance from the reaction solution and to remove impurities. Extraction Extraction is used to separate liquid mixtures by taking advantage of differences in the solubility of the mixture components. Absolvent that preferentially combines with only one of the components is added to the mixture. Decanting Decanting is a simple process used to separate mixtures of liquid and insoluble solid that has settled to the bottom of a reactor or settling vessel. The liquid over the solid is either pumped out of the vessel or poured from the vessel leaving behind the insoluble solid and a certain amount of liquid. Centrifugation Centrifuges are used to remove the intermediate or product solids from a liquid stream. Centrifuges work on the principle of centrifugal force, in which an outward force is exerted on rotating object. Centrifuges are cylinders with rotating baskets within them. The sides of the basket are perforated and covered with filter medium such as woven fabric or metal. Filtration Filtration is the separation of fluid-solids mixture-involving passage of most of the fluid through a porous barrier (the filter medium), which retains most of the solid particulates, contained in the mixture. In the pharmaceutical industry, filtration is used to remove solids from a liquid, whether these solids be product, process intermediates, catalysts or carbon particulates (e.g., from a discolouring step). Crystallization After the reaction takes place, the intermediate or final bulk substance (which is usually in solid form) can be separated from the reaction solution by crystallization. Crystallization is one of the most common separation techniques and is often used alone or in combination with one or more of the separation techniques described above. In crystallization, a supersaturated 2.26 KKB Envirocare Consultants Pvt. Ltd., Hyderbad
112 NATCO Pharma Ltd., Chemical Division-Chennai-EIA Report Chapter 2: Project Description solution is created in which crystals of the desired compound are formed. Super saturation depends on the solubility of the desired compound. Purification Once the intermediate or the bulk substance has been separated, it may need to be purified. Depending on the intermediate or the bulk substance produced, there may be several purification steps involved to produce the desired active ingredient. In vitamin production, for example, there are at least three to four purification steps. Purification typically is achieved through additional separation steps such as those described above. Purification is often achieved through re-crystallization. Washing with additional solvents and filtration may also be used. Drying The final step in the chemical synthesis process is drying of the intermediate or final bulk substance. Drying is done by evaporating the solvents from the solids. Solvents released from drying operations may be condensed for reuse or disposal. There are various types of dryers used by the pharmaceutical industry including tray dryers, rotary cone vacuum dryers, drum or tumble dryers. The selection of the dryer type depends primarily on the characteristic of the solid. Bulk Manufacturing Wide variation in bulk manufacturing makes prediction of typical or annual average emissions difficult. This is because emission generated are predicted based on type of bulk substance or intermediate manufactured, duration of manufacturing time, type of equipment used and raw materials used. Dryers are one of the sources of VOC emissions in bulk manufacturing. In addition to the loss of solvent during drying, manual loading and unloading of dryers can release solvent vapours into ambient air, especially when tray dryers are used. VOCs are emitted from reaction and separation steps via reactor vents and many ways. Centrifuges may be source of VOC emissions, especially in top loading types, where solid are manually scooped out. Typical controls for these emission sources, excluding storage and transfer operations, include condensers, scrubbers, carbon absorbers. Storage and transfer emissions can be controlled by vapour return lines, vent condensers, vent scrubbers, pressure tanks and carbon absorbers. Floating roofs may be feasible controls for large vertical storage tanks KKB Envirocare Consultants Pvt. Ltd., Hyderbad
113 NATCO Pharma Ltd., Chemical Division-Chennai-EIA Report Chapter 2: Project Description 2.6 Plant Layout A detailed plant layout of M/s NATCO Pharma Limited, Chemical Division is presented in Fig. 2.2, which shows the layout of production blocks, raw material storage, solvent storage tanks, hazardous waste storage, boiler house, ETP, DG set room, furnace oil storage area etc. and the built-up area of existing and proposed activities. The existing and proposed break-up of the land use of the project site is presented in Table Table 2.10: Land Break-up Details Existing Land Area Proposed Land use Total Land after S. Description Details for Expansion Expansion No. (SQ.M) (%) (SQ.M) (%) (SQ.M) (%) 1. Ground Coverage Area Green Belt Area Lawn Area OSR Land (10%) Road Area Vacant Area for Future Expansion Reduced by 10.2 % Total Source: M/s NATCO Pharma Limited-Chemical Division, Chennai OSR = Open space reservation 2.28 KKB Envirocare Consultants Pvt. Ltd., Hyderbad

114 NATCO Pharma Ltd., Chemical Division-Chennai-EIA Report Chapter 2: Project Description Fig. 2.2: Plant Layout 2.29 KKB Envirocare Consultants Pvt. Ltd., Hyderbad
115 NATCO Pharma Ltd., Chemical Division-Chennai-EIA Report Chapter 2: Project Description Sl. No. 2.7 Raw Materials Storage, Handling and Transportation Active Pharmaceutical Ingredients (APIs) & its Intermediates manufacturing involves the use of various chemicals and organic solvents either directly as reactant or for extraction of a product of interest from the reaction mixture. The chemicals required for the process are mostly bought from the local (indigenous) markets. Some of these raw materials will be imported from various countries. Mode of transportation of all raw materials and finished products for / from the project site is by road from / to local markets and by road / rail / air / sea if imported / exported. The list of solvents & Hazardous Chemicals required for the manufacture of proposed products along with their storage capacity is presented in Table List of Other Chemicals and its Consumption, Storage & Handling is presented in Table Maximum petroleum licensed facility is to store Class-A in Bulk, Class-B in bulk and Class-C in Bulk are 50 KL, 40KL and 40KL respectively. Class A other than Bulk and Class-B other than Bulk are 24KL and 24 KL respectively. Table 2.11: List of Solvents & Hazardous Chemicals and its Consumption, Storage and Handling Solvent Consumption /day Kg (or) lit Max. Storage Storage Container Tons (or) KL Type of packing Packets / drums / bags etc. (Nos) Storage area 1 Acetone SS Tanker 28 KL 1 Tanker 2 Acetonitrile MS Drum 200 L 20 Ware House 3 Bromoform MS Drum 100 L 6 Ware House 4 Chloroform SS Tanker 28 KL 1 Tanker 5 Cyclohexane MS Drum 200 L 7 Ware House 6 Diethyl Ether MS Drum 200 L 10 Ware House 7 Diisopropyl ether MS Drum 200 L 1 Ware House 8 Dimethyl Sulfoxide HDPE Drum 200 L 4 Ware House 9 Dimethylacetamide HDPE Drum 200 L 2 Ware House 10 Ethanol SS Tanker 10 KL 1 Tanker 11 Ethyl Acetate SS Tanker 28 KL 1 Tanker 12 Heptane MS Drum 200 L 20 Ware House 13 Hexane SS Tanker 28 KL 1 Tanker 14 Isopropyl Acetate HDPE Drum 200 L 3 Ware House 15 Isopropyl Alcohol SS Tanker 28 KL 1 Tanker 16 Isopropyl Ether MS Drum 200 L 9 Ware House 17 Methanol SS Tanker 28 KL 1 Tanker 18 Methyl Ethyl Ketone MS Drum 200 L 2 Ware House 19 Methyl isobutyl ketone MS Drum 200 L 2 Ware House 20 Methyl tert-butyl ether MS Drum 200 L 3 Ware House 21 Methylene Chloride SS Tanker 28 KL 1 Tanker 22 Toluene SS Tanker 28 KL 1 Tanker 23 n-butanol HDPE Drum 200 L 4 Ware House 24 o-xylene MS Drum 25 L 2 Ware House 25 Pyridine HDPE Drum 200 L 5 Ware House 26 Tetrahydrofuran MS Drum 200 L 20 Ware House 27 2,6-Lutidine HDPE Drum 25 L 12 Ware House 28 1,4-Dioxane HDPE Drum 200 L 4 Ware House 2.30 KKB Envirocare Consultants Pvt. Ltd., Hyderbad
116 NATCO Pharma Ltd., Chemical Division-Chennai-EIA Report Chapter 2: Project Description Hazardous Chemicals Sl. No. Hazardous Chemical Consumption / day Kg (or) lit Max. Storage lit (or) Kg Storage Container Type of packing Packets / drums / bags etc. (Nos) Storage area 1. Acetic acid HDPE Drum 200 L 3 Ware house 2. Acetic Anhydride HDPE Drum 200 L 3 Ware house 3. Anisole HDPE Drum 50 Kg 7 Ware house 4. Aluminium Chloride Bottle 0.2 Kg 1 Ware house 5. Ammonia (20%) solution HDPE Drum 200 L 5 Ware house 6. Ammonia Hydroxide (25%) HDPE Drum 100 L 4 Ware house 7. Benzyl Chloride HDPE Drum 100 L 15 Ware house 8. Bromine Bottle 0.5 Kg 5 Ware house 9. Bromobenzene HDPE Drum 100 L 4 Ware house 10. Chlorine Gas Cylinder 50 Kg 9 Ware house Cyanamide (50%) 11. solution HDPE Drum 25 Kg 12 Ware house 12. Dimethyl Carbonate HDPE Bag 25 Kg 6 Ware house 13. Dimethyl Sulfate HDPE Drum 250 Kg 2 Ware house 14. Dimethylamine (40%) SS 170 Kg 16 Ware house 15. Dimethylformamide MS Drum 200 Kg 36 Ware house 16. Hydrochloric acid (35%) PP FRP Tank 3 KL 1 Acid storage tank 17. Hydrogen Cylinder 7 M 3 14 Ware house 18. 1,2-Dimethoxyethane HDPE Drum 200 L 6 Ware house Methyl Tetrahydrofuran HDPE Drum 200 L 20 Ware house Hydrogen Bromide (2.4%) in Methanol Bottle 2 Kg 21 Ware house 21. Hydrogen Chloride gas Cylinder 7 m 3 4 Ware house Hydrogen Peroxide (50%) Bottle 2 Kg 2 Ware house 23. Lithium Bromide Bottle 2 Kg 2 Ware house 24. Methanesulfonic acid HDPE Drum 50 Kg 6 Ware house 25. Monoethanolamine HDPE Drum 2 Kg 2 Ware house 26. Nitric acid (70%) HDPE Drum 40 Kg 40 Ware house 27. Phosphorous Oxychloride HDPE Drum 40 Kg 18 Ware house 28. Phosphorus pentoxide HDPE Drum 25 Kg 25 Ware house 29. Silver Nitrate Bottle 0.20 Kg 3 Ware house 30. Sodium Methoxide HDPE Drum 25 Kg 1 Ware house 31. Sodium Nitrite HDPE Drum 50 Kg 13 Ware house 32. Sodium Sulfate HDPE Drum 50 Kg 13 Ware house Stannous Chloride 33. dihydrate HDPE Drum 50 Kg 9 Ware house 34. Sulfuric acid HDPE Drum 50 Kg 45 Ware house 35. Thionyl Chloride HDPE Drum 100 Kg 50 Ware house 36. Thiourea HDPE Bag 50 Kg 8 Ware house 37. Trifluoroacetic acid HDPE Drum 50 Kg 14 Ware house Mode of Transportation: Road Handling method from Ware House to Production blocks: Trolley for drums & pipelines for tanks 2.31 KKB Envirocare Consultants Pvt. Ltd., Hyderbad
117 NATCO Pharma Ltd., Chemical Division-Chennai-EIA Report Chapter 2: Project Description Sl No Table 2.12: List of Other Chemicals and its Consumption, Storage & Handling Raw Material ((N-Phthalimidoyl)-4-[Bis(2- hydroxylethyl)- amino]-lphenylalanine (1S,2S,3R,5S)-Pinanediol- β-(1-phenyl)-l-alanine-l- Leucine boronate Hydrochloride (2R,4S)-5-Biphenyl-4-yl-4- tert-butoxy carbonylamino- 2-methyl pentanoic acid (E)-3-(Dimethylamino)-1-(3- pyridyl)prop-2-en-1-one Consum -ption Kg/day Max. Storage Kg (or) lit No. of days Physical status Storage Container Type of packing 2.32 KKB Envirocare Consultants Pvt. Ltd., Hyderbad Packets / drums / bags etc. (Nos.) Liquid Bottle 1 Kg Solid Bottle 0.2 Kg Liquid HDPE Drum 25 Kg Solid Bottle 2 Kg (R)-(+)-Phenylethyl amine Liquid HDPE Drum 25 Kg 3 6. (S)-Malic acid Solid Bottle 1 Kg (4-Fluorophenyl carbamoyl) cyco propane Liquid HDPE Drum 10 Kg 4 carboxylic acid 8. 1-(7-Bromo-9,9-difluoro-9H- fluorene-2-yl) Solid HDPE Drum 10 Kg 9 chloroethanone 9. 1,1-Bis (diphenyl phosphino) ferrocenepalladium (II) dichloride Liquid HDPE Drum 1 Kg 7 dichloromethane complex 10. 1,2,3.5-Tetra-o-acetylribofuranose Solid Poly Bottle 2 Kg ,4-Butanediol Liquid Bottle 0.25 Kg (Acetyloxy)-7-[9- bromononyl]-(7α,7β)-estr Liquid Bottle 0.5 Kg 7 en-3-one Bromo-3-chloropropane Liquid HDPE Drum 200 Kg Chloro-3,5-di-p-Toluoyl-2- deoxy-d-ribofuranose Solid HDPE Drum 10 Kg Chloromethyl-4- nitrobenzene Liquid HDPE Drum 10 Kg 4 1-Ethyl-3-(3-dimethylamino propyl)carbodimide Liquid HDPE Drum 5 Kg 10 Hydrochloride Hydroxybenzotriazole Solid HDPE Drum 5 Kg (1H-Benzotriazole-1-yl)- 1,1,3,3-tetramethyl uronium Solid Bottle 1 Kg 1 tetrafluoro borate 19. 2,2-Bis-hydroxymethyl propionic acid Solid Poly Bottle 0.1 Kg ,2-Dimethoxyproapne Liquid Bottle 0.1 Kg Amino-5-methyl pyridine Solid HDPE Drum 5 Kg Amino-6-chloropurine Solid Bottle 0.1 Kg Chloro-6-methylaniline Solid HDPE Drum 5 Kg 7
118 NATCO Pharma Ltd., Chemical Division-Chennai-EIA Report Chapter 2: Project Description Sl No. 24. Raw Material 2-Hydroxymethyl-3-methyl pyridine Hydrochloride Consum -ption Kg/day Max. Storage Kg (or) lit No. of days Physical status Storage Container Type of packing 2.33 KKB Envirocare Consultants Pvt. Ltd., Hyderbad Packets / drums / bags etc. (Nos.) Solid HDPE Drum 10 Kg Iodoethylin ethyl ether Liquid HDPE Drum 10 Kg Mercapto Benzimidazole Solid HDPE Drum 5 Kg Methanesulfonyl ethylamine Hydro chloride Solid HDPE Drum 10 Kg Methoxyethanol Liquid HDPE Drum 10 Kg Methyl-1H-imidazole Solid HDPE Drum 10 Kg Methyl-1-propyl boronic acid Liquid Bottle 0.1 Kg Picolinic acid Solid HDPE Drum 10 Kg Pyrazinecarboxylic acid Solid Bottle 0.1 Kg (4-Methylimidazol-1-yl)-5- (trifluoro methyl) aniline 3-(4-Morpholinyl) propyl chloride 3-(Dimethylamino)-1-(3- pyridyl) prop-2-en-1-one 3-Aminoglutarimide Hydrochloride 3-Chloro-4- fluorophenylamine Liquid HDPE Drum 10 Kg Solid HDPE Drum 10 Kg Solid HDPE Drum 25 Kg Solid Bottle 1 Kg Solid HDPE Drum 10 Kg Ethynyl aniline Liquid HDPE Drum 10 Kg Methyl-6-nitro-2H-indolesulfate Solid HDPE Drum 25 Kg Nitro Phthalic acid Solid Bottle 1 Kg (6-Amino-pyridine-3-yl)- piperazine-1-carboxylic acid tert-butyl ester 4,6,Dichloro-2-methyl pyrimidine 4,6-Dichloro-2- propylthiopyrimidine-5- amine Solid HDPE Drum 25 Kg Solid HDPE Drum 10 Kg Solid HDPE Drum 25 Kg Amino-1,2,4-triazole Solid HDPE Drum 10 Kg Aminobenzoic acid Solid Bottle 1 Kg Aminophenol Solid HDPE Drum 10 Kg Bromo-1,2- benzenediamine 4-Chloro-3-trifluoro methyl phenyl isocyanate Liquid HDPE Drum 10 Kg Solid HDPE Drum 10 Kg Dimethyl aminopyridine Solid Fibre 1 Kg Methyl-3-Nitrobenzoic acid 5-Amino-2-methyl benzene sulfonamide Solid HDPE Drum 10 Kg Solid HDPE Drum 5 Kg Fluoroisatin Solid Bottle 1 Kg 21
119 NATCO Pharma Ltd., Chemical Division-Chennai-EIA Report Chapter 2: Project Description Sl No Raw Material 5-Formyl-2-furyl boronic acid 6,7-Diacetoxy-quinazolin- 4(3H)-one Consum -ption Kg/day Max. Storage Kg (or) lit No. of days Physical status Storage Container Type of packing 2.34 KKB Envirocare Consultants Pvt. Ltd., Hyderbad Packets / drums / bags etc. (Nos.) Solid HDPE Drum 5 Kg Solid HDPE Drum 10 Kg Dimethoxyquinolin-4-ol Solid HDPE Drum 5 Kg Bromo-8-Cyclopentyl-5- methyl-2-methyl sulfinyl-8hpyrido [2,3-d] pyrimidin-7- one Solid HDPE Drum 20 Kg Activated Carbon Solid HDPE Bags 30 Kg Activated Copper Powder Solid Bottle 0.25 Kg Ammonium Acetate Solid HDPE Bags 10 Kg Ammonium Bicarbonate Solid HDPE Bags 50 Kg Ammonium Carbonate Solid HDPE Bags 50 Kg Anthranilic acid Solid HDPE Bags 50 Kg Azacytosine Solid HDPE Drum 1 Kg Benzoic acid Solid HDPE Drum 10 Kg Benzoyl Peroxide Liquid Bottle 1 Kg Benzyltriethylammonium chloride Solid HDPE Drum 1 Kg Bis (Pinacolato) diboron Solid HDPE Bags 30 Kg Boc-L-hydroxyproline Solid HDPE Bags 30 Kg Borontrifluoride etherate Gas Cylinder 10 Kg Carbon Solid HDPE Bags 30 Kg Catalyst Solid Bottle 0.25 Kg Corn Starch Solid HDPE Bags 30 Kg Cupric Bromide Solid Bottle 0.25 Kg D(-) Mandelic acid Solid HDPE Bags 30 Kg D,L-Amino glutarimide Hydrochloride Solid Bottle 1 Kg Daunorubicin Hydrochloride Solid Bottle 0.25 Kg Dextrose Solid HDPE Bags 50 Kg Di-BOC Solid Liner 50 Kg Dichlorobis(di-tert-butyl phoshine) palladium (II) Solid Bottle 1Kg Dicyclohexylcarbodiimide Solid HDPE Bags 25 Kg Diisopropylethylamine Liquid HDPE Drum 35 Kg Dimethylformamide di-tert- Butyl acetal Liquid HDPE Carboy 25 Kg 3
120 NATCO Pharma Ltd., Chemical Division-Chennai-EIA Report Chapter 2: Project Description Sl No. 83. Raw Material Dipotassium Hydrogen Orthophosphate Consum -ption Kg/day Max. Storage Kg (or) lit No. of days Physical status Storage Container Type of packing 2.35 KKB Envirocare Consultants Pvt. Ltd., Hyderbad Packets / drums / bags etc. (Nos.) Solid Bottle 0.5 Kg Di-tert-butyl dicarbonate Solid Liner 50 Kg DL-Methionine Solid HDPE Bags 25 Kg Ethanediol Liquid Bottle 1 Kg Ethyl 2-amino thiazole-5- carboxylate Solid Fibre 25 Kg Ethyl acetoacetate Liquid HDPE Drum 50 Kg Ethyl-3-[[2-[(4-cyanoanilino) methyl]-1-methylbenzimidazole -5-carbonyl] Solid HDPE Drum 25 Kg 5 (2-pyridyl) amino] propanoate 90. Ethyl-4-(5-(bis(2- hydroxyethyl) amino- 1methyl-1H-benzimidazol Solid HDPE Drum 25 Kg 2 2-yl)butanoate 91. Ethylene Oxide Liquid Bottle 1 Kg Ethylglyoxalate (50%) in Toluene Liquid HDPE Drum 25 Kg Formamide Liquid HDPE Drum 25 Kg Formic acid (85%) Liquid HDPE Drum 25 Kg Glycerol Liquid HDPE Drum 100 Kg Hydrazine Hydrate 90%) Liquid HDPE Drum 25 Kg Hydrobromic acid (48%) Liquid Bottle 2 Kg Hydrogen Chloride Liquid HDPE Drum 35 Kg Hydrose Solid Bottle 1 Kg Hydroxy benzotriazole Solid HDPE Drum 25 Kg Hyflo Solid HDPE Drum 25 Kg Iodine Solid HDPE Bags 25 Kg 4 Isopropyl Alcohol Liquid HDPE Drum 200 Kg 12 Hydrochloride (20%) 104. L(-) Malic acid Solid HDPE Drum 15 Kg 1 Lanthanum Chloride Liquid HDPE Drum 200 Kg 1 Heptahydrate 106. Lipase Solid Bottle 1 Kg Lithium Hydroxide Solid HDPE Drum 10 Kg Magnesium turnings Solid HDPE Bags 25 Kg Mannich salt Solid HDPE Bags 25 Kg Methanesulfonyl Chloride Liquid Bottle 1 Kg Methyl 2-bromomethyl-3- nitro-benzoate Solid HDPE Bags 25 Kg 1
121 NATCO Pharma Ltd., Chemical Division-Chennai-EIA Report Chapter 2: Project Description Sl No Raw Material Methyl Triphenylphos phonium bromide Methyl-4-(p-Amino phenyl)butyrate Hydrochloride Methyl-4,5-dimethoxy-2- Nitro-benzoate Consum -ption Kg/day Max. Storage Kg (or) lit No. of days Physical status Storage Container Type of packing 2.36 KKB Envirocare Consultants Pvt. Ltd., Hyderbad Packets / drums / bags etc. (Nos.) Solid HDPE Bags 25 Kg Solid Bottle 1 Kg Solid HDPE Bags 50 Kg Methylene Dichloride Liquid HDPE Drum 250 Kg Molecular sieves Solid HDPE Bags 1 Kg Monomethylamine (40%) Liquid HDPE Drum 200 Kg N,N-Diethylethylene diamine N,N-Dimethyl-4,4-diethoxy- 1-butane amine Liquid Bottle 5 Kg Liquid Bottle 5 Kg N,N-Dimethylaniline Liquid HDPE Drum 25 Kg Liquid Bottle 1 Kg Liquid HDPE Drum 10 Kg Liquid HDPE Drum 10 Kg N-Acetyl-L-cysteine Solid HDPE Bags 5 Kg N-Bromo Succinimide Solid Fibre 200 Kg n-hexylchloroformate Liquid HDPE Drum 10 Kg N,N-Dimethylpyridin-4- amine N,O-Bis(trimethylsilyl)- trifluoroacetamide N-2-Hydroxyethyl Piperazine N-Methoxycarbonyl-Lvaline Solid HDPE Bags 10 Kg N-Methylmorpholine Liquid HDPE Drum 25 Kg N-Methylpiperazine Liquid HDPE Drum 180 Kg Orthophosphoric acid Liquid Bottle 0.2 Kg o-toluidine Liquid HDPE Drum 50 Kg Oxalyl Chloride Liquid HDPE Drum 25 Kg Palladium Carbon Solid HDPE Drum 25 Kg Palladium Chloride Solid Bottle 0.2 Kg Paracetamol Solid HDPE Drum 25 Kg Pentafluoro-1-pentanethiol Liquid Bottle 0.2 Kg Phosphates Solid HDPE Bags 25 Kg Phosphorous Trichloride Liquid Bottle 0.2 Kg Potassium Acetate Solid HDPE Bags 25 Kg Potassium Bicarbonate (5%) Solid HDPE Bags 25 Kg Potassium Carbonate Solid HDPE Bags 50 Kg Potassium Hydroxide Solid HDPE Bags 50 Kg 22
122 NATCO Pharma Ltd., Chemical Division-Chennai-EIA Report Chapter 2: Project Description Sl No. Raw Material Consum -ption Kg/day Max. Storage Kg (or) lit No. of days Physical status Storage Container Type of packing 2.37 KKB Envirocare Consultants Pvt. Ltd., Hyderbad Packets / drums / bags etc. (Nos.) 143. Potassium Iodide Solid Bottle 0.5 Kg Potassium Propionate Solid HDPE Bags 25 Kg Potassium tert-butoxide Solid HDPE Bags 25 Kg Potassium tert-butoxide (11%) in Tetrahydro furan Liquid HDPE Drum 200 Kg PPG Liquid HDPE Drum 25 Kg p-toluenesulfonic acid Solid HDPE Bags 40 Kg p-toluenesulfonic acid Monohydrate Solid HDPE Bags 40 Kg p-toluic acid Solid HDPE Drum 100 Kg Pyrrolidine Liquid Bottle 0.5 Kg Racemic Cis & Trans Sertraline Liquid HDPE Drum 150 Kg Raney Nickel Solid HDPE Drum 20 Kg Resin Solid HDPE Bags 50 Kg Salicylamide Solid Bottle 1Kg Salicylic acid Solid Bottle 1Kg Silica gel Solid HDPE Bags 50 Kg Sodium Acetate Solid Bottle 1Kg Sodium Acetate Trihydrate Solid Bottle 1Kg Sodium Bicarbonate Solid HDPE Bags 50 Kg Sodium Borohydride Solid HDPE Bags 20 Kg Sodium Carbonate Solid HDPE Bags 50 Kg Sodium Chloride Solid HDPE Bags 50 Kg Sodium Formate Solid Bottle 1Kg Sodium Hydride (60%) in Paraffin Oil Liquid Bottle 1Kg Sodium Hydrosulfite Solid Bottle 1Kg Sodium Hydroxide Solid HDPE Bags 50 Kg Sodium Hypochlorite (5%) Solution Liquid HDPE Carboy 35 Kg Sodium Metabisulfite Solid Bottle 1Kg Sodium Nitrate Solid HDPE Bags 10 Kg Sodium Sulfite Solid HDPE Bags 25 Kg Sodium-t-butoxide Solid MS Drum 25 Kg Sodium-t-butoxide (30%) in Tetrahydrofuran Liquid HDPE Carboy 20 Kg Soyaflour Solid HDPE Bags 35 Kg 7
123 NATCO Pharma Ltd., Chemical Division-Chennai-EIA Report Chapter 2: Project Description Sl No Raw Material Stannous chloride monohydrate Consum -ption Kg/day Max. Storage Kg (or) lit No. of days Physical status Storage Container Type of packing Packets / drums / bags etc. (Nos.) Solid HDPE Drum 50 Kg Succinic acid Solid HDPE Drum 50 Kg Succinic Anhydride Solid HDPE Drum 50 Kg Sulfur Solid Bottle 0.2 Kg Tempo Solid HDPE Bags 2 Kg tert-butyl acetoacetate Liquid HDPE Drum 25 Kg tert-butyldimethylsilyl Chloride Tetrabutylammonium bromide Tetrakis(Triphenyl phosphine) Palladium TGB-(Tiagabine hydrochloride) Liquid Bottle 0.5 Kg Solid Bottle 1.0 Kg Solid HDPE Drum 2 Kg Solid HDPE Drum 50 Kg TGF Solid HDPE Drum 25 Kg Timethylsilyl triflate Liquid Bottle 2 Kg TRA(C31H31N3O9S) Solid Bottle 0.1 Kg Tributyl(1-ethoxyvinyl)tin Liquid HDPE Drum 25 Kg Trichloroisocyanuric acid Solid HDPE Bags 50 Kg Triethylamine Liquid HDPE Drum 25 Kg Triethylorthoformate Liquid HDPE Drum 180 Kg Triflic Anhydride Liquid Bottle 0.5 Kg Trifluoromethylsulfonyl Chloride Liquid HDPE Drum 25 Kg Trimethyl Orthoformate Liquid Bottle 0.5 Kg Trimethylsilyl triflate Liquid Bottle 1.0 Kg Triphosgene Solid Bottle 1.0 Kg Tripotassium Phosphate Solid HDPE Bags 50 Kg Tyramine Solid Bottle 1.0 Kg Valsartan Solid HDPE Drum 25 Kg Vinyl Acetate Liquid Bottle 0.2 Kg Zinc dust Solid HDPE Drum 25 Kg 4 Stored in Ware House Mode of Transportation: Road Handling method from storage to Production blocks: Trolley for drums/ pipelines for tank farm 2.38 KKB Envirocare Consultants Pvt. Ltd., Hyderbad
124 NATCO Pharma Ltd., Chemical Division-Chennai-EIA Report Chapter 2: Project Description Storage and Transportation of Raw Materials and Products All the raw materials will be first received by the stores department and samples of raw materials will be sent to quality control (QC) laboratory wherein the quality of raw material will be tested. Only after confirmation of quality by the QC lab, the raw material will be transferred / unloaded at the respective ware house/storage area in the factory with proper labeling. The raw material in general will be received in bags/ cartons / carboys/ drums / cylinders / bottles as well as through tankers. Material received from tanker will be stored in above ground tanks. All the storage tanks of hazardous flammable substances will be located within premises in separate approved storage area i.e. Tank farm area. Most of the raw materials will be Indigenous. All the Bulk liquid raw materials will be stored in storage tanks at separate storage area in tank farm area. The storage area for hazardous chemicals will be located within the boundary wall with a constant watch by security round the clock. Proper enclosures will be provided for all storage tanks. All necessary firefighting system and safety arrangements will be provided near the storage area to combat any emergency accident. The liquid chemicals will be transported through pipes via rack to day tank of production area from storage tanks. Other chemicals and materials required with quantities will be stored in warehouses/storage areas. Warehouse will be containing store office, raw material store, dispensing area, finished product store, etc. Personnel protective equipment s like hand gloves, safety shoes, goggles, helmet, clothing, etc., wherever required, will be provided to the persons. All motors and electrical connections will be flame proof. Raw materials transported from the storage area to the production plant by hydraulic trolley/fork lift/trolley / closed pipe as applicable. Modes of transportation of all raw materials to the plant site and finished products from the plant site are by road. Final products will be sent through road/ air/ sea route as per requirement. 2.8 Water Requirement The total water requirement will be about 576 KLD of which fresh water requirement is 303 KLD. Treated effluent of about 182 KLD will be reused in cooling tower make up and 91 KLD is recovered as steam condensate from boiler thereby fresh water consumption will be reduced. The balance water requirement will be met from Metro water supply and from ground water private tankers supply (Annexure-XVIII). The proposal is to minimize the effect on the level of water table by working out reuse of the treated effluent wherever it is possible thereby reducing the fresh water requirement. The proposed wastewater generation will be 195 KLD KKB Envirocare Consultants Pvt. Ltd., Hyderbad
125 NATCO Pharma Ltd., Chemical Division-Chennai-EIA Report Chapter 2: Project Description 2.9 Land The break-up of land use of the proposed project site is presented in Table 2.8. Total land area of about Ha is existing unit and in possession of project proponent. Total Greenbelt area is 3.51 Ha (33.2% of Ha). In addition industry has given 1.05 Ha (10%) for Open Space Reservation (OSR) land for Greenbelt. Industry also developed the lawn in an area of 0.39 Ha (3.7% of Ha). Hence, total about 4.96 Ha (47%) of the Ha land area has been developed as greenbelt & lawn. The nearest habitations are Andarkuppam km (W), Kanniyammanpettai km (W) & Manali town-1.6 km (S) Power The existing power (Contract Power Demand) is 1175 KVA with additional power of 1175 KVA will be required totaling to 2350 KVA. It will be met from the nearby TNEB grid which is distributed through the substation within plant premises. Furnace oil and Diesel will be procured from the distribution sources closer to the project site. DG sets are used only as standby during power failure. NATCO has installed 2100 KW Wind Electric Generator (WEG HTSC.No.4537), Suzlon make at Tirumangalakurichi village in Kovilpatti taluk, Tuticorin district and the same has commissioned on for captive use purpose to Natco Pharma Limited, Chemical Division, Chennai. Tamil Nadu Electricity board has accepted our proposal and an agreement has been signed with TANGEDCO (Superintending Engineer-Tirunelveli Electricity distribution circle) for the wheeling and banking of energy generated through our commissioned wind generator and also through board transmission/ Distribution as per the licence No. CE/NCES/SE/Solar/EE/WPP/AEE2/F. M/s. Natco Pharma Limited WEG No.67(T)/R.951/D.653/ 17, dt The copy TNEB communication letter attached as Annexure-XIX. The company is getting benefited of power supply from May 2017 onwards Fuel About 400 lit/hr of furnace oil will be used in the proposed 6 TPH oil fired boiler. Existing 3 TPH furnace oil fired boiler will be standby. Diesel of about 630 lit/hr will be used in the proposed DG sets of 2x10¹⁰ KVA & 100 KVA, in addition to existing 1010 KVA DG set. Existing 300 KVA DG set will be removed. DG sets are used as standby during power failure. Furnace oil and Diesel will be procured from the distribution sources closer to the project site Man Power The expansion facility will generate direct and indirect employment to scores of local people. Existing 250 employees (Direct- 206 nos. and Indirect- 4 nos.) with additional KKB Envirocare Consultants Pvt. Ltd., Hyderbad
126 NATCO Pharma Ltd., Chemical Division-Chennai-EIA Report Chapter 2: Project Description employees (Direct-144 nos.; Indirect-56 nos.) will be employed. Total 450 employees (Direct 350 nos and Indirect 100 nos) Plant and Machinery The plant and machinery for API s & its intermediates project consists of glass lined and stainless steel reactors, centrifuges, dryers, flame proof motors, pumps and storage tanks. The utility system consists of furnace oil fired boiler, cooling tower, DG generators, brine chiller, water chiller, vapour absorption system, water purification systems etc. In addition to this some of the pollution control equipment such as scrubbers, solvent recovery system, steam strippers, MEE, ATFD, RO systems, Incinerator etc., All the equipment is indigenously available. List of existing, additional and total plant and machinery is presented in Annexure-XX Sources of Environmental Pollution Active Pharmaceutical Ingredients (APIs) manufacturing process generates gaseous emissions, liquid and solid wastes. Maximum Pollution load from various combinations are presented in Table The management of these wastes will be handled very sensitively and by adopting proper segregation techniques. The liquid wastes will be segregated at source for further treatment in-house-etp with Zero Liquid Discharge (ZLD) system. In view of this there is a possibility of reusing the treated wastewater for various industrial utility usages like in cooling towers Air Environment Gaseous emission from fuel burning, which consists of common pollutants like SO 2, NO 2 and PM, would be discharged into atmosphere through 40 m height stack. All reactor vessels are protected by primary and secondary condenser with circulation of cooling and chilled water in order to prevent emission of volatile solvent. Reactors also connected to multi-stage scrubbers to control the process emissions during the reaction. The hazardous chemicals and volatile organic solvents are carefully handled in a closed system, thereby preventing any discharge of these chemicals into the air. All internal roads are BT / CC to reduce the fugitive emissions Green belt has been developed at the plant boundary as dust preventive barrier KKB Envirocare Consultants Pvt. Ltd., Hyderbad
127 NATCO Pharma Ltd., Chemical Division-Chennai-EIA Report Chapter 2: Project Description Table 2.13: Maximum Pollution Load For The Proposed Products On Various Combinations Product PRODUCTION Tons / Month Per day (Kg) Water Input Per Day Total Water in Effluent Per Day EFFLUENT DETAILS SOLID WASTE Emissions Total Effluent Per Day (Lit) Practical TDS TDS COD COD Org. res./ Semi solid Inorganics EVA salt Inorganics + EVA. Salts Spent Carbon Total S.W. Process (Lit) (Lit) mg/l (Kgs) (mg/l) (Kgs) (Kg) (Kg) (Kg) (Kg) (Kg) (Kg) (Kg) (Kg) Solvent Loss Proposed Products (Maximum 16 Products at a point of time) Combination Combination Combination Combination Combination Combination Combination Combination Combination Combination Combination Combination KKB Envirocare Consultants Pvt. Ltd., Hyderbad
128 NATCO Pharma Ltd., Chemical Division-Chennai-EIA Report Chapter 2: Project Description Combinations (Table 2.13 Contd ) Combination-1: Erlotinib Hydrochloride + Gefitinib + Imatinib Mesylate + Lapatinib Ditosylate Monohydrate + Nilotinib Hydrochloride Hydrate + Sorafenib Tosylate + Dabigatran Etexilate + Lansoprazole + Lanthanum Carbonate Dihydrate + Ledipasvir + Ondansetron Hydrochloride Dihydrate + Pirfenidone + Sacubitril + Sertraline Hydrochloride + Sumatriptan Succinate + Ticagrelor Combination-2: Epothilone B + Sirolimus + Dasatinib Monohydrate + Gefitinib + Imatinib Mesylate + Lapatinib Ditosylate Monohydrate + Pazopanib Hydrochloride + Sunitinib Malate + Lansoprazole + Lanthanum Carbonate Dihydrate + Ledipasvir + Rizatriptan Benzoate + Sacubitril + Sertraline Hydrochloride + Sumatriptan Succinate + Ticagrelor Combination-3: Epothilone B + Sirolimus + Cabozantinib-S-Malate + Dasatinib Monohydrate + Gefitinib + Imatinib Mesylate + Lapatinib Ditosylate Monohydrate + Pazopanib Hydrochloride + Sunitinib Malate + Lansoprazole + Lanthanum Carbonate Dihydrate + Ledipasvir + Sacubitril + Sertraline Hydrochloride + Sumatriptan Succinate + Ticagrelor Combination-4: Sirolimus + Cabozantinib-S-Malate + Dasatinib Monohydrate + Gefitinib + Imatinib Mesylate + Lapatinib Ditosylate Monohydrate + Pazopanib Hydrochloride + Sunitinib Malate + Lanthanum Carbonate Dihydrate + Ledipasvir + Pirfenidone + Rizatriptan Benzoate + Sacubitril + Sertraline Hydrochloride + Sumatriptan Succinate + Ticagrelor Combination-5: Dasatinib Monohydrate + Gefitinib + Imatinib Mesylate + Lapatinib Ditosylate Monohydrate + Nilotinib Hydrochloride Hydrate + Pazopanib Hydrochloride + Sorafenib Tosylate + Sunitinib Malate + Lansoprazole + Ledipasvir + Rizatriptan Benzoate + Ondansetron Hydrochloride Dihydrate + Sacubitril + Sertraline Hydrochloride + Sumatriptan Succinate + Ticagrelor Combination-6: Epothilone B + Sirolimus + Cabozantinib-S-Malate + Dasatinib Monohydrate + Gefitinib + Imatinib Mesylate + Lapatinib Ditosylate Monohydrate + Pazopanib Hydrochloride + Sunitinib Malate + Lansoprazole + Lanthanum Carbonate Dihydrate + Ledipasvir + Sacubitril + Sertraline Hydrochloride + Sumatriptan Succinate + Ticagrelor Combination-7: Decitabine + Cabozantinib-S-Malate + Dasatinib Monohydrate + Gefitinib + Imatinib Mesylate + Lapatinib Ditosylate Monohydrate + Nilotinib Hydrochloride Hydrate + Palbociclib + Sorafenib Tosylate + Sunitinib Malate + Ledipasvir + Rizatriptan Benzoate + Sacubitril + Sertraline Hydrochloride + Sumatriptan Succinate + Ticagrelor Combination-8: Sirolimus + Cabozantinib-S-Malate + Dasatinib Monohydrate + Gefitinib + Imatinib Mesylate + Lapatinib Ditosylate Monohydrate + Pazopanib Hydrochloride + Sunitinib Malate + Dabigatran Etexilate + Ledipasvir + Pirfenidone + Rizatriptan Benzoate + Sacubitril + Sertraline Hydrochloride + Sumatriptan Succinate + Ticagrelor Combination-9: Lenalidomide + Pomalidomide + Sirolimus + Carmustine + Erlotinib Hydrochloride + Gefitinib + Imatinib Mesylate + Lapatinib Ditosylate Monohydrate + Nilotinib Hydrochloride Hydrate + Sorafenib Tosylate + Ondansetron Hydrochloride Dihydrate + Pirfenidone + Rizatriptan Benzoate + Sertraline Hydrochloride + Sumatriptan Succinate + Ticagrelor Combination-10: Sirolimus + Cabozantinib-S-Malate + Dasatinib Monohydrate + Gefitinib + Imatinib Mesylate + Lapatinib Ditosylate Monohydrate + Palbociclib + Pazopanib Hydrochloride + Sorafenib Tosylate + Sunitinib Malate + Ledipasvir + Rizatriptan Benzoate + Sacubitril + Sertraline Hydrochloride + Sumatriptan Succinate + Ticagrelor Combination-11: Dasatinib Monohydrate + Erlotinib Hydrochloride + Gefitinib + Imatinib Mesylate + Lapatinib Ditosylate Monohydrate + Nilotinib Hydrochloride Hydrate + Pazopanib Hydrochloride + Sorafenib Tosylate + Sunitinib Malate + Dabigatran Etexilate + Lansoprazole + Lanthanum Carbonate Dihydrate + Ledipasvir + Pirfenidone + Sacubitril + Sumatriptan Succinate Combination-12: Cabozantinib-S-Malate+ Dasatinib Monohydrate + Erlotinib Hydrochloride + Gefitinib + Imatinib Mesylate + Lapatinib Ditosylate Monohydrate + Palbociclib + Pazopanib Hydrochloride + Sunitinib Malate + Ledipasvir + Ondansetron Hydrochloride Dihydrate + Rizatriptan Benzoate + Sacubitril + Sertraline Hydrochloride + Sumatriptan Succinate + Ticagrelor 2.43 KKB Envirocare Consultants Pvt. Ltd., Hyderbad
129 NATCO Pharma Ltd., Chemical Division-Chennai-EIA Report Chapter 2: Project Description Stack Emissions Boilers, Incinerator and DG sets are the three main sources contribute to emissions from the plant. Industry is proposing furnace oil fired boiler of 6 TPH in addition to the existing 3 TPH furnace oil fired boiler. The existing 3 TPH furnace oil boiler will be standby. About 400 lph Furnace oil will be used for steam generation from 6 TPH boiler, Sulfur dioxide (SO 2 ) and Oxides of Nitrogen (NOx) will be the major pollutants. Existing stack height of 40 m is meeting the CPCB guidelines of 39.6 m stack height considering the 4% sulfur content in the furnace oil. The NOx emissions from the boilers will be controlled by controlling combustion measures, which will be approached by way of low NOx burners or by air stagging in boiler. Diesel about 630 lph will be used at full operation load in the DG sets. Proposed D.G sets are of 2x10¹⁰ KVA & 100 KVA, in addition to existing 1010 KVA DG set. Existing 300 KVA DG set will be removed. DG sets will be used as standby during power failure. Industrial waste of about 100 kg/hr will be used in the existing in-house Incinerator. Scrubber was connected to the incinerator to reduce the flue gas emission concentration and scrubber vent is connected to stack of 40 m height for better dispersion Process Emissions Manufacturing of APIs and its intermediates will result in gaseous emissions. The product wise process emissions are estimated and presented in Table Proposed gaseous emissions will be scrubbed in two stages with water and caustic solution based on the characteristics of gases. Proposed additional 4 scrubbers for the expansion project in addition to the existing 8 scrubbers to scrub the additional process emissions (Total 12 scrubbers). A stack of suitable height (above roof level) will be provided to each proposed scrubber. Table 2.14: Product wise Process Emissions Proposed S. Process Quantity Product No. Emission (Kg/day) 1 Bendamustine Hydrochloride HCl 0.98 SO Bortezomib CO H Decitabine - Nil 4 Everolimus H Temsirolimus CO Trabectedin CO Busulfan - Nil 8 Lenalidomide H Nelarabine - Nil 10 Thiotepa HCl CO Azacitidine - Nil 2.44 KKB Envirocare Consultants Pvt. Ltd., Hyderbad
130 NATCO Pharma Ltd., Chemical Division-Chennai-EIA Report Chapter 2: Project Description S. Process Quantity Product No. Emission (Kg/day) 12 Chlorambucil - Nil 13 Doxorubicin Hydrochloride Methyl Bromide Epothilone B - Nil 15 Fulvestrant H Pomalidomide H Sirolimus - Nil 18 Carmustine HCl 0.13 SO Melphalan HCl Cabozantinib-S-Malate - Nil 21 Dasatinib Monohydrate CO HCl 3.87 SO Erlotinib Hydrochloride CO H Gefitinib HCl SO H CO Imatinib Mesylate CO HCl SO Dimethylamine 4.2 H Lapatinib Ditosylate Monohydrate CO O SO HCl 2.31 H Nilotinib Hydrochloride Hydrate SO HCl 1 H Dimethylamine Palbociclib H Chloroethane 0.9 CO HCl Pazopanib Hydrochloride H CO HCl Sorafenib Tosylate CO SO H HCl Sunitinib Malate N H CO Dabigatran Etexilate CO Deferasirox HCl 1.35 SO KKB Envirocare Consultants Pvt. Ltd., Hyderbad
131 NATCO Pharma Ltd., Chemical Division-Chennai-EIA Report Chapter 2: Project Description S. Process Quantity Product No. Emission (Kg/day) 33 Lansoprazole SO HCl 2.02 O Lanthanum Carbonate Dihydrate CO Ledipasvir HCl 7.16 CO H Ondansetron Hydrochloride Dihydrate CO Pirfenidone N CO Rizatriptan Benzoate O H Sacubitril SO CO Sertraline Hydrochloride - Nil 41 Sumatriptan Succinate HCl Cl H CO NH Ticagrelor CO Fugitive Emissions from Solvents Handling and their Recovery Various types of solvents are used in the API s & its intermediates manufacturing process. Solvent balance is presented in Table The product wise various solvents input, solvent in effluent, organic waste, solvent loss and recovery is presented in Table Spent solvent is a leading source of Hazardous Waste. By reusing the recovered solvent it will reduce cost of purchasing solvent as well as solvent losses. Table 2.15: Solvent balance Solvent in Solvent Recovery Recovered Spent Solvent Organic Handling from solvents for Input Effluent In product residue loss reactor for in-house reuse recovery KLD 0.2 KLD 0.06 KLD 0.85 KLD 23 KLD KLD 0.06 KLD 100% 0.43 % 0.13% 1.84% 50 % % 0.13 % 97.6 % Note: To maximize the solvent recovery efficiency, solvent in effluent also recovered through steam stripper, Hence total solvent recovery will be 98.03% 2.46 KKB Envirocare Consultants Pvt. Ltd., Hyderbad
132 NATCO Pharma Ltd., Chemical Division-Chennai-EIA Report Chapter 2: Project Description Table 2.16: Product Wise Solvent Usage, Losses and Recovery Proposed SI. No. Product Solvent Input Solvent in Effluent Solvent in Org. waste Solvent loss Solvent Recovery (Kg) 1 Bendamustine Hydrochloride Bortezomib Decitabine Everolimus Temsirolimus Trabectedin Busulfan Lenalidomide Nelarabine Thiotepa Azacitidine Chlorambucil Doxorubicin Hydrochloride Epothilone B Fulvestrant Pomalidomide Sirolimus Carmustine Melphalan Cabozantinib-S-Malate Dasatinib Monohydrate Erlotinib Hydrochloride Gefitinib ImatinibMesylate LapatinibDitosylate Monohydrate Nilotinib Hydrochloride Hydrate Palbociclib Pazopanib Hydrochloride SorafenibTosylate Sunitinib Malate DabigatranEtexilate Deferasirox Lansoprazole Lanthanum Carbonate Dihydrate Ledipasvir Ondansetron Hydrochloride Dihydrate Pirfenidone Rizatriptan Benzoate Sacubitril Sertraline Hydrochloride Sumatriptan Succinate Ticagrelor The solvents will be stored in drums and bulk quantities will be stored in existing and proposed above ground storage tanks of suitable capacities (8 nos of 28 KL). Solvents are handled in closed conditions thereby reducing the losses in the form of evaporation. The industry will take measures for reduction of fugitive emissions and further reduction will be achieved by providing 2.47 KKB Envirocare Consultants Pvt. Ltd., Hyderbad
133 NATCO Pharma Ltd., Chemical Division-Chennai-EIA Report Chapter 2: Project Description vent condensers to the tanks. Chilled brine circulation will be carried out to condensate the solvent vapor and to the receivers of the solvent vapors which ensures the recovery of 95% and also controlled by closed operations and handling methods. Good ventilation will be provided to reduce the workroom concentrations. The reactor generating solvent vapors will be connected to double condensers with receivers. Solvent vapours from the Centrifuge and Catch pots will be connected to vent condensers. Vent condensers will be provided to the solvent receiver tank and height of the vent is above production block roof level and the diameter is 20 mm. The solvent loss is depending on the boiling point of the solvent. Solvent management for effective recovery: Reactor will be connected to double condenser system using cooling and chilled brine circulation. Reactor and solvent handling pump will have mechanical seals to prevent leakage. Condensers will be provided with sufficient Heat Transfer Area (HTA) and residence time so as to achieve maximum recovery Solvents will be stored in a separate space specified with all safety measures. Proper earthing will be provided in all the electrical equipment wherever solvent handling is done. Low boiling s solvent storage tanks are insulated Entire plant where solvents are used, the equipment s / pumps / fittings will be of flame proof. The solvent storage tanks will be provided with nitrogen blanketing system and breather valve to prevent losses Wastewater Generation and its Treatment Product wise water input & effluent generation and its characteristics are estimated from material balance in-terms of TDS, Organic compounds in-terms of COD and presented in Table 2.17(a). Product Wise segregation of effluent based on TDS & COD concentrations is presented in Table 2.17(b). The fresh water requirement and wastewater generation is 303 KLD and 195 KLD respectively. The sources of wastewater generation are from the process, floor & reactor washings, utilities, Q.C, R&D, scrubber and plant domestic waste. Total generation of wastewater after expansion will be 195 KLD, which will be segregated into Stream -1 ( High TDS/COD > mg/l from process); Stream-2 (TDS/COD < mg/l from process, washings, scrubber, QC, R&D and Domestic); Stream-3 (Low TDS/COD < 5000 mg/l from utilities) wastewater are collected for treatment. This individual effluent will be pumped to the RCC lined tanks for storage and neutralization then sent to ETP-ZLD. Existing treatment system will be enhanced to meet the proposed effluent quantities. All the additional tanks will be constructed / installed above the ground with water proof lining. This 2.48 KKB Envirocare Consultants Pvt. Ltd., Hyderbad
134 NATCO Pharma Ltd., Chemical Division-Chennai-EIA Report Chapter 2: Project Description effluent will be pumped to the RCC lined tanks for storage and neutralization then sent to upgraded ETP-ZLD of 200 KLD capacity within the premises. Table 2.17 (a): Product Wise Water input & Wastewater Quantity and Characteristics Proposed Product Water in Volatile Waste Dissolved Waste COD Wastewater Compounds water Solids water (kg/day) (lt/day) (lt/day) (lt/day) (kg/day) (kg/day) Bendamustine Hydrochloride Bortezomib Decitabine Everolimus Temsirolimus Trabectedin Busulfan Lenalidomide Nelarabine Thiotepa Azacitidine Chlorambucil Doxorubicin Hydrochloride Epothilone B Fulvestrant Pomalidomide Sirolimus Carmustine Melphalan Cabozantinib-S-Malate Dasatinib Monohydrate Erlotinib Hydrochloride Gefitinib Imatinib Mesylate Lapatinib Ditosylate Monohydrate Nilotinib Hydrochloride Hydrate Palbociclib Pazopanib Hydrochloride Sorafenib Tosylate Sunitinib Malate Dabigatran Etexilate Deferasirox Lansoprazole Lanthanum Carbonate Dihydrate Ledipasvir Ondansetron Hydrochloride Dihydrate KKB Envirocare Consultants Pvt. Ltd., Hyderbad
135 NATCO Pharma Ltd., Chemical Division-Chennai-EIA Report Chapter 2: Project Description Product Water in Wastewater (lt/day) Volatile Compounds (lt/day) Waste water (lt/day) Dissolved Solids (kg/day) COD (kg/day) Waste water (kg/day) Pirfenidone Rizatriptan Benzoate Sacubitril Sertraline Hydrochloride Sumatriptan Succinate Ticagrelor Table 2.17 (b): Product Wise segregation of effluent based on TDS & COD concentrations S. NO Product Total Effluent Per Day (Lit) TDS (mg/l) COD (mg/l) 1 Bendamustine Hydrochloride Bortezomib Decitabine Everolimus Temsirolimus Trabectedin Busulfan Lenalidomide Nelarabine Thiotepa Azacitidine Chlorambucil Doxorubicin Hydrochloride Epothilone B (LTDS) Fulvestrant Pomalidomide Sirolimus (HTDS) Carmustine Melphalan Cabozantinib-S-Malate (HTDS) Dasatinib Monohydrate (HTDS) Erlotinib Hydrochloride Gefitinib (HTDS) Imatinib Mesylate (HTDS) Lapatinib Ditosylate Monohydrate (HTDS) Nilotinib Hydrochloride Hydrate Palbociclib Pazopanib Hydrochloride (HTDS) Sorafenib Tosylate Sunitinib Malate (HTDS) Dabigatran Etexilate Deferasirox Lansoprazole (LTDS) Lanthanum Carbonate Dihydrate (LTDS) Ledipasvir (HTDS) Ondansetron Hydrochloride Dihydrate Pirfenidone KKB Envirocare Consultants Pvt. Ltd., Hyderbad
136 NATCO Pharma Ltd., Chemical Division-Chennai-EIA Report Chapter 2: Project Description S. NO Product Total Effluent Per Day (Lit) TDS (mg/l) COD (mg/l) 38 Rizatriptan Benzoate Sacubitril (HTDS) Sertraline Hydrochloride (HTDS) Sumatriptan Succinate (HTDS) Ticagrelor (HTDS) Total Maximum on various combinations HTDS LTDS Handling, Storage and Detoxification of Empty Raw material Containers / Bags Detoxification and disposal of empty containers / empty polythene bags in the production blocks: Washed with sufficient quantity of water by wearing the PPEs and repeat the operation till container / bag is clean and ph is neutral. Cleaned container / bag will be sent to storage area for disposal / Recycling. Collect the spilled / contaminated water washings and sent to ETP for treatment Solid / Hazardous Wastes Generation The product wise Solid / Hazardous waste and other waste generated are estimated, handling and disposal methods from the various stages of APIs & its intermediates manufacturing plant is presented in Table Hazardous / Solid waste will be segregated, detoxified and collected in the HDPE drums / bags and will be stored in the covered and raised platform with Leachate collection system. Spillages such as wastewater / solid wastes / raw materials are possible and the risk of this would be limited to within the premises of the manufacturing facility. A precautionary measure like spillage control management is practiced in the industry KKB Envirocare Consultants Pvt. Ltd., Hyderbad
137 NATCO Pharma Ltd., Chemical Division-Chennai-EIA Report Chapter 2: Project Description Table 2.18: Product wise Hazardous Waste Generation - Proposed Evaporation S. Organic Inorganic Spent Carbon Product Salts No. (kg/day) 1 Bendamustine Hydrochloride Bortezomib Decitabine Everolimus Temsirolimus Trabectedin Busulfan Lenalidomide Nelarabine Thiotepa Azacitidine Chlorambucil Doxorubicin Hydrochloride Epothilone B Fulvestrant Pomalidomide Sirolimus Carmustine Melphalan Cabozantinib-S-Malate Dasatinib Monohydrate Erlotinib Hydrochloride Gefitinib Imatinib Mesylate Lapatinib Ditosylate Monohydrate Nilotinib Hydrochloride Hydrate Palbociclib Pazopanib Hydrochloride Sorafenib Tosylate Sunitinib Malate Dabigatran Etexilate Deferasirox Lansoprazole Lanthanum Carbonate Dihydrate Ledipasvir Ondansetron Hydrochloride Dihydrate Pirfenidone Rizatriptan Benzoate Sacubitril Sertraline Hydrochloride Sumatriptan Succinate Ticagrelor Solid / Hazardous waste mainly segregated into process organic residues, Inorganic salts, spent carbon etc., these wastes are hazardous in nature as they emanate from the chemical reactions or un-reacted chemical wastes. The organic residues & spent carbon can be disposed off to in-house Incinerator / TSDF (or) Cement plants for use as alternate fuel either in 2.52 KKB Envirocare Consultants Pvt. Ltd., Hyderbad
138 NATCO Pharma Ltd., Chemical Division-Chennai-EIA Report Chapter 2: Project Description the solid or liquid form. Inorganic salts are to be sent for landfill at TNWML TSDF. Solid waste will be segregated, stored and disposed. In addition to the above, effluent treatment plant sludge will be generated. Hazardous waste like organic residue, spent carbon and MEE evaporation salts including ETP sludge stored in HDPE drums/bags will be sent for incineration / authorized cement plants for co-processing and for secured land filling respectively based on their calorific value Noise Environment Compressors, Boilers and DG sets will be the major noise generating units in the plant. Out of these, the generator will be functioning at the time of power failure only. The noise levels of the DG sets will be well within the limits as these will be installed with acoustic enclosures. However the workers in this area will always be provided with ear muffs. All the equipment in the plant would be designed to have a total noise level not exceeding db(a) as per the requirement of OSHA (Occupational Safety and Health Administration) standards. Proposed expansion project site is located in Manali Industrial Area, which is about 0.25 km to the nearest habitation (Andarkuppam village); no impact of noise will be felt at this village. As per factory act, under the general health checkup scheme, the workers will be examined for any Noise Induced Hearing Loss (NIHL) by a trained ENT Doctor. The noise levels in the work place environment will be monitored periodically and action will be taken in the form of regular maintenance schedule to reduce noise and vibration in generating sources. Noise Attenuation targeted & achieved with 3-4 m greenbelt of Pure Species Monoculture. Periodical monitoring is being carried out on regular basis. DG sets are installed with acoustic enclosures. Noise generating unit like boiler etc. A Regular maintenance is practiced for plant machinery and equipment s which helps to avert potential noise problems. Future enhancement and installation of the plant machinery will be done after due consideration to design noise levels and noise mitigation measures. The green belt developed helps in reducing noise levels in the premises as a result of attenuation of noise generated due to plant operations and transportation. There are no major sources of industrial noise; minor noise is being generated from the industrial operations which are being controlled by proper maintenance and technology. Proper mitigation measures are taken for the reduction of noise levels i.e. acoustic enclosures and the workers are provided with personal protective equipment s. Proper maintenance, padding, oiling and greasing of machines at regular intervals is done to reduce generation of noise KKB Envirocare Consultants Pvt. Ltd., Hyderbad
139 NATCO Pharma Ltd., Chemical Division-Chennai-EIA Report Chapter 2: Project Description Green Belt Development The main objective of the green belt is to provide a barrier between the source of pollution and the surrounding areas. The green belt helps to capture the fugitive emissions and to attenuate the noise generated apart from improving the aesthetics. Development of green belt and other forms of greenery will also prevent soil erosion and washing away of topsoil besides helping in stabilizing the functional ecosystem and further to make the climate more conducive and to restore water balance. Green belt forms a surface capable of absorbing air pollutants and forming sinks for pollutants. Apart from functioning as a pollutant sink, green belts provide other benefits like: Green belt helps in achieving biodiversity by providing possible habitats for birds and animal, thus recreating hospitable nature in an otherwise drab urban industrial scene. Green belts increase the aesthetic value of the site. Industry is already developed Greenbelt in an area of Total Greenbelt area is 3.51 Ha (33.2% of Ha). In addition industry has given 1.05 Ha (10%) for Open Space Reservation (OSR) land for Greenbelt. Industry also developed the lawn in an area of 0.39 Ha (3.7% of Ha). Local species are planted as per the guidelines in consultation with the local horticulturist Resources Optimization / Recycling and Reuse All efforts will be made by the industry to carryout R&D on the wastes to recycle / reuse wherever possible. However, R&D is a continuous process, where improvements in the processes adopted by the industry, waste minimization etc. will be worked out as the project progresses. Following are some of the recycle options proposed by the industry. Industry uses Zero liquid discharge plant to reuse all treated effluents as makeup water for utilities like Cooling Tower. This will reduce the fresh water consumption. All solvents are recovered to the extent possible and reused in the process / sold to recyclers. Organic residue and spent carbon will be sent to Tamil Nadu Waste Management Limited. Waste / Used oil will be sent to Authorized Waste / Used oil Reprocessing units. Waste Lead acid batteries will be sent back to suppliers on buy back basis. Conservation of energy by implementing energy conservation methods/systems. Recycling and reuse of solvents will also be planned properly thereby implementing the clean manufacturing techniques. There is potential for implementation of clean technologies, recovery and reuse techniques in this proposed APIs unit which will be explored and implemented after R&D process KKB Envirocare Consultants Pvt. Ltd., Hyderbad
140 NATCO Pharma Ltd., Chemical Division-Chennai-EIA Report Chapter 2: Project Description 2.16 Summary of Project after Expansion Summary of salient features on Permitted, Additional and Total after expansion details are presented below: Description Units Permitted / Present Additional Total after expansion Products Nos (16 products at a time) Capacity TPA Land Hectares Investment Crores Employees Nos Water requirement KLD (Fresh water) Waste water generation KLD Process effluent only KLD 43.4 (-12.4) 31 Process waste (Organic, Inorganic, Spent carbon) TPD ( ) Process Emissions Kg/day 710 (-240) 470 Boilers (Furnace oil fired) TPH 3 6 DG Sets KVA 1010 & x 2 nos. & (3 TPH boiler will be standby) 1010 x 3 nos., 100 (permitted 300 KVA DG set will be dismantled) Incinerator Kg/hr Power KVA Capital cost for environmental pollution Crores control measures Recurring cost (O&M) per annum Crores KKB Envirocare Consultants Pvt. Ltd., Hyderbad
141 Chapter 3 Description of Environment
142 NATCO Pharma Ltd., Chemical Divn.-Chennai-EIA Report Chapter 3: Description of Environment Chapter 3 Description of Environment 3.0 Introduction The baseline environmental quality of a present site for proposed expansion serves for identification of significant environmental concerns / impacts corresponding to study area. The baseline environmental quality assessed through field studies within the impact zone for various individual components of environment, viz. Air, Noise, Water, Land, Biological and Socio-economic. The present Environmental Impact Assessment (EIA) study comprises preexpansion environmental quality monitored for 10 km radial distance around the existing land of Ha for manufacture of TPA APIs and its intermediates with R&D products. The field surveys of all environmental components accomplished during summer season (March - May 2017) for assessment of baseline environmental status. Baseline data has been generated by M/s KKB micro testing labs Pvt. Ltd., Hyderabad, a NABL accredited laboratory by following the approved procedures of the NABL and the Central Pollution Control Board guidelines. 3.1 Climatology and Meteorology The meteorological data helps for appropriate interpretation of the baseline status of the study area as well as for input into prediction model to evaluate air quality dispersion. Chronological data on meteorological parameters also plays an important role in identifying the general meteorological regime of the region Methodology The study of micrometeorological conditions of a particular region is of utmost importance to understand the variations in ambient air quality status in that region. The prevailing micrometeorology near the existing plant site plays a crucial role in process emissions transport and dispersion of air pollutants arising due to the existing and proposed activities. The persistence of the predominant wind direction and wind speed at the project 3.1 KKB Envirocare Consultants Pvt. Ltd., Hyderabad
143 NATCO Pharma Ltd., Chemical Divn.-Chennai-EIA Report Chapter 3: Description of Environment site will decide the direction and extent of the air pollution impact zone. The principal variables, which affect the micrometeorology, are horizontal transport and dispersion (average wind speed and directions), convective transport and vertical mixing (atmospheric stability) and topography of the area. The factors like ambient temperature, humidity, rainfall and atmospheric pressure etc., known as secondary meteorological parameters as these factors control the dispersion of the pollutants indirectly by affecting the primary factors. Hourly recorded wind speed and wind direction during study period used for computing the relative percentage frequencies of wind occurrences in various directions. The methodology adopted for monitoring surface observations is as per the standard norms laid down by Bureau of Indian Standards (IS: 8829) and India Meteorological Department (IMD). A meteorological station was installed in the plant site at about 10 m above the ground level. Meticulous attention was taken while selecting the Meteorological station and also care was taken to see that the location is free flow of winds from all directions Meteorological Data Recorded at Proposed Expansion Project Site Meteorological study exerts a critical influence on Air Quality, as it is an important factor in governing the Ambient Air Quality. The meteorological data recorded during study period is used for interpretation of the baseline information as well as input for air quality simulation model. Meteorological data was collected for summer season (March- May 2017). Details of the meteorological data for the study period are presented at Annexure-XXI. Wind pattern during the study period Wind speed, wind direction, temperature and relative humidity data was collected daily on hourly basis for three months during summer season. Wind roses of sixteen directions viz., N, NNE, NE, ENE, E,ESE, SE, SSE, S,SSW,SW, WSW, W, WNW, NW and NNW for twenty four hours duration respectively have been plotted. The wind pattern during the study period is presented in Fig On analysis of the total wind pattern prevailing in the site, the following are the observations regarding the Wind Pattern: Predominant wind directions are SE, SSE and SSW. Wind directions were also observed in N direction Wind speeds were observed in the range of m/s The predominant wind direction during this period was from SE, SSE and SSW sector accounting to about 45.4% of the total time with calm winds of less than 0.5 m/s for about 7.3%. Wind speeds during this period were varying from m/s. The summary of recorded meteorological data for the study period at project site is presented in Table KKB Envirocare Consultants Pvt. Ltd., Hyderabad
144 NATCO Pharma Ltd., Chemical Divn.-Chennai-EIA Report Chapter 3: Description of Environment Fig : Wind Rose Diagram for the study period (Summer) Table 3.1.1: Summary of the Meteorological Data Generated in the Site Month Study period (March to May 2017) Temperature ( o C) Relative Humidity (%) Rainfall (mm) Max Min Max Min KKB Envirocare Consultants Pvt. Ltd., Hyderabad
145 NATCO Pharma Ltd., Chemical Divn.-Chennai-EIA Report Chapter 3: Description of Environment Ambient Air Quality The prime objective of the baseline air quality monitoring was to evaluate the existing air quality of the area. The tropical climatic conditions mainly control the transport and dispersion of atmospheric emissions during various seasons, which ultimately determine the ambient air quality status in project area. This will also be useful for assessing the conformity to standards of the ambient air quality during the operation of the proposed expansion project. The following sections describe the selection/description of sampling locations, methodology adopted for sampling, frequency of sampling and analytical techniques Description of Sampling Locations The Ambient Air Quality status with respect to the study area of 10 km radial distance from the proposed expansion plant site forms the baseline information over which the predicted impacts due to the proposed expansion activities of the project can be super imposed to find out the net (final) impacts on air environment. Selection of the representative sampling locations is primarily guided by the topography and micrometeorology of the region. The baseline status of the Ambient Air Quality can be assessed through a scientifically designed ambient air quality monitoring network based on the following considerations. Meteorological conditions Topography of the study area. Representations of regional background levels. Representations of plant site. Representations of predominant and cross sectional distribution in the downward direction. Representations of Upwind direction Influence of the existing sources if any, Inclusion of population zone, sensitive receptors, reserved forests to collect baseline. Ambient Air Quality Monitoring (AAQM) stations were set up at 8 locations with due consideration to the above mentioned points. Table gives the details of environmental setting around each monitoring station and their distances and direction with reference to the proposed expansion project. The AAQM locations are shown in Fig KKB Envirocare Consultants Pvt. Ltd., Hyderabad

146 NATCO Pharma Ltd., Chemical Divn.-Chennai-EIA Report Chapter 3: Description of Environment Fig : Ambient Air Quality Monitoring Locations 1. Plant Site 5. Kanniyammanpettai 2. Elandacheri 6. Sirugavur 3. Sivasakthinagar 7. Ammantangal 4. Tyambakkam 8. Velliyal Colony 3.5 KKB Envirocare Consultants Pvt. Ltd., Hyderabad
147 NATCO Pharma Ltd., Chemical Divn.-Chennai-EIA Report Sl. No. Chapter 3: Description of Environment Table 3.1.2: Ambient Air Quality Monitoring Locations Description Distance from project site (km) Direction from project site Description of the location 1 Plant Site Elandacheri 0.4 NE Cross wind 3 Sivasakthinagar 3.0 SE Upwind 4 Tyambakkam 3.3 W Cross wind 5 Kanniyammanpettai 0.9 W Downwind 6 Sirugavur 5.6 WNW Cross wind 7 Ammantangal 3.6 NW Downwind 8 Velliyal Colony 5.2 NNW Cross wind Frequency and Parameters for Sampling Ambient air quality monitoring has been carried out for 24 hourly sample two days per week at eight locations covering three months (March to May 2017). The ambient air quality parameters i.e., PM 10 (Particulate Matter Size<10 µm), PM 2.5 (Particulate Matter- Size <2.5 µm), SO 2 (Sulphur Dioxide), NO 2 (Nitrogen Dioxide), Ammonia, CO, Ozone (O 3 ), Lead (Pb), Benzene (C 6 H 6 ), Benzo Pyrene (BaP) - particulate phase only, Arsenic (As), Nickel (Ni), Volatile Organic Compounds (VOC) & HC have been monitored in all 8 locations Instruments used for Sampling Respirable dust sampler (RDS) was used for monitoring particulate matter (RSPM) / PM10, Fine Particle Sampler (FPS) was used to monitor PM2.5 Gaseous pollutants like SO 2, NO 2, O 3, NH 3 etc., are sampled using (Gaseous Sampling Attachment midget impinger kit) connected to RDS / FPS. Filter paper is used for Lead (Pb), Arsenic (As), Nickel (Ni). Benzo Pyrene (BaP) & Bezene were analyzed by adsorption and desorption technique. Instant analyzer was used for monitoring Total Volatile Organic Compounds (TVOC), CO and HC Sampling and Analytical Techniques Sampling and Analysis for AAQ parameters are done as per CPCB published (May 2011) Guidelines for the Measurement of Ambient Air Pollutants Volume-1 (Guidelines for Manual Sampling & Analysis). The techniques used for ambient air quality monitoring and its minimum detectable levels are given in Table KKB Envirocare Consultants Pvt. Ltd., Hyderabad
148 NATCO Pharma Ltd., Chemical Divn.-Chennai-EIA Report Sl. No. Chapter 3: Description of Environment Table 3.1.3: AAQ monitoring parameters detectable limits with NAAQS Parameters Minimum Detectable Limit NAAQ Standard Annual 1 PM 10 (Particulate Matter Size<10 µm) - µg/m PM 2.5 (Particulate Matter- Size <2.5 µm) - µg/m SO 2 (Sulphur Dioxide) - µg/m NO 2 (Nitrogen Dioxide)- µg/m Ammonia - µg/m CO ppm (mg/m 3 ) 1 (1.23) 2 mg/m 3 7 Ozone (O 3 ) - µg/m Lead (Pb) - µg/m Benzene (C 6 H 6 ) - µg/m Benzo Pyrene (BaP) particulate phase only, ng/m 3 11 Arsenic (As), ng/m Nickel (Ni), ng/m VOC - ppm HC ppm Baseline Status The existing plant ambient air quality status monitored during study period is presented in Table Work room VOC concentrations in the plant site at various locations are monitoring and is presented in Table The baseline AAQ field data in study area results of all locations for the study period are presented in Annexure-XXII. Various statistical parameters like minimum, maximum, average and 98th percentile have been computed from the observed raw data for all the AAQ monitoring stations. The maximum 24 hourly PM 10 concentration at individual locations varied from µg/m 3. Higher concentration of 64 µg/m 3 was recorded at plant site due to industrial operations. The minimum PM 10 concentrations in the study area were in the range of µg/m 3. The 98 th percentile concentrations of PM 10 concentrations were in the range of µg/m 3. The maximum 24 hourly PM 2.5 concentration at individual locations varied from µg/m 3. Highest value of 28µg/m 3 was recorded at plant site due to industrial operations. The minimum PM 2.5 concentrations in the study area were in the range of µg/m 3. The 98 th percentile concentrations of PM 2.5 concentrations were in the range of µg/m 3. The minimum concentrations of 24 hourly SO 2 at individual locations varied from 9-13µg/m 3, while the maximum concentrations during the study period were recorded in the range: µg/m 3. The 98 th percentile concentrations of Sulphur dioxide were in the range of µg/m 3. Maximum value of 15 µg/m 3 was recorded near the sampling station located at plant site due to industrial activities. 3.7 KKB Envirocare Consultants Pvt. Ltd., Hyderabad
149 NATCO Pharma Ltd., Chemical Divn.-Chennai-EIA Report Chapter 3: Description of Environment Table 3.1.4: Ambient Air Quality Status: Summer Season Sampling time: 24 hrs Unit: µg/m 3 Parameter Minimum Maximum Mean 98th Percentile AAQ 1: Plant Site PM 10 in µg/m PM 2.5 in µg/m SO 2 in µg/m NO 2 in µg/m CO in ppm < 1.0 < 1.0 < 1.0 < 1.0 NH 3 in µg/m 3 < Ozone in µg/m Lead in µg/m 3 < 0.1 < 0.1 < 0.1 < 0.1 C 6 H 6 in µg/m 3 < 0.1 < 0.1 < 0.1 < 0.1 BaP in ng/m 3 < 1.0 < 1.0 < 1.0 < 1.0 As in ng/m 3 < 1.0 < 1.0 < 1.0 < 1.0 Ni in ng/m 3 < 10 < 10 < 10 < 10 VOC in ppm < HC in ppm < 1.0 <1.0 <1.0 < 1.0 AAQ 2: Elandacheri PM 10 in µg/m PM 2.5 in µg/m SO 2 in µg/m NO 2 in µg/m CO in ppm < 1.0 < 1.0 < 1.0 < 1.0 NH 3 in µg/m 3 < Ozone in µg/m Lead in µg/m 3 < 0.1 < 0.1 < 0.1 < 0.1 C 6 H 6 in µg/m 3 < 0.1 < 0.1 < 0.1 < 0.1 BaP in ng/m 3 < 1.0 < 1.0 < 1.0 < 1.0 As in ng/m 3 < 1.0 < 1.0 < 1.0 < 1.0 Ni in ng/m 3 < 10 < 10 < 10 < 10 VOC in ppm < 0.1 < 0.1 < 0.1 < 0.1 HC in ppm < 1.0 <1.0 <1.0 < 1.0 AAQ 3: Sivasakthinagar PM 10 in µg/m PM 2.5 in µg/m SO 2 in µg/m NO 2 in µg/m CO in ppm < 1.0 < 1.0 < 1.0 < 1.0 NH 3 in µg/m 3 < Ozone in µg/m Lead in µg/m 3 < 0.1 < 0.1 < 0.1 < 0.1 C 6 H 6 in µg/m 3 < 0.1 < 0.1 < 0.1 < 0.1 BaP in ng/m 3 < 1.0 < 1.0 < 1.0 < 1.0 As in ng/m 3 < 1.0 < 1.0 < 1.0 < 1.0 Ni in ng/m 3 < 10 < 10 < 10 < 10 VOC in ppm < 0.1 < 0.1 < 0.1 < 0.1 HC in ppm < 1.0 <1.0 <1.0 < KKB Envirocare Consultants Pvt. Ltd., Hyderabad
150 NATCO Pharma Ltd., Chemical Divn.-Chennai-EIA Report Chapter 3: Description of Environment Table 3.1.4: Ambient Air Quality Status: Summer Season (contd ) Sampling time: 24 hrs Unit: µg/m 3 Parameter Minimum Maximum Mean 98th Percentile AAQ 4: Tyambakkam PM 10 in µg/m PM 2.5 in µg/m SO 2 in µg/m NO 2 in µg/m CO in ppm < 1.0 < 1.0 < 1.0 < 1.0 NH 3 in µg/m 3 < Ozone in µg/m Lead in µg/m 3 < 0.1 < 0.1 < 0.1 < 0.1 C 6 H 6 in µg/m 3 < 0.1 < 0.1 < 0.1 < 0.1 BaP in ng/m 3 < 1.0 < 1.0 < 1.0 < 1.0 As in ng/m 3 < 1.0 < 1.0 < 1.0 < 1.0 Ni in ng/m 3 < 10 < 10 < 10 < 10 VOC in ppm < 0.1 < 0.1 < 0.1 < 0.1 HC in ppm < 1.0 <1.0 <1.0 < 1.0 AAQ 5: Kanniyammalpettai PM 10 in µg/m PM 2.5 in µg/m SO 2 in µg/m NO 2 in µg/m CO in ppm < 1.0 < 1.0 < 1.0 < 1.0 NH 3 in µg/m 3 < Ozone in µg/m Lead in µg/m 3 < 0.1 < 0.1 < 0.1 < 0.1 C 6 H 6 in µg/m 3 < 0.1 < 0.1 < 0.1 < 0.1 BaP in ng/m 3 < 1.0 < 1.0 < 1.0 < 1.0 As in ng/m 3 < 1.0 < 1.0 < 1.0 < 1.0 Ni in ng/m 3 < 10 < 10 < 10 < 10 VOC in ppm < 0.1 < 0.1 < 0.1 < 0.1 HC in ppm < 1.0 <1.0 <1.0 < 1.0 AAQ 6: Sirugavur PM 10 in µg/m PM 2.5 in µg/m SO 2 in µg/m NO 2 in µg/m CO in ppm < 1.0 < 1.0 < 1.0 < 1.0 NH 3 in µg/m 3 < Ozone in µg/m Lead in µg/m 3 < 0.1 < 0.1 < 0.1 < 0.1 C 6 H 6 in µg/m 3 < 0.1 < 0.1 < 0.1 < 0.1 BaP in ng/m 3 < 1.0 < 1.0 < 1.0 < 1.0 As in ng/m 3 < 1.0 < 1.0 < 1.0 < 1.0 Ni in ng/m 3 < 10 < 10 < 10 < 10 VOC in ppm < 0.1 < 0.1 < 0.1 < 0.1 HC in ppm < 1.0 <1.0 <1.0 < KKB Envirocare Consultants Pvt. Ltd., Hyderabad
151 NATCO Pharma Ltd., Chemical Divn.-Chennai-EIA Report Chapter 3: Description of Environment Table 3.1.4: Ambient Air Quality Status: Summer Season Sampling time: 24 hrs Unit: µg/m 3 Parameter Minimum Maximum Mean 98th Percentile AAQ 7: Ammantangal PM 10 in µg/m PM 2.5 in µg/m SO 2 in µg/m NO 2 in µg/m CO in ppm < 1.0 < 1.0 < 1.0 < 1.0 NH 3 in µg/m 3 < Ozone in µg/m Lead in µg/m 3 < 0.1 < 0.1 < 0.1 < 0.1 C 6 H 6 in µg/m 3 < 0.1 < 0.1 < 0.1 < 0.1 BaP in ng/m 3 < 1.0 < 1.0 < 1.0 < 1.0 As in ng/m 3 < 1.0 < 1.0 < 1.0 < 1.0 Ni in ng/m 3 < 10 < 10 < 10 < 10 VOC in ppm < 0.1 < 0.1 < 0.1 < 0.1 HC in ppm < 1.0 <1.0 <1.0 < 1.0 AAQ 8: Velliyal Colony PM 10 in µg/m PM 2.5 in µg/m SO 2 in µg/m NO 2 in µg/m CO in ppm < 1.0 < 1.0 < 1.0 < 1.0 NH 3 in µg/m 3 < 20 < 20 < 20 < 20 Ozone in µg/m Lead in µg/m 3 < 0.1 < 0.1 < 0.1 < 0.1 C 6 H 6 in µg/m 3 < 0.1 < 0.1 < 0.1 < 0.1 BaP in ng/m 3 < 1.0 < 1.0 < 1.0 < 1.0 As in ng/m 3 < 1.0 < 1.0 < 1.0 < 1.0 Ni in ng/m 3 < 10 < 10 < 10 < 10 VOC in ppm < 0.1 < 0.1 < 0.1 < 0.1 HC in ppm < 1.0 <1.0 <1.0 < 1.0 Table 3.1.5: Workroom VOC concentrations at Plant Site Location Minimum Maximum Mean 98th Percentile Plant Site Work room concentrations (VOC in ppm) Production block Ware house < Tank farm area ETP area Admin area < 0.1 < 0.1 < 0.1 < 0.1 Canteen area < 0.1 < 0.1 < 0.1 < 0.1 Security gate < 0.1 < 0.1 < 0.1 < 0.1 Main Entrance < 0.1 < 0.1 < 0.1 < 0.1 Back gate near OSR land < 0.1 < 0.1 < 0.1 < KKB Envirocare Consultants Pvt. Ltd., Hyderabad
152 NATCO Pharma Ltd., Chemical Divn.-Chennai-EIA Report Chapter 3: Description of Environment The minimum concentrations of NO 2 at all locations varied from µg/m 3, whereas the maximum 24 hourly NO 2 concentrations were recorded in the range: 22-30µg/m 3. The 98 th percentile concentration of nitrogen oxides were in the range of µg/m 3. Maximum value of 30µg/m 3 was recoded near the sampling station located at plant site due to industrial activities. The NH 3 concentrations at all locations are ranged from BDL - 42µg/m 3. Results of the ambient air quality parameters monitored at all the locations were found to be well within the limits of National Ambient Air Quality (NAAQ) standards (Annexure-XXIII). Concentrations of AAQ parameters are mainly contributed due to vehicular traffic, Industrial and local activities. The Volatile Organic Compounds monitored at difference locations in the study area were found in the range of BDL-0.4 ppm. In plant site the VOC conc. are in the range of ppm. The HC and CO concentrations were found below detectable limit of 1 ppm KKB Envirocare Consultants Pvt. Ltd., Hyderabad
153 NATCO Pharma Ltd., Chemical Divn.-Chennai-EIA Report 3.2 Noise Environment Chapter 3: Description of Environment The physical description of sound concerns its loudness as a function of frequency. Noise in general is sound, which is composed of many frequency components of various types of loudness distributed over the audible frequency range. The most common and universally accepted scale is the A weighted scale, which is measured as db(a). This is more suitable for audible range of 20 to 20,000 Hz. The scale has been designed to weigh various components of noise according to the response of human ear. The environmental impact of noise can have several effects varying from Noise Induced Hearing Loss (NIHL) to annoyance depending on loudness of noise. As it is known that high db(a) noise levels cause adverse effect on human beings and associated environment, including land, structures, domestic animals and natural ecological systems. A detailed survey on noise environment in and around the project site was carried out by measuring spot noise levels at 8 locations using a precision sound level meter. The main objective of noise monitoring in the study area is to establish the baseline noise levels and assess the impact of the total noise expected to be generated during the expansion project operations in and around the project site Reconnaissance A reconnaissance survey conducted with a view to establish the baseline status of the environment with respect to noise levels in the study area. A preliminary reconnaissance survey undertaken is to identify the major noise generating sources in the area. The noise at different locations based on various activities like Industrial, commercial and transportation measured during the study period. Measured noise levels, displayed, as a function of time, is useful for describing the acoustical climate of the community. Noise levels recorded at each station with a time interval of about 60 minutes computed for equivalent noise levels. Equivalent noise level is a single number descriptor for describing time varying noise levels. The day noise levels have monitored during 6 am to 10 pm and night levels during 10 pm to 6 am at all the prime locations identified in the study area. Typical considerations in environmental noise assessment divided into two separate categories, one related to noise sources and other related to potential receivers. Two quantities needed to describe completely the strength of the source i.e. Sound Power Levels Directivity 3.12 KKB Envirocare Consultants Pvt. Ltd., Hyderabad
154 NATCO Pharma Ltd., Chemical Divn.-Chennai-EIA Report Chapter 3: Description of Environment Sound Power levels measure the total sound power radiated by the source in all directions and directivity is a measure of the difference in radiation with direction. The concept of sound power level and directivity index makes it possible to calculate the sound pressure level (SPL) created by source. Characteristics of noise sources (instantaneous, intermittent or continuous in nature): It is known that a steady noise is not as annoying as one that is continuously varying in loudness. The time of day at which noise occurs, for example, loud noise levels at night in residential areas are not acceptable because of sleep disturbance. The location of the noise source with respect to noise sensitivity determines the loudness and period of noise exposure. The environmental impact of noise can have several effects varying from Noise Induced Hearing Loss (NIHL) to annoyance depending on loudness of noise levels. The environmental impacts of noise from the plant activities are carried out by taking into consideration of the following factors: Potential damage to hearing Potential physiological responses Annoyance General community responses For Noise levels measured over a given period of time interval, it is possible to describe important features of noise using statistical quantities. This is calculated using the percent of the time certain noise levels are exceeding the time interval Baseline Status The ambient noise levels (Leq) were monitored at the selected villages within the study area during day and night times. The details of the monitoring stations are presented in Table and locations are shown in Fig Equivalent noise level is a scale for the measurement of long-term noise exposure and has been accepted by International Standard Organization for the measurement of both community noise exposure (ISO 1971) and hearing damage risk (ISO 1975) criteria. The noise levels in surrounding villages and in various locations in plant site were monitored using precision noise level meter. The statistical analysis for measured noise levels at eight locations is carried out. The parameters are analyzed for Leq day, and Leq night, the statistical analysis results are presented in Table & Table The ambient noise level during study period is presented in Annexure- XXIV. The daytime (L day ) noise levels at all the locations are observed in the range of 52.2 to 61.7 db (A). The maximum noise level of 61.7 db (A) was observed at existing plant site (industrial area) and the minimum noise level of 52.2 db (A) was observed at Ammantangal during the study period. It is observed that the day time noise levels are in accordance to the 3.13 KKB Envirocare Consultants Pvt. Ltd., Hyderabad
155 NATCO Pharma Ltd., Chemical Divn.-Chennai-EIA Report Chapter 3: Description of Environment prescribed limit of 75 db (A) considering plant site is in industrial area, where as all other locations were found marginal increase within ambient noise standards when compared with residential area noise levels. The night time (L night ) noise levels at all the locations were observed in the range of 42.6 to 55.4 db (A). The maximum noise level of 55.4 db (A) was observed at plant site and the minimum noise level of 42.6 was observed at Ammantangal during the study period. It has been found that the night time noise levels were marginally higher when compared with prescribed residential standard of 45 db (A) at all the locations. The noise levels at all the locations in study area during day & night are meeting the noise standards in respective of category of Area / zone prescribed by CPCB (Annexure-XXV) during day as well as night time KKB Envirocare Consultants Pvt. Ltd., Hyderabad
156 NATCO Pharma Ltd., Chemical Divn.-Chennai-EIA Report Chapter 3: Description of Environment Fig : Noise Monitoring Locations 1. Plant Site 2. Elandacheri 3. Sivasakthinagar 4. Tyambakkam 5. Kanniyammanpettai 6. Sirugavur 7. Ammantangal 8. Velliyal Colony 3.15 KKB Envirocare Consultants Pvt. Ltd., Hyderabad
157 NATCO Pharma Ltd., Chemical Divn.-Chennai-EIA Report Chapter 3: Description of Environment Table 3.2.1: Noise Monitoring Locations Sl. Distance from Direction Sampling Location No. project site (km) from project site 1. Plant Site Elandacheri 0.4 NE 3. Sivasakthinagar 3.0 SE 4. Tyambakkam 3.3 W 5. Kanniyammanpettai 0.9 W 6. Sirugavur 5.6 WNW 7. Ammantangal 3.6 NW 8. Velliyal Colony 5.2 NNW Table 3.2.2: Equivalent Day- Night Noise Levels in the Study Area Sl. No. Location Equivalent Noise Levels db(a) Day Night 1 Plant Site Elandacheri Sivasakthinagar Tyambakkam Kanniyammanpettai Sirugavur Ammantangal Velliyal Colony Table 3.2.3: Noise Levels in Plant site Sl. Location No. 1 DG Set area (on condition) at 1 m distance Noise Levels db(a) Day Night Production area Boiler area Admin area ETP area Security gate KKB Envirocare Consultants Pvt. Ltd., Hyderabad
158 NATCO Pharma Ltd., Chemical Division EIA Report Chapter 3: Description of Environment 3.3 Water Environment In general any developmental/expansion project related to APIs and its intermediates is expected to cause impacts on water environment i.e. stress on water resources, pollution impacts through discharge of effluents, resources quality & supportive capacity and water availability to the proposed project throughout the year. These impacts may be related to groundwater resources in the project area depending on the specific situation. To address these issues it is necessary to take stock of water resources in project area available with respect to their existing quality as well as their supportive capacity to represent the baseline status of water environment. The existing water resources, both surface water and groundwater are identified represented sampling locations within the study area (10 km radial distance) around project site to assess the existing (pre-expansion project) status of water quality within the impact zone. All the surveyed villages are having metro water treated water supply for drinking purpose. Ground water through bore wells is used for other purposes. There are other bore wells fitted with motor and pumped to overhead tanks for distribution in villages and used for purpose other than drinking. Physico-chemical parameters having relevance to public health and aesthetic significance are selected to assess the water quality status. The standard methods prescribed for ground water sampling and analytical for individual parameters are followed in this study Baseline Status Surface water: The prevailing (pre-expansion project) status of water quality has been assessed through identification of water resources and appropriate sampling locations for both surface and ground water in the study area. There is local tanks/open wells/bore wells/river for surface water quality assessment. Most of the sources are used for other purpose than drinking. Accordingly, 9 samples were collected on and to assess the baseline status of surface water quality in the study area as shown in Fig and listed in Table The observed data related to physico-chemical characteristics of surface water samples collected from various locations in study area are presented in Table Ground Water: Survey in the selected sample villages around the project site (within 10 km radius) revealed that all the sample villages use bore water supplied through overhead tanks, public stand posts and house connections for domestic purposes other than drinking. All the surveyed villages are supplied drinking water by Metrowater. The bore wells etc. are used for other purposes. Ground water sampling locations are identified based on drainage pattern, water utilization and location of bore wells/dug wells. Accordingly, 9 samples were 3.17 KKB Envirocare Consultants Pvt. Ltd., Hyderabad
159 NATCO Pharma Ltd., Chemical Division EIA Report Chapter 3: Description of Environment collected on and to assess the baseline status of groundwater quality in the study area as shown in Fig and listed in Table The observed data related to physico-chemical characteristics of Ground water samples collected from various locations in study area are presented in Table Surface Water Quality The physical parameters such as ph were found in the range are within permissible limit. Inorganic parameters such as Total Alkalinity is in the range of mg/l; Total Hardness is in the range of mg/l, except sea water having 6440 mg/l; Chlorides is in the range of mg/l except sea water having mg/l. Sulphate is in the range of mg/l except sea water has 2800 mg/l. The results of Nitrate are in the range of mg/l. The source sample locations can be used for drinking purpose after conventional treatment followed by disinfection except locations source at Kosasthalaiyar river (north side) and sea water. The designated best use of CPCB classification of surface water standards are presented at Annexure-XXVI Ground Water Quality The physical parameters such as ph and TDS were found in the range and mg/l respectively. The ph is slightly less than acceptable limit of 6.5 at new Manali town location. The TDS and other parameters concentration is very high in all the locations tested. Therefore, the locations are not fit for drinking purpose as per BIS standards. Inorganic parameters such as Total Alkalinity is in the range of mg/l meeting the acceptable limit of 200 mg/l at Andarkuppam village; Total Hardness is in the range of mg/l meeting the acceptable limit of 200 mg/l at old Manali petrol bunk; Chlorides is in the range of mg/l meeting the acceptable limit of 250 mg/l at Amma Canteen near plant site, Andarkuppam, old Manali petrol bunk; Sulphates are in the range of mg/l meeting the acceptable limit of 200 mg/l at Andarkuppam village and old Manali Petrol bunk. The results of Nitrate are in the range of mg/l meeting acceptable limit of 45 mg/l at Old Manali Petrol bunk. The higher concentrations indicate the hard waters because of Geological conditions and very old industrial area having different kind of industries located in the area. The analysis results show that TDS, alkalinity, hardness, chlorides are higher than acceptable limits as per IS The standards are presented at Annexure-XXVII KKB Envirocare Consultants Pvt. Ltd., Hyderabad
160 NATCO Pharma Ltd., Chemical Division EIA Report Chapter 3: Description of Environment Fig : Surface and Ground water Sampling Locations Surface Water 1. Kosasthalaiyar river 2. Retteri Lake 3. Andarkuppam Pond (Upstream-South side) 4. Ariyaloor Pond 5. Pulzhal Lake 6. Kosasthalaiyar River (North Side) 7. Sea Water 8. Kadapakkam Panchayat Lake 9. Kosasthalaiyar River (Downstream-South Side) Ground water 1. Plant Site (OSR land) 2. Amma Canteen 3. Andarkuppam near plant site-back Gate 4. New Manali Town 5. Open well (Burma Nagar) 6. Old Manali -petrol bunk 7. Bore water- Near ETP 8. Bore water-near water treatment plant 9. Bore water-near Back Gate 3.19 KKB Envirocare Consultants Pvt. Ltd., Hyderabad
161 NATCO Pharma Ltd., Chemical Division EIA Report Chapter 3: Description of Environment SI. No. Surface Water 1. Table 3.3.1: Surface and Ground Water Quality Sampling Locations Sampling Location Kosasthalaiyar river (Upstream-South side) Distance from project site Direction from Project Site GPS point Km Latitude Longitude 1.24 SW 13 10'48.57"N 80 15'21.43"E 2. Retteri Lake 6.7 SW 13 8'58.15"N 80 12'45.75"E 3. Andarkuppam Pond 0.5 WNW 13 11'36.16"N 80 15'40.32"E 4. Ariyaloor Pond 2.26 W 13 11'30.11"N 80 14'37.76"E 5. Pulzhal Lake 8.1 W 13 11'8.09"N 80 11'24.04"E 6. Kosasthalaiyar River (North Side) 2.85 N 13 12'59.19"N 80 16'19.12"E 7. Sea Water 5.3 E 13 11'0.03"N 80 19'4.75"E Kadapakkam Panchayat Lake Kosasthalaiyar River (Downstream-South Side) Ground Water 1.6 NW 13 12'10.73"N 80 15'17.65"E 0.8 SSE 13 10'49.78"N 80 16'13.62"E 1. Plant Site (OSR land) '32.15"N 80 15'57.79"E 2. Amma Canteen near plant site-back Gate 0.3 NE 13 11'32.02"N 80 16'9.24"E 3. Andarkuppam 0.55 NW 13 11'33.36"N 80 15'38.63"E 4. New Manali Town 1.5 NE 13 12'3.97"N 80 16'33.05"E 5. Burma Nagar (Open well) 2 E 13 11'1.21"N 80 17'12.07"E 6. Old Manali -petrol bunk 3.05 SSW 13 9'50.27"N 80 15'20.15"E 7. Bore water- Near ETP '12.71"N 80 15'59.47"E Bore water-near water treatment plant Bore water-near Back Gate '21.60"N 80 16'1.91"E '32.10"N 80 15'58.25"E 3.20 KKB Envirocare Consultants Pvt. Ltd., Hyderabad
162 NATCO Pharma Ltd., Chemical Division EIA Report Chapter 3: Description of Environment Table 3.3.2: Surface Water Quality Sl. No. Parameter ph Turbidity, NTU Total dissolved solids (mg/l) Total Hardness as CaCO 3 (mg/l) Calcium Hardness as CaCO 3 (mg/l) Total Alkalinity as CaCO 3 (mg/l) Chlorides as Cl, mg/l Fluoride as F, mg/l Sulphates as SO 4, mg/l Calcium as Ca, mg/l Magnesium as Mg, mg/l Sodium as Na, mg/l Potassium as K, mg/l Nitrates as NO 3, mg/l Total phosphates, mg/l Dissolved Oxygen, mg/l Chemical Oxygen Demand, mg/l Biochemical Oxygen Demand, mg/l Iron as Fe, mg/l Cobalt as Co, mg/l < 0.5 < 0.5 < 0.5 < 0.5 < 0.5 < < Zinc as Zn, mg/l < 0.5 < 0.5 < 0.5 < 0.5 < < Chromium as Cr, < 0.05 < 0.05 < 0.05 < 0.05 < < Copper as Cu, mg/l < 0.05 < 0.05 < 0.05 < 0.05 < < Manganese as Mn, mg/l < 0.1 < 0.1 < 0.1 < 0.1 < < Cadmium as Cd, mg/l < 0.5 < 0.5 < 0.5 < 0.5 < 0.5 < 0.5 < 0.5 < 0.5 < Boron as B, mg/l < 0.2 < 0.2 < 0.2 < 0.2 < 0.2 < 0.2 < 0.2 < 0.2 < Lead as Pb, mg/l < 0.01 < 0.01 < 0.01 < 0.01 < Total Coliforms, cfu/ 100ml Kosasthalaiyar river (Upstream-South side) 2. Retteri Lake 3. Andarkuppam Pond 4. Ariyaloor Pond 5. Pulzhal Lake 6. Kosasthalaiyar River (North Side) 7. Sea Water 8. Kadapakkam Panchayat Lake 9. Kosasthalaiyar River (Downstream-South Side) 3.21 KKB Envirocare Consultants Pvt. Ltd., Hyderabad
163 NATCO Pharma Ltd., Chemical Division EIA Report Chapter 3: Description of Environment Sl. No. Parameter Table 3.3.3: Ground Water Quality Sampling locations Standard (Acceptable) - BIS ph Turbidity, NTU Total dissolved solids (mg/l) Total Hardness as CaCO 3 (mg/l) Calcium Hardness as CaCO 3 (mg/l) Total Alkalinity as CaCO 3 (mg/l) Chlorides as Cl, mg/l Fluoride as F, mg/l Sulphates as SO 4, mg/l Calcium as Ca, mg/l Magnesium as Mg, mg/l Sodium as Na, mg/l Potassium as K, mg/l Nitrates as NO 3, mg/l Total phosphates, mg/l Dissolved Oxygen, mg/l Chemical Oxygen Demand, mg/l Iron as Fe, mg/l Cobalt as Co, mg/l 0.59 < 0.5 < 0.5 < < 0.5 < 0.5 < 0.5 < Zinc as Zn, mg/l 0.6 < 0.5 < 0.5 < < 0.5 < 0.5 < 0.5 < Chromium as Cr, mg/l 0.72 < 0.05 < 0.05 < < 0.05 < 0.05 < 0.05 < Copper as Cu, mg/l 0.85 < 0.05 < 0.05 < < 0.05 < 0.05 < 0.05 < Manganese as Mn, mg/l 1.13 < 0.1 < 0.1 < < 0.1 < 0.1 < 0.1 < Boron as B, mg/l < 0.2 < 0.2 < 0.2 < 0.2 < 0.2 < 0.2 < 0.2 < 0.2 < Lead as Pb,mg/l 0.2 < 0.01 < 0.01 < < 0.01 < 0.01 < 0.01 < Total Coliforms, cfu/ 100ml Absent Absent Absent Absent Absent Absent Absent Absent Absent 0 1. Plant Site (OSR land) 2. Amma Canteen near plant site-back Gate 3. Andarkuppam 4. New Manali Town 5. Open well (Burma Nagar) 6. Old Manali -petrol bunk 7. Bore water- Near ETP 8. Bore water-near water treatment plant 9. Bore water-near Back Gate 3.22 KKB Envirocare Consultants Pvt. Ltd., Hyderabad
 status of land environment has been assessed through reconnaissance in project area, characterization of soil through field studies as well as study of")
164 NATCO Pharma Ltd., Chemical Divn., Chennai-EIA Report Chapter 3: Description of Environment 3.4 Land Environment The baseline (Pre-expansion) status of land environment has been assessed through reconnaissance in project area, characterization of soil through field studies as well as study of land use pattern through Satellite Imagery Reconnaissance The location for the proposed expansion of APIs and its intermediates is located in Manali Industrial Area, Thiruvottiyur Taluk (formerly Vaikkadu (V), Ambattur (Tq.)), Thiruvallur District, Tamil Nadu. The study area around the expansion project site contains industries, cultivable land, natural vegetation, habitations and water bodies. The area is mostly covered by Red, Brown, dark brown and Black with loam, Silt clay loam, silty loam, and clay loam soils. Soil types of Thiruvallur district are shown in Fig The Area of 10km radius buffer from the proposed expansion of APIs & its Intermediates manufacturing unit covering an area of 314 Sq. Km. The project site is situated between the intersection of latitude N and longitude E in Manali Industrial Area. Fig : Soil types of Thiruvallur district, Tamil Nadu The area falls in tropical climate. The period from April to June is generally hot and dry. The weather is pleasant during the period from November to January. The project site and surrounding study region falls in Zone 3 moderate to Seismic Intensity. The Seismic 3.23 KKB Envirocare Consultants Pvt. Ltd., Hyderabad

165 NATCO Pharma Ltd., Chemical Divn., Chennai-EIA Report Chapter 3: Description of Environment Zoning & Hazard Zoning Map is shown in Fig Fig : Seismic Zoning Map & Hazard Zoning Map of India In the study area, topographic elevation ranges from 0 in the East to 14 m msl in the West. The master slope is towards the sea. The area is generally plain with local depressions. The present site is located at about 4 m above mean sea level. The main crops of the district are maize, paddy, fodder, vegetables and other irrigated dry crops. The source of water in the Thiruvottiyur Taluq for irrigation comes from ground / surface water. The annual mean minimum and maximum temperature are C and C respectively. The day time heat is oppressive and the temperature is as high as C. The extreme recorded is 45 0 C. The lowest temperature recorded is of the order of C to 28 0 C. The study area receives the rain under the influence of both the monsoons. The north east monsoon during the months of October, November and December chiefly contribute to the rainfall in the area. Most of the precipitation occurs in the form of cyclonic storms caused due to the depressions in Bay of Bengal. The southwest monsoon rainfall is 3.24 KKB Envirocare Consultants Pvt. Ltd., Hyderabad
166 NATCO Pharma Ltd., Chemical Divn., Chennai-EIA Report Chapter 3: Description of Environment highly erratic and summer rains are negligible. The normal rainfall of the area is mm. Geology: The present site and buffer zone is underlain by the youngest formations in the area is alluvium, which was deposited on the worn- down and eroded surface of Tertiary and Gondwana rocks by the major river. The alluvium consists of gravel, fine to coarse sand, clay and sandy clay of various shades of grey and brown. Exploratory drilling shows that the thickness of these alluvial deposits increase progressively in an easterly direction towards the coast line east of Minjur, where it is about m thick. The wind deposited sand, in the form of irregular, low flat dunes ranging in width from less than 0.1 km to about a kilometer occur all along the coast, except where they are interrupted by the river outlets. In the present location upper part of the alluvium is clayey up to a depth of 3.0 to 3.5 m followed by sand admixed with gravel and clay. Drainage: The study area presents sub dendritic to dendritic drainage pattern. The area is part of Korttalaiyar River basin. The Korttalaiyar enters in the study area from NW and flows to central part and takes a turn to NE, confluence with the Kosisttalaiyar River and debouches in to sea. Local depressions form as tanks and many such water bodies are located in NW part of the study area. Hydrogeology of the area: In the study area the unconsolidated sediments are represented by the fluvial and coastal alluvium. The coastal alluvium is restricted to the eastern part of the coastal tract extending from Ennore in the north to south along the coastal. The fluvial type (river) alluvium occurs along the river course of Korattalaiyar. These consist of fine to coarse grained sands, gravels, pebbles and clays. Ground water occurs under water table and confined conditions. Korattalaiyar alluvium consists of reddish loamy sands intermixed with clay. The thickness of alluvium in Korattalaiyar basins varies from place to place. It occurs generally between 9 and 15m and occasionally up to 20 and 47 mbgl in Korattalaiyar basin towards the east in the Minjur area. But towards southwest around Tamaraipakkam only one aquifer zone in the depth range between 9 and 15m was recorded. Ground water occurs under water table to confined conditions. The depth of the dug wells range from 4.50 to 10.0 and the depth to water level between 2.0 and 5.0 mbg. The tube wells constructed in the alluvium vary from 10 to 30 m in depth and yield varies up to 12 lps. In the study area, it is found that there is thick clay 3.0 to 3.5 m, followed by coarse sand admixed with gravel and silt. Ground water is fresh within the depth of 6.0m bgl, below which saline water is encountered. The alluvial aquifers are very sensitive along the coast. Excessive pumping from these aquifers leads to saline water ingress KKB Envirocare Consultants Pvt. Ltd., Hyderabad
167 NATCO Pharma Ltd., Chemical Divn., Chennai-EIA Report Chapter 3: Description of Environment Ground water Resources: Net ground water availability of Thiruvallur District is Ham, whereas gross ground water draft (Extraction of ground water) for irrigation, industry and domestic use is Ham and the provision for domestic and industrial use for the year 2025 is 4565 Ham. Net Ground water availability for future use is Ham. Stage of ground water development is 86% indicating that the district as a whole is safe for further development of ground water. Similarly, Net ground water availability of Thiruvottiyur Block in which Manali Industrial area falls is Ham, whereas gross ground water draft (Extraction of ground water) for irrigation, industry and domestic use is Ham and the provision for domestic and industrial use for the year 2025 is Ham. Net Ground water availability for future use is Ham. The stage of ground water development is 86% indicating that the block as a whole is categorized as Semi-Critical. Any ground water development in the Block needs with management practices like water harvesting, artificial recharge etc Soil Characteristics Baseline Status For studying the soil characteristics of the region, soil samples were collected from different locations in the study area to assess the existing soil quality around the project area. Fourteen locations including plant site near admin area were identified for soil quality assessment. Soil samples are collected from surrounding agriculture fields that are likely to be impacted from the project. The locations and names of villages and their approximate distance from the project site are given in Table and in Fig Representative soil samples were collected from these villages and project site for estimation of the physicochemical characteristics of soil. Standard methods have been followed for the analysis of soil samples Physico-Chemical Characteristics The collected soil samples were analyzed for various physico-chemical parameters viz., ph, electrical conductance, calcium, magnesium, nitrogen, phosphorus, potassium, etc. particle size distribution in terms of percentage of sand, silt and clay, moisture is furnished in Table The predominant texture of soil in study area is loam, silty clay loam, clay loam and silt loam KKB Envirocare Consultants Pvt. Ltd., Hyderabad
168 NATCO Pharma Ltd., Chemical Divn., Chennai-EIA Report Chapter 3: Description of Environment Sl. No. Sampling Location Table 3.4.1: Soil Monitoring Locations Distance from project site Direction from project site GPS points Km Latitude Longitude 1 Plant site near Admin Area '12.55"N 80 16'0.42"E 2 Plant Site (Expansion area) '17.08"N 80 16'0.53"E 3 Plant Site (Near Production Blockback '24.64"N 80 15'58.14"E gate) 4 Near Plant Main Gate 0.05 E 13 11'12.78"N 80 16'10.41"E 5 Plant Site- ETP back side 0.1 S 13 11'9.42"N 80 15'56.66"E 6 Plant Outside-South west side 0.3 SW 13 11'9.25"N 80 15'51.99"E 7 Near Kosasthalaiyar riverdownstream 0.55 SSE 13 11'0.25"N 80 16'9.79"E 8 Near Andarkuppam road- Open barren land 1.6 W 13 11'24.26"N 80 15'6.19"E 9 Andarkuppam-Agriculture land 0.6 NW 13 11'39.95"N 80 15'39.30"E 10 Near New Manali town 0.8 E 13 11'29.42"N 80 16'29.93"E 11 Near Thirunilai 4.7 NNW 13 13'43.76"N 80 14'34.92"E 12 Near Kodipallam 6.2 NW 13 13'24.16"N 80 13'6.60"E Near Open Land- Veterinary University Plant site at Water tank Area 4 SW 13 9'24.98"N 80 14'38.67"E '16.98"N 80 16'1.54"E 3.27 KKB Envirocare Consultants Pvt. Ltd., Hyderabad
169 NATCO Pharma Ltd., Chemical Divn., Chennai-EIA Report Chapter 3: Description of Environment Fig : Soil sampling locations in the study area 1. Plant site near Admin 2. Plant Site (Expansion Area area) 5. Plant Site- ETP back side 6. Plant Outside-South west side 9. Andarkuppam-Agriculture land 13. Near Open Land- Veterinary University 10. Near New Manali town 14. Plant site at Water tank Area 3. Plant Site (Near Production Block-back gate 7. Near Kosasthalaiyar riverdownstream 4. Near Plant Main Gate 8. Near Andarkuppam road- Open barren land 11. Near Thirunilai 12. Near Kodipallam 3.28 KKB Envirocare Consultants Pvt. Ltd., Hyderabad
170 NATCO Pharma Ltd., Chemical Divn., Chennai-EIA Report Chapter 3: Description of Environment Table 3.4.2: Physico-Chemical Characteristics of Soil Extract and Soil Texture Sl. No. Parameters Color Red Brown Red Brown Black Black Brown 2. ph (1:2) EC( µs/cm) Texture loam loam loam loam silty loam loam silty clay loam 5. Sand in % Silt in % Clay in % Bulk Density, g/cc Porosity,% Permeability,% Sodium absorption ratio (SAR) Organic Matter in % Nitrogen as N, kg/ha Phosphorus as P, kg/ha Potassium as K, kg/ha Sodium as Na in % Calcium as Ca in % Magnesium as Mg in % Iron as Fe in % Manganese as Mn, mg/kg Boron as B, mg/kg Lead as Pb, mg/kg < 0.5 < 0.5 < 0.5 < 0.5 < 0.5 < 0.5 < Zinc as Zn, mg/kg Cadmium as Cd, mg/kg < 0.5 < 0.5 < 0.5 < 0.5 < 0.5 < 0.5 < Chromium as Cr, mg/kg Cobalt as Co, mg/kg < 0.5 < 0.5 < 0.5 < 0.5 < 0.5 < 0.5 < Copper as Cu, mg/kg Plant site near Admin Area 5. Plant Site- ETP back side 2. Plant Site (Expansion area) 6. Plant Outside- South west side 3. Plant Site (Near Production Blockback gate 7. Near Kosasthalaiyar river-downstream 4. Near Plant Main Gate 3.29 KKB Envirocare Consultants Pvt. Ltd., Hyderabad
171 NATCO Pharma Ltd., Chemical Divn., Chennai-EIA Report Chapter 3: Description of Environment Table 3.4.2: Physico-Chemical Characteristics of Soil Extract and Soil Texture (Contd ) Sl. No. Parameters Color Black Black Black Brown Dark Brown Brown Black 2. ph (1:2) EC( µs/cm) Texture clay clay clay clay silt silt clay loam loam loam loam loam loam loam 5. Sand in % Silt in % Clay in % Bulk Density, g/cc Porosity,% Permeability,% Sodium absorption ratio(sar) Organic Matter in % Nitrogen as N, kg/ha Phosphorus as P, kg/ha Potassium as K, kg/ha Sodium as Na in % Calcium as Ca in % Magnesium as Mg in % Iron as Fe in % Manganese as Mn, mg/kg Boron as B, mg/kg Lead as Pb, mg/kg < 0.5 < 0.5 < 0.5 < 0.5 < 0.5 < 0.5 < Zinc as Zn, mg/kg Cadmium as Cd, mg/kg < 0.5 < 0.5 < 0.5 < 0.5 < 0.5 < 0.5 < Chromium as Cr, mg/kg Cobalt as Co, mg/kg < 0.5 < 0.5 < 0.5 < 0.5 < 0.5 < 0.5 < Copper as Cu, mg/kg Near Andarkuppam road- Open barren land 12. Near Kodipallam 9. Andarkuppam- Agriculture land 13. Near Open Land-Veterinary University 10. Near New Manali town 14. Plant site at Water tank Area 11. Near Thirunilai 3.30 KKB Envirocare Consultants Pvt. Ltd., Hyderabad
172 NATCO Pharma Ltd., Chemical Divn., Chennai-EIA Report Chapter 3: Description of Environment The NPK represents the nutrients available in the soil, which directly indicate the soil fertility. The ph value of the soil is an important property; plants cannot grow in low and high ph. Most of the essential nutrients like N, P, K, Ca, and Mg are available for plant at the neutral ph except for Fe, Mn, and Al, which are available at low ph range. Most plants prefer a ph near neutrality or slightly towards acidic i.e. between ph 6 and 7. Many plants thrive on fairly acid or alkaline soils because they are capable of modifying the ph of the soil water due to excretion of ions like bicarbonates and calcium though their roots and also due to the decomposition of plant products like leaves, roots, flowers etc. Some organisms have a rather small tolerance to variation of ph, but other organisms can tolerate wide ph range. The availability / solubility of some plant nutrients decreases with an increase in ph. Potassium availability is good in neutral and alkaline soil. The ph values in the study area are varying from showing moderately acidic to moderately alkaline during study period. Organic carbon present in soil samples collected show average sufficient to more than sufficient except at plant site and near Kodipallam locations, which is less to medium. Nitrogen presence varies from kg/ha indicates more than sufficient, whereas phosphorus present varies from kg/ha indicate more than sufficient. Potassium present varied from kg/ha indicates more than sufficient. The soil classification is presented in Annexure-XXVIII Land use Pattern-Remote Sensing data The basic purpose of land use pattern and classification in an EIA study is to identify the manner in which different parts of land area is utilized or not utilized. Remote sensing data provides reliable accurate baseline information for land use mapping as it is a rapid method of acquiring up-to-date information of over a large geological area. Studies on land use aspects of eco-system play an imperative role in identifying susceptible issues and to take appropriate action to uphold ecological equilibrium in the region. The main objective of this section is to provide a baseline status of the study area covering 10 km radius around the proposed plant site so that temporal changes due to the industrial activities on the surroundings can be assessed in future. The objectives of Land use Pattern are to: Determine the present Land use pattern Analyze the impacts on Land use due to the proposed plant site in the study area Study area considered as 10 km radius from the epic center of the proposed project and it is buffer area. The project site is considered as core area of Ha. Boundaries are considered for land use study KKB Envirocare Consultants Pvt. Ltd., Hyderabad
173 NATCO Pharma Ltd., Chemical Divn., Chennai-EIA Report Chapter 3: Description of Environment Satellite Data: The satellite (IRS P-6 LISSIV) images are obtained from National Remote Sensing Centre (NRSC), Hyderabad and used for analysis. The latitude and longitudes as observed in the site by GPS are Latitude: 13 11'19.5"N, Longitude: 80 16'0"E. The satellite image of the site is presented in Fig Topographical Data: Topographical maps of Survey of India (SOI) were obtained for land use study as well to develop contour and drainages pattern of area from D44O3, D4404, D4407, and D44O8 of the study area for the proposed project. Methodology: The overall methodology (Fig.3.4.5) adopted and followed to achieve the objectives of the present study involves the following: Collection of source data of Survey of India (SOI) toposheets. These are the main inputs for the preparation of essential layers Satellite data of IRS P-6 LISSIV sensor is geometrically corrected and enhanced using principal component method and Nearest Neighbourhood resampling technique Preparation of basic themes like layout map, transport & settlement map and contour map from the source data. Then updating of layout map, transport map and drainage map from the satellite image by visual interpretation Essential maps (related to natural resources) like Land use / Land cover map are prepared by visual interpretation of the satellite imagery. Visual interpretation is carried out based on the image characteristics like tone, size, shape, pattern, texture, location, association, background etc. in conjunction with existing maps/ literature Preliminary quality check and necessary corrections are carried out for all the maps prepared All the maps prepared are converted into soft copy by digitization of contours and drainages. In that process editing, labeling, mosaicing, quality checking, data integration etc. are done, finally Land use areas are measured in Sq.km KKB Envirocare Consultants Pvt. Ltd., Hyderabad

174 NATCO Pharma Ltd., Chemical Divn., Chennai-EIA Report Chapter 3: Description of Environment Fig : Map Showing Satellite Image with Site Location 3.33 KKB Envirocare Consultants Pvt. Ltd., Hyderabad

175 NATCO Pharma Ltd., Chemical Divn., Chennai-EIA Report Chapter 3: Description of Environment Fig : Flow Chart of Methodology Land use Map Analysis Land use Map Analysis carried out based on the image color, texture, Tone etc. Following steps are used to analyze the Land use pattern of project site: Collection of scanned toposheets and Geo-reference the scanned image using the available coordinates Collection of IRS LISS IV images and made fused and blended the images for color combinations using Image interpreter-utilities and Layer stack option available in ERDAS Identification Area of interest (AOI) and made a buffer of 10 km radius. Enhance the Fused and blended LISS IV image using the Spatial, Radiometric and Temporal options in ERDAS 3.34 KKB Envirocare Consultants Pvt. Ltd., Hyderabad
176 NATCO Pharma Ltd., Chemical Divn., Chennai-EIA Report Chapter 3: Description of Environment Rectified the LISS IV image using Geo-referencing technique, Toposheet to get UTM coordinate system Subset the LISS images and Toposheet using 10 km buffer AOI Automatic classifications done for LISS IV images using maximum iterations and number of options in unsupervised classification options Created the signature file by selecting the more samples of different features with AOI on Unsupervised classification image Visual interpretation and supervised classification mixed with recoding practice Verified through the QC / QA and finalized the data Spatial Data from SOI Topographical Sheets Creating a GIS spatial database is a complex operation, and is the heart of the entire work; it involves data capture, verification and structuring processes. Raw geographical data are available in many different analogue and digital form such as toposheets, aerial photographs, satellite imageries and tables. Out of all these sources, the source of toposheets is of much concern to natural resource scientist and an environmentalist. In the present study, the essential maps generated from SOI topographical maps. Using the topographical maps, the drainage map and contour Map were also developed. The maps are prepared to a certain scale and with attributes complying with the requirement of terms of reference (ToR). The location of entities on the earth s surface is then specified by means of an agreed co-ordinate system. For most GIS, the common frame of co-ordinate system used for the study is UTM co-ordinates system. All the maps are first Geo-referenced. The same procedure is also applied on remote sensing data before it is used to prepare the Essential maps. Map showing site location, lakes, ponds, drains are connected to main streams and small drains within 10km radius of the project site (Fig.3.4.6). Small linear water bodies are found around the site. There are no major rivers located within 1.0km radius from the site location. There are many medium and large scale industries are found within 10km radius from the site location which are Balmer Lawrie & Co. Ltd.; Chennai Petroleum Corporation Ltd.; Coromandal International Ltd.; Cetex Petrochemicals Ltd.; Indian Additives Ltd.; IOT Infrastructure & Energy Services Ltd.; Kothari Petro Chemicals Ltd.; Madras Fertilizers Ltd.; Manali Petro Chemicals Ltd.; Piramal Health Care Ltd.; SRF Ltd.; Supreme Petro Chemical Ltd.; Toshiba JSW Power System Pvt. Ltd.; Tamilnadu Petroproducts Ltd.; Ennore Thermal Power Station; Raj Lubricants and Indian Oil Tanking (Surrounded to the NATCO). There is a clear road network connecting built-up areas and industries. Chennai Corporation also initiated the ORR for better, traffic free, pollution less road network for this industrial area which is currently in construction stage. No National parks and wild life sanctuaries located in the study area. As the terrain conditions are flat, 3.35 KKB Envirocare Consultants Pvt. Ltd., Hyderabad
177 NATCO Pharma Ltd., Chemical Divn., Chennai-EIA Report Chapter 3: Description of Environment minimal undulations and good drainage network around the site location, there is no chance of flooding. Hence risk factors are less. No National parks and wild life sanctuaries located in the study area Contour Map and Elevations of Study Area The contours in Toposheet have been digitized in the GIS environment and assigned the respective elevation values in meters with reference to the mean sea level. Using the SRTM (Shuttle Radar Topography Mission) data, the elevation values has been verified. Thereafter final contour map has been prepared with combination of Toposheet and SRTM with contour interval of 1.0 m. Project site contours vary from 4 m to 4.5 m above MSL and the study area contours vary from 1 m to 14 m above MSL. From the project site the high elevations were observed towards West direction and the lowest contours were observed in East direction. While the remaining areas showed variations with respect to contours. Contour Map with 5m interval of Study Area is presented in Fig Topography (Digital Elevation Model) A digital elevation model (DEM) is a digital representation of ground surface topography or terrain (Fig.3.4.8). It is also widely known as a digital terrain model (DTM). A DEM can be represented as a raster (a grid of squares, also known as a height map when representing elevation) or as a triangular irregular network. The proposed plant location is shown in that Relief map. For the relief study of the area very higher quality SRTM (Shuttle Radar Topography Mission) and DEM is downloaded. These DEMs of the Terra represents elevation at a 30 m resolution Land use land cover statistics of buffer zone Map showing the Land Use Land Cover classification in the study area is presented in Fig.3.4.9, it is clearly seen that the area is mostly covered with settlements around 49.24% and plantation around 4.6 % of the total area. Other class is open land (3.8%) within the study area. Around the Settlements edges the Manali Industrial area is located and occupies around % and rail network are around 0.88%, Roads 1.33 % of the total study area. Sea area is covering around %. It is an area of human habitation developed due to Industries and that has a cover of buildings, transport and communication, utilities in association with water, vegetation and vacant lands. The proposed project is in Industrial area and does not have any significant impact on the surrounding villages and habitation. The water bodies cover 3.94% of the total area. These areas have a very prominent signature and can be seen as almost Dark blue and light blue in the satellite image. The statistical break-up of the land use classes of buffer zone are presented in Table and depicted in Fig KKB Envirocare Consultants Pvt. Ltd., Hyderabad

178 NATCO Pharma Ltd., Chemical Divn., Chennai-EIA Report Chapter 3: Description of Environment Fig : Map Showing Water bodies and Drainage in Study Area 3.37 KKB Envirocare Consultants Pvt. Ltd., Hyderabad
179 NATCO Pharma Ltd., Chemical Divn., Chennai-EIA Report Chapter 3: Description of Environment Fig : Map Showing Contours with 5m Interval in Study Area 3.38 KKB Envirocare Consultants Pvt. Ltd., Hyderabad

180 NATCO Pharma Ltd., Chemical Divn., Chennai-EIA Report Chapter 3: Description of Environment Fig : Map Showing Digital Elevation Model in Study Area 3.39 KKB Envirocare Consultants Pvt. Ltd., Hyderabad

181 NATCO Pharma Ltd., Chemical Divn., Chennai-EIA Report Chapter 3: Description of Environment Fig : Map Showing Land Use Land Cover in Study Area 3.40 KKB Envirocare Consultants Pvt. Ltd., Hyderabad

182 NATCO Pharma Ltd., Chemical Divn., Chennai-EIA Report Chapter 3: Description of Environment Table 3.4.3: Land Use Land Covers Statistics of Buffer Zone Sl. No. Land Use Classes Area (Ha) Area (%) 1. Water Bodies Settlement Rail Network Road Network Industry Scrub Open Land Plantation Sea Total Landuse statistics (%) WaterBodies Settlment RailNetwork RoadNetwork Industry Scrub OpenLand Plantation Sea Fig : Graphical Presentation of Land Use Statistics 3.41 KKB Envirocare Consultants Pvt. Ltd., Hyderabad
183 NATCO Pharma Ltd.,Chemical Divn.-Chennai-EIA Report Chapter 3: Description of Environment 3.5 Biological Environment Introduction Biodiversity forms the basis of human survival on the earth. Living resources (plants, animals & microbes) and their habitats form an integral component of the biodiversity. Mutual interaction between them provide stream of tangible and intangible benefits to the human society. Unscientific and unsustainable use of these resources will threaten the very survival of human. Impact Assessment provides opportunities to ensure that biodiversity values are well recognized and are taken into account in decision-making. Biodiversity conservation, therefore, is of prime importance. In this context, an attempt has been made to understand the distribution pattern of flora and fauna in different habitat types following Environment Impact Assessment (EIA) study was done in and around of M/s NATCO Pharma Limited, Chemical Division, located at R.S.Nos. 73/1A, 73/2, 74/7B, 78/1B, 79/1, 79/2B, 79/3, 79/4B, 79/5, 79/6A, 79/6B, 79/7, 80/1, 80/2, 80/3, 80/4, 84/1, 84/2, 84/3A, 84/5A, 84/6, 84/7A, 85/1, 85/2B, 86/2B, 86/2C, 86/2D2, 86/3B, 86/4, 86/5, 86/6, 86/7, 86/8, 86/9 of Manali Industrial Area, Thiruvottiyur Taluk (formerly Vaikkadu (V), Ambattur (Tq.)), Thiruvallur District, Tamil Nadu State. Survey was undertaken in May 2017 to assess the species diversity, distribution and present status of flora and fauna Reconnaissance of the Study Area Core area is a Ha of non-agriculture and non-forest land. Some portion of the existing site area is established with infrastructural developments and developed green belt activities (Plate 3.5.1) and the rest of the area is left open/exposed. The proposed land is almost open and flat (Plate 3.5.2). A total of 14 tree species exist in the current site area, apart from several seasonal scrub and herbaceous flora. The vegetation present in the present study area is purely maintained by green belt activity and rest of open area is left open. Tree species such as Alstonia scholaris (Silver oak), Pongamia pinnata, Terminalia catappa, Borassus sp, Syzygium cumini & Cocos nucifera are the visible trees. The buffer area is a typical costal land with diverse habitats like wetlands constitute sea and inland water bodies, agriculture, open lands, salt pans and urban settlements (Plate 3.5.3). Soil types predominantly ranges from Coastal Alluvium, Black, Clay Loam & Sandy soil. There are no notified forest blocks in the 10 km radius of the study area. Vegetation that exists in the buffer area is purely of avenue/agro forestry plantation, riparian vegetation s all along the streams and tank bunds & scrub vegetation in the open/barren lands and most importantly small patches of mangrove vegetation is also noticed near Ennore. Overall, the buffer area is mostly open followed by agricultural lands, water bodies and human settlements KKB Envirocare Consultants Pvt. Ltd., Hyderabad


184 NATCO Pharma Ltd.,Chemical Divn.-Chennai-EIA Report Chapter 3: Description of Environment Plate 3.5.1: Green belt in the existing core area Plate 3.5.2: Vegetation in the proposed core area 3.43 KKB Envirocare Consultants Pvt. Ltd., Hyderabad

185 NATCO Pharma Ltd.,Chemical Divn.-Chennai-EIA Report Chapter 3: Description of Environment Plate 3.5.3: Habitat setup with agriculture practice, wetlands & open lands in the buffer area Sampling locations All information collected on the vegetation from core and buffer area surrounding, like the number of individuals and girth at breast height (for trees and lianas only) of all species were analyzed to arrive at different phyto-sociological attributes namely density, frequency, basal area, Importance value Index (IVI), Shannon-Weiner index and Simpson index. Enumeration of the plant wealth of the area was done by surveying the area through walking along the fields and gradients of hillocks. Phyto-sociological aspects of the study were carried out by perambulating and sampling through quadrat sampling method. In core area sampling locations were taken all along the project site and small rocky area with scattered scrubs. Whereas in buffer area different locations has been selected keeping in the view of covering all the possible habitats, wild and native plant species of study area mentioned in Table Sl. No. Table 3.5.1: Sampling locations in Buffer area Sample location Direction from the project site Distance from the project Site (km) 1 Kalakkral North >2.0 2 Ennore North East >6.0 3 Burma Nagar South East >2.5 4 Elandancheri South >3.5 5 Kakkanpuram South >5.0 6 Vichoor West >2.5 7 Redhills West >9.0 8 Kodipallem North West > KKB Envirocare Consultants Pvt. Ltd., Hyderabad
186 NATCO Pharma Ltd.,Chemical Divn.-Chennai-EIA Report Chapter 3: Description of Environment Methodology Phyto-sociological aspects of the study were carried out by perambulating and sampling through quadrat sampling method. Sample plots were selected in such a way to get maximum representation of different types of vegetation and plots were laid out in different parts of the areas. Accordingly, quadrats of 10 m x 10 m for the study of tree layer were laid out in the above mentioned areas. Within these sample plots, plots of 3 m x 3 m were laid out to study shrubs/ herbs/ tree saplings respectively. In this method, transect (a straight line) of 500 m is marked with rope and tape. The trees are sampled 5 m on either side of the central line of transect, while sampling, recorded the Girth at Breast Height (GBH) for trees with greater than 30 cm GBH along with species name, its phenology (flowering, fruiting, flushes etc.). For shrubs (>1cm and <30cm GBH), 3 m x 3 m square quadrat were laid at every 50 m interval and recorded all individuals with in the quadrant. For herbs (<1cm GBH), five, 1 m x 1 m plots within the plot were laid and recorded all species of herbs (tree and shrub seedling and saplings also). The plants were identified using floras by Gamble ( ), Saxena and Brahmam ( ), Nair and Henry (1983), Henry et al. (1987), Henry et al. (1989) and also by using updated check list from For mammals, intensive surveys were conducted by using transect method in all major habitats and recorded the species through direct and indirect evidences. Species were identified using A pictorial guide to the Mammals of the India by Prater (1997), Pradhan (2004). Reptiles like Snakes, lizards, Monitor lizards, Chameleons, Tortoise and turtles, Garden lizards will be identified by direct or indirect evidences along with photographs and available identification keys include Fauna of British India (Smith 1961), Tikader and Sharma (1992), Sharma (1998) and Sharma (1998), Whitaker and Captain (2004). Amphibians are surveyed both at aquatic and terrestrial systems during day & night searching under the logs and stones, digging through litter and soil, searching short bushes and tree hollows and under fallen barks and water- catching. All the species were identified using keys and descriptions of Chanda (2002), Ravichandran (2004), and Daniel (2005). Sampling of Invertebrates were done along the transect passing through various habitats, species identification was made using standard field guides (Antram, 2002; Evans, 1932; Kunte, 2000). For sampling butterflies, line transect of variable length was used widely. Generally, 500 to 1000 m transect will be laid in all the habitats. Butterflies seen 5m on either side of this transect are recorded. Birds were sampled in two ways i.e. 1) line transect and 2) point counts. Line transect: In this method, a straight line of 1km or less if the habitat is small was laid. In this line, all birds seen or heard 25 m on either side of transect were recorded KKB Envirocare Consultants Pvt. Ltd., Hyderabad
187 NATCO Pharma Ltd.,Chemical Divn.-Chennai-EIA Report Chapter 3: Description of Environment Point counts: In this method, at one point birds seen or heard 50 m radius has been recorded for 5 minutes. After this, a gap of 10 minutes, repeated the observations and recorded the species number. In the same way repeated the observation in another point and recorded different species of birds. Photographs were taken for evidences. All the species were identified using A pictorial guide to the birds of the Indian Sub-Continent by Gaston, (1973), Steward and Kantrud, (1972) Parasharya et.al (2003), Birds of Indian subcontinent by Grimmet et.al (1998) Ali (2002), Wood cock, (1986) and Snobe&Usui (1993). Data Collection & Analysis The primary data recorded on number of individuals of a species and girth was analyzed for secondary attributes like density and frequency following standard phyto-sociological methods of Mishra (1968). Relative values were calculated by following Philips (1959). Important Value Index (IVI) was calculated by adding up the three relative values of relative frequency, relative density and relative dominance (Curtis, 1959). In the case of shrubs, herbs and saplings, IVI values were calculated using two relative values, i.e., relative frequency and relative density. Formulae used for various calculations are: Density (D) = Total number of individuals of a species Total area of quadrats studied Frequency (F) = Number of quadrats of occurence Total number of quadrats studied x 100 Relative Density (RD) = Number of Indivuduals of a species Total number of individuals of all spiecies x 100 Relative Frequency (RF) = Number of occurences of a species Total number of occurence of all species x 100 Relative Basal Area (RBA) = Total basal area of a species Total basal area of all soecies Importance Value Index (IVI) = RD + RF + RBA x 100 The indices were calculated to know variations of flora & fauna in different areas. The species diversity indices were calculated by using Shannon-Wiener Index (H`) & Simpson Index (l) (Kerbs 1972 & Magurran 1988) using following formulae:- Shannon- Wiener Index (H`) = pi ln pi Simpson index (l) = pi KKB Envirocare Consultants Pvt. Ltd., Hyderabad
188 NATCO Pharma Ltd.,Chemical Divn.-Chennai-EIA Report Chapter 3: Description of Environment Where, pi is the proportion of individuals of the ith species; pi = Ni / N Ni is the number of individuals in the ith species and N is the total number of individuals of all species in the stand Vegetation structure and composition Flora in Core Zone A Flora is the Systematic enumeration of plants of a given region. Thus a Flora is an inventory of the plants of a defined geographical region. Floristic composition, which is one of the major characteristic features of plant communities, varies depending upon site and its environmental features. The plant resources in core area consisted of 43 species belonging to 39 genera and 19 families. The predominant life forms include Trees (14sp), followed by Herbs (23p) & Shrubs (6sp). Detailed check list of flora is presented in Annexure-XXIX. The concept of Importance Value Index (IVI) has been developed in order to express the dominance and ecological success of any species by a single value by laying 5 quadrats in each group. Among trees species Alstonia scholaris (23.87), Borassus sp (21.4) showed highest IVI followed by Cocos nucifera (19.28), Pongamia pinnata (18.87). These four tree species were significant in occupying majority of space and resources being represented by 2/5th of total IVI in sampled area. Top 10 tree species showing highest IVI shown in Table Sl. No. Table 3.5.2: Top 10 Tree species showing highest IVI in Core Zone Name of the species Relative Density (RD) Relative Frequency (RF) Relative Abundance (RA) Importance Value Index (IVI) 1 Alstonia scholaris Borassus sp Cocos nucifera Pongamia pinnata Terminalia catappa Terminalia catappa Peltophorum pterocarpum Tabebuia rosea Azadirachta indica Ficus religiosa Among herbaceous species, Aerva lanata (15.03), Gomphrena serrata (14.25), Heteropogon contortus (13.1) & Ageratum conyzoides (11.43) showed highest IVI in the core area. The IVI value of a species indicates its high regeneration capacity and greater ecological amplitude, top 10 herb species showing highest IVI shown in Table KKB Envirocare Consultants Pvt. Ltd., Hyderabad
189 NATCO Pharma Ltd.,Chemical Divn.-Chennai-EIA Report Chapter 3: Description of Environment Sl. No. Table 3.5.3: Top 10 Herb species showing highest IVI in Core Zone Name of the species Relative Density (RD) Relative Frequency (RF) Relative Abundance (RA) Importance Value Index (IVI) 1 Aerva lanata Gomphrena serrata Heteropogon contortus Ageratum conyzoides Celosia argentea Cassia uniflora Acalypha indica Paspalum scobiculatum Urena lobata Ageratum conyzoides The diversity values for different life forms like trees, shrubs and herbs showed that the site is good diverse with regards to diversity of trees and shrubs. There are two important indices to denote the diversity such as Shannon Wiener Index (H ) and Simpson Index (λ). Shannon Wiener Index (H ) value as 1.10 for trees, 0.85 for shrubs and 1.65 for herbs and Simpson Index (λ) values as 0.56 for trees, 0.48 for shrubs and 0.65 for herbs (Table 3.5.4). Life forms Table 3.5.4: Floral Diversity Index in Core and Buffer area Shannon Wiener Index (H ) Core Area Simpson Index (λ) Species Richness Shannon Wiener Index (H ) Buffer Area Simpson Index (λ) Species Richness Trees Shrubs Herbs Climbers Grasses 17 Hydrophytes Total Flora in Buffer Zone The plant resources of the buffer area account about 282 plants species belonging to 232 genera and 92 families. The predominant life forms includes Trees (77sp), Herbs (108sp), Shrubs (40sp), Climbers (128 sp), Grasses (17sp) and Hydrophytes (11sp). Detailed check list of flora in Buffer area is presented in Annexure-XXX), of which Leguminosae (40sp) was the most specious family followed by Poaceae (18sp), Acanthaceae (14sp) & Malvaceae (13 sp) (Table 3.5.5), which represent most of the vegetation is of non-forest flora KKB Envirocare Consultants Pvt. Ltd., Hyderabad
190 NATCO Pharma Ltd.,Chemical Divn.-Chennai-EIA Report Chapter 3: Description of Environment Table 3.5.5: Top 10 families of floral composition in buffer area Sl. No. Name of the Family No. of Species 1. Leguminosae Poaceae Acanthaceae Malvaceae Amaranthaceae Apocynaceae Lamiaceae Convolvulaceae 8 9. Rubiaceae Solanaceae 6 The concept of Importance Value Index (IVI) has been developed in order to express the dominance and ecological success of any species by a single value by laying 10 quadrates in each group. Among tree species Anacardium occidentale (16.68), Moringa oleifera showed highest IVI (13.06) followed by Peltophorum pterocarpum (12.52), Prosopis chilensis (10.29) and Syzygium cumini (9.81) (Table 3.5.6). These tree species were significant in occupying majority of space and resources being representing avenue plantation and agricultural habitat dominated the study area. Among shrubs, highest IVI was recorded in Vitex negundo (12.38), Cassia occidentalis (8.67), Calotropis procera (7.26) & Jatropha glandulifera (7.24) respectively (Table 3.5.7). Among herbaceous species, Tephrosia purpurea (11.42) followed by Sida acuta (10.21), Heteropogon contortus (8.8), & Scoparia dulcis (8.5) showed highest IVI in the buffer area (Table 3.5.8). IVI value of a species indicates its high regeneration capacity and greater ecological amplitude. The diversity values for different life forms like trees, shrubs and herbs showed that the area is more diverse. Here are two important indices to denote the diversity such as Shannon Wiener Index (H ) and Simpson Index (λ). The buffer area showed Shannon Wiener Index (H ) value as 1.98 for trees, 1.75 for shrubs and 2.20 for herbs and Simpson Index (λ) values as 0.56 for trees, 0.48 for shrubs and 0.65 for herbs (Table 3.5.4). Sl. No. Table 3.5.6: Top 10 Tree species showing highest IVI in Buffer Zone Name of the species Relative Density (RD) Relative Frequency (RF) Relative Abundance (RA) Importance Value Index (IVI) 1 Anacardium occidentale Moringa oleifera Peltophorum pterocarpum Prosopis chilensis Syzygium cumini Terminalia catappa Ziziphus oenopolia KKB Envirocare Consultants Pvt. Ltd., Hyderabad
191 NATCO Pharma Ltd.,Chemical Divn.-Chennai-EIA Report Chapter 3: Description of Environment Sl. No. Name of the species Relative Density (RD) Relative Frequency (RF) Relative Abundance (RA) Importance Value Index (IVI) 8 Phoenix sylvestris Pithecellobium dulce Soymida febrifuga Sl. No. Table 3.5.7: Top 10 Shrub species showing highest IVI in Buffer Zone Name of the species Relative Density (RD) Relative Frequency (RF) Relative Abundance (RA) Importance Value Index (IVI) 1 Vitex negundo Cassia occidentalis Calotropis procera Jatropha glandulifera Opuntia elatior Datura metel Cascabela thevetia Agave americana Pandanus fascicularis Caesalpinia pulcherrima Sl. No. Table 3.5.8: Top 10 Herb species showing highest IVI in Buffer Zone Name of the species Relative Density (RD) Relative Frequency (RF) Relative Abundance (RA) Importance Value Index (IVI) 1 Tephrosia purpurea Sida acuta Heteropogon contortus Scoparia dulcis Desmodium triflorum Hygrophila auriculata Aeluropus lagopoides Grangea maderaspatana 9 Launaea sarmentosa Argemone mexicana Crop diversity during the growing season is fairly good by Ground nut, Maize, Sorghum, Red gram, Green gram & others. Horticulture crops: Tomato, beans are cultivated predominantly. Fruit trees of Cashew Nut, Mango, Guava, Sapota, Lime are also grown extensively. Among the plantations and agro forests Eucalyptus and Subabul are prominent. The species diversity & species richness values of the buffer area reveal that the study is of homogenous in nature with mono cultivation practices. Vegetation prevailing in the region is of purely of non-forest flora which is common scenario in the district. Due to the presence of 3.50 KKB Envirocare Consultants Pvt. Ltd., Hyderabad
192 NATCO Pharma Ltd.,Chemical Divn.-Chennai-EIA Report Chapter 3: Description of Environment coastal belt, most of the buffer area is having majority of wetlands leading to moderate diversity values. More stress on the wetland habitat both in inland water bodies like steams, backwater creeks and sea, has been noticed still the diversity values are in moderate condition thriving for their existence Terrestrial Fauna The presence or absence of an animal or plant in a certain region depends on its ecological and geographical setting. Wild animals can exist in a region only if prevailing set of conditions are congenial for their survival and perpetuation. Diversity of the species and their abundance is largely dependent on the availability of required habitats. Terrestrial fauna of the Core area and the Buffer zone: As the animals, especially vertebrates move from place to place in search of food, shelter, mate or other biological needs, separate lists for core and buffer areas are not feasible. Though there are no reserved forests in the buffer zone, but open scrub forest followed by mangrove forms a small and isolated patch encouraging certain wetland bird s to prevail. There are no Sanctuaries, National Parks, Tiger Reserve or Biosphere Reserve or Elephant Corridor or other protected areas within 10 km radius from core area. It is apparent from the list that none of the species either spotted or reported is included in Schedule I of the Wildlife Protection Act. Some of the birds listed were rare locally but they do not fall under any of the REET categories Terrestrial fauna of the Core area As the area is already established with industry, very common fauna has been recorded. In the core zone no mammals were recorded during the study period. Where as in birds 4 species were recorded, species such as Plain prinia, Red vented bulbul & Common Babbler are the common species which are encountered during the survey period (Annexure-XXXI). In Herpeto fauna 3 species were recorded namely Common garden lizard, Common Indian bull frog & tree frog (Annexure-XXXII). Invertebrates, includes 2 species, common species are Common Mormon & Damsel fly are the common species (Annexure-XXXIII) Terrestrial fauna of the Buffer Zone In the buffer zone a total of 145 species of fauna were recorded of which Mammals 15 sp, Birds 62 sp, Reptiles 12 sp, Amphibians 4 sp, Invertebrates 32 sp & Fishes 20 sp (Table 3.5.9). Mammals includes Squirrel, Common Mongoose, Rhesus Monkey are the key stone species of the area (Annexure-XXXIV). The Reptiles represented with 12 species belonging to 2 orders & 4 families (Annexure-XXXV). 4 species of amphibians Tree Frog 3.51 KKB Envirocare Consultants Pvt. Ltd., Hyderabad
193 NATCO Pharma Ltd.,Chemical Divn.-Chennai-EIA Report Chapter 3: Description of Environment and South Indian Toad are common in occurrence (Annexure-XXXVI). Among the birds, 62 species are recorded, Important species of the area are Asian Palm Swift, Cattle Egret, Grey Heron, Black Kite, Small Green Bee-eater, Black Drongo & Pied kingfisher (Annexure- XXXVII). Table 3.5.9: Faunal composition in the study area Taxa No. of species Mammals 15 Birds 62 Reptiles 12 Amphibians 4 Fishes 32 Invertebrates 23 Total 145 Aquatic Fauna: Fishes are very important from the biodiversity of aquatic environment. Fish collection was made with the help of hand operated nests with the help of local fisherman s both in inland water bodies and sea. Information from local markets also gathered. A total of 20 species were recorded belonging to different orders Species like Tilapia, Murrel Catla & Rohu are the common species (Annexure-XXXVIII). In detailed herpetofauna include reptiles and amphibians consisting of two major orders namely squamata and anura. A total of 12 species of reptiles belonging to order squamata like Russell s viper, Cobra & Rat snake, order anura represents garden lizard and Common House Geko are common in occurrence. The invertebrates include 32 species of which Blue Pancy, Danaid egg fly. Plain Tiger and Common Mormon are common to the region (Annexure-XXXIX). The Species richness was high in birds ( 62sp) followed by invertebrates (32sp), herpeto fauna (17sp) and mammals (15 sp).the diversity values recorded high for birds (2.10) followed by invertebrates (1.10), Mammals (1.20) & herpeto fauna (0.75) while the evenness values are also observed in the similar trend (Table ). This clearly indicates that the area is supporting less species composition with moderate levels of energy transfer, predation, composition and niche availability. The checklist generated is based on the real time survey conducted and review of literature from the past 5 years. Table : Faunal diversity in the study area Taxa Shannan (H') Simpson Mean Mammals Birds Herpetofauna Invertebrates KKB Envirocare Consultants Pvt. Ltd., Hyderabad
194 NATCO Pharma Ltd., Chemical Divn.-Chennai-EIA Report Chapter 3: Description of Environment 3.6 Socio-economic Environment Introduction NATCO Pharma Limited, Chemical Division, Chennai proposes to expand its Active Pharmaceutical Ingredients (APIs) & Its Intermediate manufacturing unit with R&D facility in the existing plant premises land area of Ha ( sq.m). The Unit is located in R.S.Nos. 73/1A, 73/2, 74/7B, 78/1B, 79/1, 79/2B, 79/3, 79/4B, 79/5, 79/6A, 79/6B, 79/7, 80/1, 80/2, 80/3, 80/4, 84/1, 84/2, 84/3A, 84/5A, 84/6, 84/7A, 85/1, 85/2B, 86/2B, 86/2C, 86/2D2, 86/3B, 86/4, 86/5, 86/6, 86/7, 86/8, 86/9 of Manali Industrial Area, Thiruvottiyur Taluk (formerly Vaikkadu (V), Ambattur (Tq.)), Thiruvallur District, Tamil Nadu. The unit is located in Manali Industrial Area. Hence, there will be no Rehabilitation and Resettlement (R&R) involved. The nearest habitation village is about 0.25 km (W) from Andarkuppam village; about 0.9 km from Kanniyammanpettai village (W) and Manali Town at 1.6 km (S). The socio-economic study includes various facets, Viz., demographic structure, availability of basic amenities such as housing, education, health and medical services, occupation, water supply, sanitation, communication, power supply and places of tourist attraction, monuments of archaeological importance; and identifying, predicting and evaluating the likely impacts due to the proposed project activity in study area Baseline Status area: The following information is collected to define the socio-economic profile of the study 1. Demographic structure 2. Infrastructure Resources base in the study area 3. Economic attributes 4. Health status 5. Awareness and opinion of the people about the project The secondary data is compiled from authentic sources, Viz., District Primary Census Abstracts , Thiruvottiyur Taluk, (formerly Ambattur Taluk) Thiruvallur District, Tamil Nadu. The primary data was collected through; field survey as well as field observations were made during the site visit. Socio-economic survey was carried out on and in 11 villages of the study area. The survey was carried out through interviews/questionnaire/focused group discussions (FGD) and Grama Sabhas (Table ) Identification of villages falling in (Buffer Zone) study area of 10km radius (0-2km, 2-5km and 5-10km) was prepared from the 3.53 KKB Envirocare Consultants Pvt. Ltd., Hyderabad
195 NATCO Pharma Ltd., Chemical Divn.-Chennai-EIA Report Chapter 3: Description of Environment periphery of the proposed project site with combined Taluk and Districts map of Tamil Nadu Administrative Atlas Table 3.6.1: Socio-economic Surveyed Villages Sl. No. Description 1 Manali New Town 2 Manali (M) 3 Kadapakkam 4 Sadayankuppam 5 Elandancheri 6 Ariyalur 7 Kosapur 8 Chinnasekkadu (TP) 9 Thiruvottiyur (M) 10 Madhavaram (M) Name of the Taluk & District Thiruvottiyur & Madavaram Taluks, Thiruvallur District Ponneri - Taluk, 11 Vallur Thiruvallur District Source: Tamil Nadu Administrative Atlas 2011 Distance from project site (km) 0-2km 2-5km 5-10km Demographic Structure The project site is situated in Manali Industrial Area, Thiruvottiyur Taluk, (formerly Ambattur Taluk) Thiruvallur District, Tamil Nadu. The study area is falling under 3 Taluks Viz.,Thiruvottiyur, Madavaram and Ponneri under Thiruvallur District and Chennai Municipal Corporation, part of Chennai District of Tamil Nadu. The demographic details in study area were collected from District Primary Census Abstracts , Madavaram, Thiruvottiyur and Ponneri taluks of Thiruvallur District and Chennai Municipal Corporation, part of Chennai District Tamil Nadu. There are 36 rural villages, 3 Municipalities (M), 3 Town Panchayats (TP), 7 Census Towns and Chennai Municipal Corporation falling in the study area. The summary of the demographic details such as number of households, sex ratio, percentage of SC & ST population and occupational pattern is presented in Table The study area village wise demographic details covering total population, population structure, Viz., Scheduled Caste & Scheduled Tribe population and number of literates etc. is presented in Annexure-XL. The number of households, population and main & marginal workers including non-working population in study area is presented in Annexures-XLI and XLII respectively KKB Envirocare Consultants Pvt. Ltd., Hyderabad
196 NATCO Pharma Ltd., Chemical Divn.-Chennai-EIA Report Chapter 3: Description of Environment Table 3.6.2: Summary of Demographic Structure Demographic Parameters No s No. of Districts 2 No. of Taluks 3 No. of Villages 36 Town Panchayat 3 Census Towns 7 No. of Municipalities 3 No. of Municipal Corporation 1 No. of Town Panchayats 3 Total no. of Households Total Population Sex ratio (No. of females/thousand males) Scheduled Castes 20.17% (417296) Scheduled Tribes 0.28% (5891) Literate (except 0-6 years population (220348)) 87.73% ( ) Total Working population (Among the total population) 37.54% (776727) Main Workers (among total working population) 86.82% (674331) Marginal Workers (among total working population) 13.18% (102396) Non-Workers 62.46%( ) Source: District Primary Census Abstracts-2011, Thiruvallur and Chennai Districts, Tamil Nadu. The salient features of the study area are as follows: There are 36 rural villages, 3 Municipalities, 3 Town Panchayats, 7 Census Towns are falling in the study area. Covering 3 Taluks: Thiruvottiyur, Madavaram and Ponneri and 2 Districts Thiruvallur and Chennai Municipal Corporation- 43 wards of Chennai District, Tamil Nadu. Total population of villages in study area is in which the male population is (50.26%) and the female population is (49.74%). This shows that the male population is high than the female population. Among the total population 0.28% (5891) consists of Scheduled Tribes, 20.17% (417296) of the Scheduled Caste population. Sex ratio (No. of females per 1000 males) is which indicates that females are less in number than the males in the study area. Literacy level in the buffer zone is 87.73% (Total population >6 years ) (Total Literates ), among the total literates 52.51% (851556) are males and 47.49% (770211) are females. The working population rate is 37.54% (776727) among the total population KKB Envirocare Consultants Pvt. Ltd., Hyderabad


197 NATCO Pharma Ltd., Chemical Divn.-Chennai-EIA Report Chapter 3: Description of Environment Among the total workers, Main workers are %( ), Marginal workers are %( ). The study area had an average family size of 4.05 persons per house. The buffer zone population break-up, literacy rate, SC&ST population and Occupational Structure of workers of the buffer zone are depicted in Charts to % Population Distribution 50.26% Source: Data Census of India 2011 Total Male Population Total Female Population Chart 3.6.1: Total population in study area is in which the male population is (50.26%) and the female population is (49.74%). This shows that the male population is high than the female population. (Chart 3.6.1) Sex ratio (No. of females per 1000 males) is which indicates that females are less in number than the males in the study area. Chart The Chart shows that the percent Literacy Literacy Percentage level in the study area is 87.73% (Total population >6 years ) (Total Male Literacy Literates ), among the total literates 47.49% Rate 52.51% 52.51% (851556) are males and 47.49% Female (770211) are females. The company needs to Literacy Rate support education and vocational trainings as a part of CSR, which will generate alternate Source: Data Census of India 2011 source of income generation in the study area, which improves the standard of living of the population. Chart: % 0.28% Percentage of SC, ST and Other Population 79.55% Source: Data Census of India 2011 % of SC Population % of ST Population % of others Vulnerability Groups: Among the total population Percentage wise 20.17% of Scheduled Caste (SC), and 0.28% of Scheduled Tribe (ST), 79.55% of other population and shown in the Chart In Thiruvallur District Scheduled Caste population is 22.04% and Scheduled Tribe is 1.27% population respectively KKB Envirocare Consultants Pvt. Ltd., Hyderabad
, Marginal workers are 13.18 % (102396).")
198 NATCO Pharma Ltd., Chemical Divn.-Chennai-EIA Report The Chart shows that the percent of total workers are 37.54% (Total working population ) i.e. main and marginal workers in the study area. Among the total workers, Main workers are 86.82% (674331), Marginal workers are % (102396). The socio-economic analysis of the Study area shows less work participation compared with the District Thiruvallur working population is 41.26%. Chapter 3: Description of Environment Chart Occupational Structure of the Buffer Zone 13.18% 86.82% Main workers Marginal workers Source: Data Census of India Infrastructure Facilities The infrastructure resources based on 36 rural villages, 3 Town Panchayats, 7 Census Towns of Thiruvallur District and Chennai Municipal Corporation, Chennai District, Tamil Nadu are falling in the study area. In the study area with reference to education, medical facility, water supply, transportation, communication facility and power supply etc. are compiled from Village Directory Census 2011 of Tamil Nadu State and presented in Annexures-XLIII and XLIV. The other infrastructural facilities in the study area are presented in Annexure-XLV. Education: 64 Pre-Primary Schools, 58 Primary Schools, 24 Middle Schools, 15 Secondary schools, 4 Senior Secondary Schools, 1 Degree College,1 Polytechnic Collage, 21 Adult Literacy Centres facility in 36 rural villages and in addition to Senior secondary, Degree, Engineering colleges, Vocational Training centers, it is (Industrial Training Institutes), Polytechnic colleges available within 10km of urban study area and surroundings of the project site with good connectivity road transportation and available educational facilities in Chennai city. Medical facilities: 11 CHC, 7 PHC, 23 PHSC, 7 Maternity and Child Welfare Centers, 7 TB Clinics, 7 Civil dispensary, 5 Veterinary Hospital facilities available in among the 36 rural villages and 1 PHC in Manali new town, 1 Urban Health Center Manali Industrial area in addition to Rajiv Gandhi Government General hospital, Government General hospital facilities available in Chennai city. Drinking Water: All 36 rural villages have the drinking water facility with tap: 36, well: 28, Bore well: 19, hand pump: 9, as per the secondary data, 28 villages have well; available 3 Ponds, in 28 villages have treated tap water, for urban wards drinking water facility available from Chennai Metropolitan Water Supply and Sewerage Board (CMWSSB) KKB Envirocare Consultants Pvt. Ltd., Hyderabad
199 NATCO Pharma Ltd., Chemical Divn.-Chennai-EIA Report Chapter 3: Description of Environment Water facilities for Agriculture: All the 36 villages available 3 water bodies or Ponds, 1 seasonal river available, irrigation through tanks, tube wells and open wells are very common in the study area. Main Crops: Paddy, Green gram, Red gram, Block gram and Sugarcane, Groundnut, Fruit farms Banana, water melon and Spinach green vegetables; paddy is the Principal crop in the study area. Communication: 36 villages 2 post offices, 13 Sub Post Offices, 33 Public Call Offices and all the villages and urban part have Mobile phone coverage service in the study area. Transportation: In 36 rural villages available Public Buses and Autos transport facilities available, 22 villages had Village Approach Road within the less than 5km distance, 11 villages had more than 5km distance, 1 National Highway No.16-Chennai- Kolkata (Previously NH-5); 1 State High way passing through the study area, located Thiruvottiyur railway station and Harbour (Chennai Port) in the study area. The entire study area has a well-developed road network connecting the industrial area with national/state highway, sea port and airport. A large fleet of heavy and light commercial vehicles is perennially present in the Manali Industrial Area. Banks: In 36 rural villages available 2 Cooperative Banks, 2 Commercial Banks, 2 ATMs in urban all the Commercial, Corporate Banks, ATM services are available in the study area. Power Supply: All the villages are electrified in the study area. SHGs: Self - Help Group available in 34 rural villages and in urban part the study area Economic Activity The main economic base of the villages within the study area is agriculture. Out of the total working population (776727), the main workers are The main crops grown in the region are Paddy, Green gram, Red gram, Block gram and Sugarcane, Groundnut, Fruit farms Banana, water melon and Spinach green vegetables etc. The employment pattern of the study area is described below: The working population rate is 37.54% (776727) among the total population. Among the total workers Main workers population in the study area is i.e %, Marginal workers population in the study area is i.e % People in the region are mostly engaged in agricultural activities and employment regular, contract and daily based industries in Manali i.e., (NATCO Chemical Division, Baler Lawrie 3.58 KKB Envirocare Consultants Pvt. Ltd., Hyderabad
200 NATCO Pharma Ltd., Chemical Divn.-Chennai-EIA Report Chapter 3: Description of Environment & Co Ltd, Chennai Petroleum Corporation Ltd, Cetex Petrochemicals Ltd., Indian Additives Ltd, IOT infrastructure & Energy Services Ltd., Kothari Petro Chemicals Ltd., Madras Fertilizers Ltd., Manali Petro Chemicals, SRF Ltd., Tamil Nadu Petro Products Ltd., in Manali, Toshiba JSW Power System Pvt. Ltd., Supreme Petro Chemicals Ltd., Manali New Town, Coromandal International Ltd., Piramal health Care Ltd., at Ennore Chennai etc. Unemployment level is high in the region as non-worker population share higher percentage which is about 62.46%. ( ) Compare with the working population of the study area (Total working population 37.54%) with Thiruvallur District (The Thiruvallur District working population is 41.26%) as per census data 2011 respectively. Industry is the key driver of economic development across the entire Thiruvottiyur Block including the project area. The block is one of the most dynamic industrial hubs of Tamil Nadu and is the home for a number of leading firms across diverse industry groups. Over the past three decades, rapid industrial growth in the area has contributed to the development of alternative livelihoods. Most of the population in the area depends on the industry sector for sustainable livelihood. The industry base in the area is dominated by large and medium enterprises engaged in the production of products as diverse as auto components, defense equipment, engineering goods, petrochemicals, PVC compounds and leather goods. Besides, a large number of survivalist and growth micro enterprises exist essentially as self-employment ventures. Micro enterprises engaged in engineering workshops, steel fabrication, automobile repairing, electrical appliances servicing, bicycles repairing, readymade garments sales outlets, restaurants, tea and Tiffin centers, fast food kiosks, tailoring shops, trash dealers are widely noticed and do brisk business. The villagers and village heads suggested that provide vocational trainings, skill development programs in agriculture and non-agriculture that relevant to the industries requirement technical trainings and employment opportunities in IDA, Manali. The Industries preference should be given fist for the nearby villagers Health Status Health of the people is not only a desirable goal, but it is also an essential investment in human resources. As per the National Health Policy, Primary Health Care has been accepted as main instrument for achieving this goal of development and strengthening rural health infrastructure through a three-tier system, viz., Primary Health Centre (PHCs), Sub-Centre and Community Health Centres, which have been established. Lack of building, shortage of 3.59 KKB Envirocare Consultants Pvt. Ltd., Hyderabad
201 NATCO Pharma Ltd., Chemical Divn.-Chennai-EIA Report Chapter 3: Description of Environment manpower and inadequate provision of drug supplies are hampering the operationalization of these units. During discussion with the medical officers at PHC, Manali new town and Urban Health Center Manali, TB Clinics/TB Microscopic centers and other medical practitioners, it was gathered that the general prevailing diseases are respiratory diseases like Asthma, skin allergies, cough, joint pains, gastro intestinal problems, Malaria, Dengue, Skin diseases, seasonal diseases and other water borne diseases like diarrhea, typhoid and Chronic diseases like Leprosy, Tuberculosis, HIV/AIDS has also been reported which all could be attributed due to improper maintenance of drainage and sanitation system, lack of health awareness and poverty among the migrants and local people. Drainage System: 31 villages closed and 5 open drainage system existed, in urban areas open and closed drainage system existed. Archaeological monument: There are no archaeological monuments in the study area Awareness and opinion of the people about the project: Most of the respondents are aware about industry and the respondents have positive opinion, expecting employment and infrastructure development in their Colonies/villages from the proposed expansion project Socio-Economic Survey Methodology In order to assess and evaluate the likely impacts arising out of any developmental projects on socio-economic environment, it is necessary to gauge the apprehensions of the people in the project area. Socio-economic survey serves as an effective tool for fulfilling this requirement. Socio-economic survey through interviews/questionnaire/focused group discussion (FGD) and Grama Sabhas was conducted in 11 villages of the study area. Sarpanch, ward members, school teachers, medical practitioners, self-help group members and village youth and other respondents (adult s male-female) are involved for awareness and opinion, by using judgmental or purposive sampling methods representing different socio-economic sections of the community. The respondents were asked for their awareness/opinion about the project, job opportunities, drinking water, road and drainage construction, education, health care, housing, transportation facility and economic status. The villages selected for socio-economic survey based on the impact prone with reference to the industry activities; 11 villages from within the 10kms radial study area i.e., 5 villages from 0-2 km; 5 villages from 2-5 km and 1 village from 5-10 km (Table 3.6.1) KKB Envirocare Consultants Pvt. Ltd., Hyderabad
202 NATCO Pharma Ltd., Chemical Divn.-Chennai-EIA Report Chapter 3: Description of Environment Salient observations recorded during the survey Primary data collected from gram panchayaths, Nagar panchayaths and Municipal corporation records and also from village heads, ward members, Corporators and Municipal commissioners during interactions w.r.t. demographic details is more or less the same with that of the secondary data Primary Census Abstract (PCA) Most of the respondents including village level heads are educated up to primary/secondary level especially women. Mainly LPG, cow dung and wood is used as fuel for cooking purpose. Drinking water supplies from Chennai Metropolitan Water Supply and Sewerage Board (CMWSSB) in surveyed villages and found it is very inadequate. All the surveyed villages are electrified. In rural villages of the study area agriculture is practiced in two seasons Alternative livelihood is regular, contractual employment and daily labour in nearby industries, petty business like kirana shops, Tea Tiffin centers and Pan Shops, autos/taxis driving etc. IDA, Manali and its ancillary industries are the best source for employment to nearby villagers. Manali new town, Chennai Petrochemical Corporation Limited (CPCL) nagar, Manali, Burma Nagar is the residential areas of the IDA employees. During the discussion with (Sadayankuppam village) village head and villagers reported that they belongs to fisher folk community their main occupation and livelihood is marine fishing is a traditional livelihood, it is gradually diminishing because of the large scale industrial and infrastructure development in the area, in the future marine ecology and the fish catch will be no longer a remunerative livelihood for them. Most of the population avail the health facilities within the study area in Primary Health Centre (PHC), Manali new town, Urban Primary Health Center facility at Manali, Maternity & Child Welfare Centre, Civil Dispensary and Primary Health Center in Vichoor, in addition to Government General Hospital facilities available in Chennai city. Community people lack in health awareness and poor health infrastructure observed in the study area. In surveyed nearby villages (CPCL nagar, Burma nagar, Manali new town) of IDA, Manali migrants are more and working in the industries and established their ancillary business. Respondents said that the land prices are and house rents are very high KKB Envirocare Consultants Pvt. Ltd., Hyderabad
203 NATCO Pharma Ltd., Chemical Divn.-Chennai-EIA Report Chapter 3: Description of Environment Most of the respondents including Self Help Group members expressed about their unemployment and vocational trainings like tailoring, netting home made products etc. Lack of technical education and skills among youth and villagers. Respondents expressed to improve village roads, streetlights, drainage & sanitation and infrastructure facilities. Literacy level, housing and primary amenities are poor in SCs, STs Population locality and identified poor families. Existing project site is maintaining good environment friendly condition. Agriculture and allied activities is not a diminutive source of livelihood in the study area. Cultivation activities are going on all within less than a km from the boundary of the proposed expansion project. Poor condition and lack of toilets and water, infrastructure facilities in Govt. Schools and Anganwadi Centers. People responded their fear regarding the flood and they are expecting the alertness/ forecast information and management system of the natural disasters management. Agriculture and allied activities is not a diminutive source of livelihood in the study area. IDA, Manali is the key driver of economic development across the entire Thiruvottiyur Taluq including the project area. IDA, Manali is a hub for high density with four wheeler/trucks from the various places from the all over the country for import and export of the goods While interaction with the truck drivers, cleaners and migrant workers observed among them the gap of health awareness especially Tuberculosis and HV/AIDS, the same information repeated in the health centers Project Awareness and Feedback from Respondents Queries were made to the local people of surveyed villages, regarding their awareness about the existing project in general, and their apprehensions about the expansion project in particular. During discussion the following observations were recorded: Most of the respondents are aware about the proposed project expansion activity. As the economic condition of the people in the region is poor. Labour and migrants, people are mostly in favor of the proposed expansion project and they are requesting to provide the technical skills and employment KKB Envirocare Consultants Pvt. Ltd., Hyderabad
204 NATCO Pharma Ltd., Chemical Divn.-Chennai-EIA Report Chapter 3: Description of Environment From the surveyed 11 villages (Manali New Town, Sadayankuppam, Kadapakkam, Manali, Elandancheri, Chinnasekkadu, Madhavaram, Ariyalur, Kosapur, Vallur and Tiruvottiyur) unemployed youth around 3843 both men and women persons qualified with 10thclass, Intermediate, Degree, ITI- Welders and Plumbers, Electrical, Engineering, Pharmacy and Computers etc., expecting for technical education and employment from the proposed expansion project. Human Resource Available in Studied Villages: Qualification <10th 10th Intermediate Degree PG Engg/Poly tech/ Com puters Pharmacy ITI B.Ph. M Ph. Electrical Welder Plumber Male Female Source: Village level primary survey Buffer zone of the project area unemployed population is 62.46% which are covering in the project area most of the unemployed youth educated up to primary and secondary level and they also lack in any technical or vocational training skills, so the youth are deprived of employment opportunities. The villagers and village heads suggested that vocational trainings, skill development programs in agriculture and non-agriculture activities and employment opportunities in IDA, Manali Industries, and preference will be given to the nearby villagers. As regards proposed expansion of Active Pharmaceutical Ingredients (APIs) & Its Intermediate manufacturing unit with R&D facility in the existing plant premises land area of Ha ( sq.m). Respondents gave favorable opinion about project activity as it may lead to increase in infrastructural facilities, and job opportunities. Total Greenbelt area is 3.51 Ha (33.2% of Ha). In addition industry has given 1.05 Ha (10%) for Open Space Reservation (OSR) land for Greenbelt. Industry also developed the lawn in an area of 0.39 Ha (3.7% of Ha). Women respondents awareness regarding project is good but when informed they are positive because they thought that due to the expansion project activity, economic condition of the region will improve and the same time they raised that industry it should not spread pollution by its activities in their fields and villages/colonies. Most of the respondents expressed construction of check dams and ponds to store the rain water and develop more green belt in this area KKB Envirocare Consultants Pvt. Ltd., Hyderabad
205 NATCO Pharma Ltd., Chemical Divn.-Chennai-EIA Report Chapter 3: Description of Environment Construction of Community halls, library, building for schools, Anganwadi centers, water and toilet facilities for the schools, drinking water facilities for surrounding villages/colonies in addition to cremation ground, boundary walls to school, Anganwadi schools and PHCs Mobile clinic, Village approach roads, drainage system, renovation of temples and construction of bus shelters at bus stops and arrange street lights. Provide books, school bags, uniforms and other requirements for financially poor children therefore the proposed project need to focus on education and more on girl child and women and adult education facilities, encourage the students and teachers. Conduct Health camps, Health awareness on HIV/AIDS and Tuberculosis, alcohol deaddiction camps especially IDA, Manali Industrial area and its surrounding colonies and villages. Provide the vocational trainings for SHGs, youth especially SC and ST community and poor people Corporate Social Responsibility The project proponent is undertaking activities in peripheral villages since The proponent has been fulfilling its social responsibility to the surrounding community through promoting, flood Relief activity, environment protection, mass plantation, donations to orphan school, health, education, drinking water, cultural and sports and building rural infrastructure etc. through Manali Industrial Association (MIA) and NATCO. The proponent has provided the welfare measures to residents of nearby villages. Social welfare activities are presented below KKB Envirocare Consultants Pvt. Ltd., Hyderabad
 during 2015 2017 Activity Natco Pharma Limited has joined in Flood")

206 NATCO Pharma Ltd., Chemical Divn.-Chennai-EIA Report Chapter 3: Description of Environment CSR Initiatives Implemented by NATCO and Manali Industrial Area (MIA) during Activity Natco Pharma Limited has joined in Flood Relief activity in Chennai, Dec & distributed Food materials & clothes to about 1000 families - accounting to nearby 5 villages. About 800 sets of School uniforms has been distributed to the Government schools in and around Manali new town area Beneficiary Details Andarkuppam, Manali New town, Kamarajapuram, Kanniammanpettai, Ellenthanur & Rajiv Gandhi nagar). Expenditure (Rs.) CSR Activities By NATCO (2015) Rs Lakhs Photos Purchase & supply of about 2000 Saplings to MIA Companies for Environment Day function by MIA Industries in Manali Industrial Association (MIA) CSR Activities By MIA (2015) Rs Lakhs KKB Envirocare Consultants Pvt. Ltd., Hyderabad

 AndarKuppam, Manali New Town, Manali. (350 families approx.) Burma Nagar, Manali New Town, Manali. (750 families approx.) Sadayankuppam, Manali New Town, Manali. (300 families approx.")
207 NATCO Pharma Ltd., Chemical Divn.-Chennai-EIA Report Chapter 3: Description of Environment Activity In the month of December, 2015, the whole of Chennai was affected badly and many people lost their property and even basic amenities. At this time of crisis, MIA distributed sarees and Lungies for people who were affected in Flood By MIA Beneficiary Details Periyar Nagar village (500 families approx.) AndarKuppam, Manali New Town, Manali. (350 families approx.) Burma Nagar, Manali New Town, Manali. (750 families approx.) Sadayankuppam, Manali New Town, Manali. (300 families approx.) Erular Kuppam, near Sadayan Kuppam, Manali (50 families approx.) Chinnambedu village, Sholavaram ondriyam. (100 families approx.) Expenditure (Rs.) Rs Lakhs Photos Mass plantation, contribution CSR-Green - By MIA Purchase & supply of about 2500 Saplings to MIA Companies for Environment Day function by MIA Donation handed over to District Collector/ Chairman, DRDA, Tiruvallur Industries in MIA Rs Lakhs Rs Lakhs CSR Activities By MIA (2016) KKB Envirocare Consultants Pvt. Ltd., Hyderabad
 Photos MIA, organized medical camp for the people residing in and around manali area, and students of Govt.")

208 NATCO Pharma Ltd., Chemical Divn.-Chennai-EIA Report Chapter 3: Description of Environment Activity Beneficiary Details Expenditure (Rs.) Photos MIA, organized medical camp for the people residing in and around manali area, and students of Govt.Public school at Manali Andarkuppam area, National hospital send medial team including doctors and their assistance for the medical camp by MIA People residing in and around Manali, Andarkuppam, Manali New town and there are about 150 students are benefited. Rs Lakhs 200 Nos of food packets are supplied to volunteers to clean up seashore.- (during oil spillage in Ennore port) by MIA Donation given to Manimegalai women's orphanage welfare trust by MIA Purchase & supply of about 2500 Saplings to MIA Companies for Environment Day function by MIA All volunteers involved in the activity CSR Activities By MIA (2017) Rs Lakhs Welfare Trust Rs Lakhs Industries in MIA Rs Lakhs Source: NATCO Pharma Limited, Chemical Division, Chennai KKB Envirocare Consultants Pvt. Ltd., Hyderabad
209 NATCO Pharma Ltd., Chemical Divn.-Chennai-EIA Report Chapter 3: Description of Environment Floods in Chennai during 2015 On December 1, 2015, in just a span of 12 hours, Chennai has received a record breaking 272 mm of rainfall. The city s normal rainfall for December stands at 191 mm. Not only this, Chennai has also broken over a 100-year-old 24 hour rainfall record. Previously, on December 10, 1901, Chennai had recorded mm rainfall in a span of 24 hours. Chennai has also broken monthly rainfall record of December The worst experience met by Chennai people after six decades during the start of December month. The Chennai has received heavy rain during 30/11/2015 to 3/12/2015. M/s NATCO Pharma limited, Chennai affected due to heavy rain fall on 1/12/2015. Since November 30, 2015 night heavy downpour started and the 3 shifts were in operation on 01/12/2015, information received through news channels that the Puzhal & Poondi Lake has released the water from their reservoirs. Due to this, water flow has increased in the roadside gutters/channels and slowly water has started entering into the plant premises through front main gate & rear gate. The water level has increased drastically and water current also too high and stopped the man movement activity internally. Since the water level touches the brim level of the PCC room and electrical system shutdown has done and Emergency shutdown procedures are initiated in the production and other service areas. All the hazardous wastes are shifted to safe area. At that time water level reaches upto 6 feet height in the premises. The plant staff, Contract workers are assembled in one place and stayed at the first floor in safe condition at production and admin building and food supplies are provided. All the peoples are rescued in boat by Rescue team Police man by 03/12/2015. On 05/12/2105, the water was getting drained slowly and one feet water level was flowing inside the plant and NATCO Emergency response Team entered the plant premises to access the damage and found all the furniture s, engineering items, Power house panels, ETP online Instruments, pumps, motors, electrical appliances, records, raw materials, computers etc., in the ground floor are affected and damaged. Next day NATCO team has entered the plant and started the cleaning activity and all the areas were disinfected & cleaned. Plant has normalized after 15 days KKB Envirocare Consultants Pvt. Ltd., Hyderabad
210 Chapter 4 Impact Assessment & Mitigation Measures
211 [ NATCO Pharma ltd.-chemical Divn.-Chennai-EIA Report Chapter 4: Impact Assessment & Mitigation Measures Chapter 4 Impact Assessment & Mitigation Measures 4.0 Introduction The environmental impacts can be categorized as either primary or secondary impacts. Primary impacts are those, which are attributed directly to the project and secondary impacts are those, which are indirectly induced and typically include the associated investment and changed pattern of social and economic activities by the proposed action. This chapter presents identification and appraisal of various impacts from the proposed expansion of APIs & its intermediates manufacturing unit in the study area based on the inventory of pollution sources as well as the baseline setting described. The impacts have been assessed for the proposed expansion project assuming that the pollution due to the existing activities has already been covered under baseline environmental monitoring. The proposed expansion project is likely to create impact on the environment in two distinct phases: During the construction phase, which may be temporary and short term; and During the operation phase that would have long-term effects. The construction and operation of the proposed expansion unit comprises various activities each of which may have an impact on some or other environmental parameters. Various impacts during the construction and operation phase of the expansion project on different components of environment have been studied to estimate the impact on the environment and are discussed briefly below and elaborated in the subsequent sections. 4.1 Prediction of Impacts during Construction Phase Air Environment There is no major construction activities involved in the proposed expansion project. Construction activities include the activities related to production blocks and other related 4.1 KKB Envirocare Consultants Pvt. Ltd., Hyderabad
212 NATCO Pharma ltd.-chemical Divn.-Chennai-EIA Report Chapter 4: Impact Assessment & Mitigation Measures structures; and erection of mechanical equipment s and installation of other equipment in a short period after approval from MoEF&CC & TNPCB. The sources of air emissions during construction phase will be due to development of site, emissions from vehicles used for transportation of men and materials and emission from construction equipment s. These activities are likely to result in emission of SO 2, NO 2, CO and Particulate matter. However, the quantity of these will be very negligible and that too only for a very short period. Hence no adverse impact on air quality is likely to occur. Traffic at the site during construction will be less intensive and heavier than at present and in normal operating conditions. In turn, it will subject roads to little more stress. This will be temporary and reversible in nature and restricted to small area for short duration. Proper upkeep and maintenance of vehicles, sprinkling of water on roads and construction site are some of the measures that would greatly reduce the impacts during the construction phase. All internal roads of the industry are Black Top / Concrete roads. There will be no impacts due to construction activity of this industry Noise Environment Noise will be produced by the activities involve in construction. Source of noise will be transport of materials via vehicles, machinery, construction activities etc. The general noise levels due to construction activities may go sometime up to 80 db (A) at the work site for short period in day time during construction phase. The workers in general are likely to be exposed to an equivalent noise level of db (A). In order to protect the workers all statutory precautions will be implemented. Use of proper personal protective equipment (PPE) will further mitigate any adverse impact of noise to the workers. Further careful planning of machinery operations and scheduling of operations will be done to minimize the impact of the noise generated. Machinery will be allowed to use for construction purpose only during daytime. Impacts on the noise levels of the area will be temporary in nature and vary inversely with the increasing distance from the plant site Water Environment Wastewater generated during construction will be only domestic waste, which will be collected in sewage collection tank through pipelines and septic tank. Overflow of septic tank will be sent to ETP for treatment. The overall impact on water environment during construction phase due to proposed expansion project is likely to be short term and insignificant. There seems no impact on the water environment of the study area. 4.2 KKB Envirocare Consultants Pvt. Ltd., Hyderabad
213 NATCO Pharma ltd.-chemical Divn.-Chennai-EIA Report Chapter 4: Impact Assessment & Mitigation Measures Land Environment Any construction of additional infrastructure will lead to permanent change in land use pattern at the site as a direct impact. No major changes in land use pattern will occur due to the project activities. The construction activities will result in loss of topsoil and earthen material to some extent in the plant premises. However, it is proposed to use the soil and earthen material in existing greenbelt development. An extent of 3.51 Ha (33.2%) green belt excluding open space reservation land area of 1.05 Ha (10%) has been developed out of total area of Ha. No solid or hazardous waste will be generated during construction thus no impact on soil environment is likely. There will be no impact on soil of the study area located beyond the working area of the plant site Biological Environment During construction there will not be any cutting of natural vegetation. The removal of vegetation from the soil and loosening of the topsoil generally causes soil erosion. However, such impacts will be confined to the project site and will be minimized through paving and water sprinkling. However, greenbelt has already developed in the plant facilities. Thus, there will be no major adverse impacts are envisaged on ecological environment due to proposed expansion activities Socio-economic Environment Construction will require man power and people from nearby villages will be employed for this. Construction in plant will provide temporary but source of income to the people. Noise generated will be the major pollution to which workers will be exposed to, during construction. Personal protective equipment s like earmuffs etc. will be provided to prevent any occupational health hazard. Since Industry located about 0.25 km away from habitation (Andarkuppam village), no negative impacts of the plant activity will be there on society during construction phase Impacts of Material Transportation Unloading areas of raw material and loading finished products are closed/ covered in order to decrease the air pollution in the nearby areas and hazards that it might cause due to the dust. Maximum amount of air pollution is generated in handling of furnace oil (fuel for boiler), to mitigate this impact. To avoid any impact due to transport, all the trucks will be environment emission standard compliant and the Goods will be fully covered and ensured that no spillage will be there during transport. The roads within the project site are BT/Cement Concrete and are properly maintained by the Industry. The one of the road connecting the project site with nearest 4.3 KKB Envirocare Consultants Pvt. Ltd., Hyderabad
214 NATCO Pharma ltd.-chemical Divn.-Chennai-EIA Report Chapter 4: Impact Assessment & Mitigation Measures highway is Black top road. The following specific actions will be ensured to minimize the impact due to transport. Use all the trucks with environment compliant emission and emission level will be checked half yearly or as per prevailing laws of the land Bulk load carrying capacity trucks will be used to maximum extent possible Hydraulic loading and unloading facility will be practiced as much as possible There will not be any spillage allowed from the trucks Roads will be swept at regular intervals to keep premises clean and to minimize the dust generation Surface of the Roads will be regularly repaired to avoid any ditches, pits etc. Traffic speed will be maintained within 15 kmph within plant premises Avenue plantation will be done on both the sides of the approach road Prediction of Impacts on Vehicular Traffic There is no unauthorized shop or settlements along the road connecting the plant site. The traffic density of the nearest highway is high mainly commercial and passenger vehicle traffic. Raw materials and finished products are transported by road using road trucks. The additional traffic generated due to the expansion will be about 23 truck / bus trips per day to the plant. Total truck / staff bus trips after expansion will be 32 nos. Traffic signs are placed in the battery limit. The drivers of vehicles will be provided with TREM cards. There will be marginal increase in the traffic density Storm Water Management Based on the rainfall intensity of the plant area, storm water drainage system has been designed. Storm water drainage system consists of well-designed network of open surface drains connecting to rainwater harvesting tank and pits so that all the storm water is efficiently drained off to stream without any water logging Rain Water Harvesting System Project Management is making proper utilization of rainwater by harvesting by appropriate rain water-harvesting mechanism. Rainwater from surface areas will be harvested by construction of harvesting tank and pits for the storm water drainage network at a definite pitch. Artificial recharge measures like rain water-harvesting helps to improve the ground water table, which augments the yield of bore wells. 4.4 KKB Envirocare Consultants Pvt. Ltd., Hyderabad
215 NATCO Pharma ltd.-chemical Divn.-Chennai-EIA Report Chapter 4: Impact Assessment & Mitigation Measures 4.2 Prediction of Impacts during Operation Phase Prediction of environmental impacts is the most important part of EIA study as it provides quantitative information related to projection of possible environmental consequences / impacts from a proposed expansion project well in advance, i.e. prior to its implementation based on the estimated pollution loads and surrounding local conditions, viz. topography, existing environmental quality, type of effluent etc. Several mathematical / statistical techniques and methodologies are available for predicting impacts from any proposed developmental project on the surrounding physico-chemical, ecological and socioeconomic components of environment. The results obtained from the predictions are to be super imposed over the baseline (pre-expansion project) status of environmental quality to derive the ultimate (post-project) scenario of environmental quality in the project study area. The quantitative impacts derived through predictions are also essential to delineate pragmatic environmental management plan, especially pollution mitigation measures required to be implemented at different stages of proposed expansion project, i.e. detailed engineering stage, construction and operation phases for minimizing the possible adverse impacts on the surrounding environment. The following activities related to operation phase will have various impacts on the environment and are considered for impact assessment: Topography and Climate Air quality Noise levels Liquid effluent generation Hazardous /Solid Waste generation Ecology Demography and Socio-economics Transportation Public Health and Safety Impact on Topography and Climate The major topographical changes envisaged would be manmade structures like erection of production blocks, civil structures, water / wastewater storage tanks, etc. However, it will also invite some positive benefits in the form of developed greenbelt in the plant premises. From the proposed project the impact on the climate due to the exhaust gas temperature will be envisaged. The maximum temperatures of the exit gas from the stack will be restricted to C during normal conditions. Normally, this will not cause any thermal 4.5 KKB Envirocare Consultants Pvt. Ltd., Hyderabad
216 NATCO Pharma ltd.-chemical Divn.-Chennai-EIA Report Chapter 4: Impact Assessment & Mitigation Measures imbalance. Impact on the climatic conditions from the proposed plant will be marginal which can be nullified / reduced by existing green belt Impact on Air Quality The main raw materials required for the proposed project are various chemicals, solvents, etc., for production of APIs and its intermediates, Furnace oil for boiler & Diesel for DG sets. The main sources of pollution envisaged from the proposed project are as follows. 1. Fugitive emissions 2. Process emissions 3. Boiler & DG set emissions (Flue Gas) 4. Incinerator emissions Fugitive Emissions and Mitigation Measures Fugitive emissions from solvents handling & recovery are expected from the reactors in the workroom, storage tanks area and as well as from handling area. Product wise solvent usage, losses and recovery are estimated based on the material balance (Table 2.16). The solvent wise usage, its losses and recovery for maximum of 16 campaign products are presented (Table 4.1). The total solvent handled for manufacturing 16 campaign products will be KLD. To maximize the solvent recovery efficiency upto 98%, industry has employed the effective solvent handling technics in the process. Mostly Solvents are handled in closed conditions to minimize the losses in the form of evaporation and also industry will take effective measures for reduction of fugitive emissions by providing vent condensers to the storage tanks, day tanks and receivers with breather valves. Chilled water & chilled brine circulation will be provided to the condensers which ensures the recovery of upto 98% and also controlled by closed operations and handling methods. The reactors used for handling the solvents shall be connected with mechanical seals to avoid the solvent vapour loss and also provided with double condensers with receivers. To minimize the vapour loss in closed centrifuge operation, a closed handling system will be adopted and the centrifuge vents are connected with adequate vent condensers with chilled brine circulation. 4.6 KKB Envirocare Consultants Pvt. Ltd., Hyderabad
217 NATCO Pharma ltd.-chemical Divn.-Chennai-EIA Report Chapter 4: Impact Assessment & Mitigation Measures Sl. No. Table 4.1: Solvent wise Usage, its Losses and Recovery Solvent Solvent Input (KLD) Solvent in Effluent (%) Solvent in Organic waste (%) Solvent loss (%) Solvent Recovery (%) 1. 1,2-Dimethoxyethane + Methanol ,4-Dioxane ,6-Lutidine Methyl Tetrahydrofuran Acetic acid Acetone Acetonitrile Anisole + Methyl isobutyl Ketone Chloroform Chloroform + Thionyl Chloride Cyclohexane Diethyl Ether Diisopropyl ether Dimethyl Sulfoxide Dimethylacetamide Dimethylformamide Ethanol Ethyl Acetate Heptane Hexane Isopropyl Acetate Isopropyl Alcohol Isopropyl Ether Methanol Methyl Ethyl Ketone Methyl Isobutyl Ketone Methyl tert-butyl ether Methylene Dichloride Cyclopentanone 29. Methylne Dichloride n-butanol n-heptane o-xylene Pyridine tert-butyl methyl ether Tetrahydrofuran Toluene Various types of solvents are used in the APIs & its intermediates manufacturing process. The solvents will be stored in drums and bulk quantities will be stored in above ground storage tanks of 10 & 28 KL capacities. Solvents are handled in closed conditions thereby reducing the losses in the form of evaporation. Good ventilation will be provided to reduce the workroom concentrations. The height of the solvent receiver tank vent is above 4.7 KKB Envirocare Consultants Pvt. Ltd., Hyderabad
218 NATCO Pharma ltd.-chemical Divn.-Chennai-EIA Report Chapter 4: Impact Assessment & Mitigation Measures production block roof level and the diameter is 20 mm. The solvent loss is depending on the boiling point of the solvent. Around 50% (23 KLD) of the solvents will be distilled out from the reactors after the reaction for reuse. About 47.46% (21.94 KLD) will come out as spent solvents which will be sent to distillation reactor for further recovery of solvents for reuse / sold to authorized recyclers, 0.13% in product, 0.56% will be in effluent & residue and the remaining 1.84% in handling loss. Solvent Input Effluent Solvent in Organic residue Handling loss Solvent Recovery Recovered Spent from solvents for In product reactor for in-house reuse recovery KLD 0.2 KLD 0.06 KLD 0.85 KLD 23 KLD KLD 0.06 KLD 50 % % 0.13 % 100% 0.43 % 0.13% 1.84% 97.6 % To maximize the solvent recovery efficiency, solvent in effluent also recovered through steam stripper, hence total solvent recovery will be 98.03% (97.6% %), industry has employed the effective solvent handling technics in the process. The purpose of solvent recovery system is to recover solvents from spent solvent streams and to reuse the pure solvent in manufacturing process / sold to authorized recyclers. Industry is having integrated solvent recovery system in the process to recover the pure and spent solvents after reaction. The entire distillation operation of all streams is carried out in reactors. Vent condensers are provided to all reactors where solvents are being distilled. The vent condensers will be circulated with chilled water in the primary condenser and chilled brine in the secondary condenser. The pure solvent collected and reused in the manufacturing process. The solvents which are not fit for use are sent to authorized recovery units for recovery. Mitigation Measures Fugitive emissions are mainly solvent vapour due to handling & process units. The estimated solvent loss due to handling will be 0.85 KLD other than in Effluent, organic residue. This is after maximum recovery of around 98%. Minimize the spill over of dust during handling of process/operation unit s specially toxic based one. Water spray may be applied & contaminated water may be disposed to ETP after necessary treatment. To control the fugitive emissions generated during various operations in the industry, the following mitigation measures will be adopted. 4.8 KKB Envirocare Consultants Pvt. Ltd., Hyderabad
219 NATCO Pharma ltd.-chemical Divn.-Chennai-EIA Report Chapter 4: Impact Assessment & Mitigation Measures Solvent management for effective recovery: Dedicated pipe lines for transfer of solvents from respective solvent storage tanks to day tanks and then to reactors in the production blocks. Reactors will be connected to double condensers with Cooling and chilled water and chilled brine circulation system Reactor and solvent handling pump will have mechanical seals to prevent leakages of solvent. Condensers will be provided with sufficient Heat Transfer Area (HTA) and residence time so as to achieve maximum recovery of upto 98%. Solvents will be stored in a separate space specified with all safety measures. Nitrogen blanketing will be provided in certain process areas Low boiling solvents storage tanks are insulated & vent condensers will be provided and circulated with chilled water. Mother liquors will be collected in closed drums Standby scrubbers will be kept ready for emergency use Wherever possible pressure nutch filters (PNF) will be used in place of centrifuges to contain the solvents thereby reducing the solvent emissions Nitrogen breather valves are used for the bulk tanks to avoid escaping of solvents. Proper earthing will be provided in all the electrical equipment wherever solvent handling is done. Entire plant where solvents are used, the equipment s/pumps/fittings will be of flame proof. The solvent storage tanks will be provided with vent condensers and breather valve with nitrogen blanketing system to prevent losses. Also green belt is developed to reduce the impact of the various emissions Process Emissions and Mitigation Measures Manufacturing of APIs and its intermediates will result in gaseous emissions. Maximum Process emissions with their quantities and treatment method are presented in Table 4.2. Gaseous emissions will be scrubbed in two stages with water and caustic solution based on the characteristics of gases. Proposed additional 4 scrubbers for the expansion project in addition to the existing 8 scrubbers to scrub the additional process emissions. 4.9 KKB Envirocare Consultants Pvt. Ltd., Hyderabad
220 NATCO Pharma ltd.-chemical Divn.-Chennai-EIA Report Chapter 4: Impact Assessment & Mitigation Measures Sl. No. Table 4.2: Process Emissions from Proposed Products Process Emission Maximum Quantity on various combinations (kg/day) Treatment 1. HCl Scrubbed by using water & Caustic Soda (CS) lye solution 2. SO Scrubbed by using CS lye solution 3. H Diffused with Flame Arrestor 4. CO Scrubbed by using CS lye solution 5. Methyl Bromide 0.08 Scrubbed by using CS lye solution 6. O Dispersed into Atmosphere 7. N Dispersed into Atmosphere 8. Cl Scrubbed by using CS lye solution 9. Chloroethane 0.9 Scrubbed & condensed 10. Dimethylamine 4.83 Scrubbed by using water 11. NH Scrubbed by using Chilled water Mitigation Measures The quantities of these gases are not generated continuously. Hence, these will be insignificant. These emissions are only product based and will be emitted only when the specific product is under production. The HCl, SO 2, H 2, CO 2, methyl bromide, O 2, N 2, Cl 2, chloroethane, Dimethylamine, and NH 3 emissions are liberated from the process. Emissions from the reactors will be connected to dual scrubber with suitable chilled or room temperature liquid to scrub the gases effectively with water / caustic / dilute HCl based on the nature of the gas. HCl will be scrubbed using water and caustic lye solution. The SO 2, methyl bromide, Cl 2 emissions will be scrubbed using caustic soda lye solution. CO 2 will be scrubbed using CS lye solution. NH 3 will be scrubbed using chilled water. H 2 will be diffused with flame arrestor and N 2, & O 2 will be dispersed into atmosphere. Dimethylamine, will be scrubbed in water (Fig.4.1). The scrubbed solutions are sent to ETP for further treatment and reuse. Its impact will be reduced by releasing them through stack of suitable height. The vents of the scrubber s gases will be dispersed into atmosphere through a stack above the production block. Hence it is necessary to minimize the process emissions at source as well as to control effectively before sending out to atmosphere KKB Envirocare Consultants Pvt. Ltd., Hyderabad
221 NATCO Pharma ltd.-chemical Divn.-Chennai-EIA Report Chapter 4: Impact Assessment & Mitigation Measures Fig. 4.1: Schematic Flow Diagram of Double Stage Scrubber System To control Cl 2 emissions caustic lye based counter current packed bed scrubber will be applied as effective control system. To control SO 2 emissions caustic lye based scrubbers will be applied by giving sufficient residence time and surface area of packed material. For efficient scrubbing provide sufficient surface area and contact time to achieve more than 99% efficiency. Regarding H 2 emissions, efficient flame arrestor will be installed and explorable limits are taken into account before application. Remaining process waste is not toxic and a part of atmospheric air. Hence, it can be dispersed into atmosphere Boiler & DG set emissions (Flue Gas) During operational stage of the plant, Particulate Matter (PM), Sulphur dioxide (SO 2 ) and Oxides of Nitrogen (NOx) emissions would be the major criteria air pollutants. However, the emission concentrations are insignificant. The impact on ambient air quality is assessed hereunder considering the following: Air quality impacts have been predicted assuming that the pollution load due to the existing activities covered under baseline environmental monitoring. Site-specific meteorological parameters have been recorded by using continuous recorders. Short-term 24 hourly GLC's incremental values were estimated using the site-specific meteorological data. Proposed 6 TPH furnace oil fired boiler with 40m stack height will be installed for controlling the particulate emissions. Furnace oil of about 400 lit/hr used in the boiler. These are in addition to the existing 3TPH furnace oil fired boiler, which will be standby. Existing incinerator (100 kg/hr) will be utilized with 40m stack attaching to wet scrubber. Stack as per CPCB 4.11 KKB Envirocare Consultants Pvt. Ltd., Hyderabad
222 NATCO Pharma ltd.-chemical Divn.-Chennai-EIA Report Chapter 4: Impact Assessment & Mitigation Measures guidelines will be provided to the proposed DG sets of 2x10¹⁰ KVA and 100 KVA. These are in addition to the existing DG sets of 1010 KVA and 300 KVA However, 300 KVA DG set will be removed. DG sets will be used as standby during power failure. Diesel about 630 lit / hr will be used at full operation load in the DG sets. The various measures proposed to minimize the pollution from the boiler are as follows: To facilitate wider dispersion of pollutants, 40m height stack will be installed. The NOx emissions from the boilers will be controlled by controlling combustion measures, which will be approached by way of low NOx burners or by air stagging in boiler. Stacks will be provided to DG sets as per CPCB / SPCB Guidelines. Incinerator (100 kg/hr) with stack height of 40m attached with scrubber Air Quality Model The air quality impact of a source or group of sources is evaluated by the use of mathematical models. The models simulate the relationships between air pollutant emissions and the resulting impact on air quality. The inputs to the model include data relating to emissions, hourly meteorology and atmospheric details like ambient temperature, wind speed and wind direction, all of which are determined by formulating impact scenarios. There are several air quality simulation models available for prediction of air pollution impacts. In the present case, a multiple point source Gaussian Dispersion Model applicable to industrial sources located on flat as well as undulated terrain, i.e. industrial source complex (ISC) ver.3 model has been applied for prediction of impacts on air environment. The ISCST- 3 (Industrial Source Complex Short Term Dispersion Tool) model was adopted as per the USEPA guideline models and widely used as a regulatory tool to predict air pollution impact. The ISCST-3 is an hour-by-hour steady state Gaussian Model which takes into account the following special features: Stack-tip downwash Gradual plume rise Buoyancy- induces dispersion Plume reflection off elevated terrain Partial penetration of elevated inversions is accounted for Hourly source emission rate, exit velocity and stack gas temperature This model is widely recognized as predictive tool in impact assessment for air environment. The Gaussian plume dispersion formulae approved by CPCB has been incorporated in this model to meet regulatory requirements. The ISCST-3 model has been applied with flat terrain, gradual plume rise and buoyancy induced dispersion options in the present study KKB Envirocare Consultants Pvt. Ltd., Hyderabad
223 NATCO Pharma ltd.-chemical Divn.-Chennai-EIA Report Chapter 4: Impact Assessment & Mitigation Measures Point Source Emissions (Inputs Used for Model) Boiler, Incinerator and DG sets are the point source emissions from the proposed expansion project. The plant has a one furnace oil based steam boiler with a capacity of 3 TPH wherein oil consumption is 230 lph. In present expansion program, it is proposed to add 6 TPH furnace oil based steam boiler and the existing 3 TPH boiler will be standby. Total fuel consumption for steam generation after expansion is maximum 400 lit/hr. Generated steam is going to be used for process/ operation units. Proposed 6 TPH furnace oil fired boiler with 40m stack height will be installed. Existing incinerator (100 kg/hr) will be utilized with 40m stack attaching to wet scrubber. The proposed power requirement of the plant is 2350 KVA (CMD) including existing 1175 KVA (CMD). The proposed power requirement (Connected Load) of the plant is 5250 HP including existing 3250 HP. Power will be met from Tamil Nadu Electricity Board (TNEB). Diesel of about 630 lit/hr will be used in the proposed DG sets of 2x10¹⁰ KVA & 100 KVA, in addition to existing 1010 KVA and 300 KVA DG sets. Existing 300 KVA DG set will be removed. However DG sets are operated during power failure only. Total furnace oil consumption after expansion will be 400 lph for 6 TPH furnace oil fired boiler, wherein diesel consumption is 630 lph. Apart from the above, there is one more point source one existing incinerator capacity of 100 kg/hr. The emissions are estimated accordingly and considered for prediction. About 400 lph Furnace oil will be used for steam generation from 6 TPH boiler, Sulfur dioxide (SO 2 ) and Oxides of Nitrogen (NOx) will be the major pollutants. Existing stack height of 40 m is meeting the CPCB guidelines of 39.6 m stack height considering the 4% sulfur content in the furnace oil. The NOx emissions from the boilers will be controlled by controlling combustion measures, which will be approached by way of low NOx burners or by air stagging in boiler. The estimation and evaluation of gaseous pollutant generation from furnace oil based steam boilers activities is an immensely complicated procedure. Gaseous pollutants will be generated during steam boiler operation, considered as point source emissions (SO 2, NO x, & SPM) which are harmful to the human health and environment. The stack emission details and flue gas characteristics along with emission rate for individual pollutants used for prediction of air quality impacts are given in Table 4.3 including existing emission details of steam boiler and Incinerator. Input data used for modelling is presented in Annexure-XLVI. Proposed steam boiler of 6 TPH is considered as reference point (10 km, 10 km) KKB Envirocare Consultants Pvt. Ltd., Hyderabad
224 NATCO Pharma ltd.-chemical Divn.-Chennai-EIA Report Chapter 4: Impact Assessment & Mitigation Measures Source Table 4.3: Stack Emission Details and Flue Gas Characteristics Stack Height Diameter (m) (m) Temperature ( o C) Flue Gas Flow rate (m 3 /hr) Exit Gas Velocity (m/sec) PM SO 2 NOx kg/hr Furnace Oil Fired Steam Boilers 6 TPH (proposed) TPH (Existing Standby) Incinerator Incinerator kg/hr Diesel Generator (DG) sets 1010 KVA KVA KVA KVA Note: Proposed DG sets of 2x10¹⁰ KVA and 100 KVA. These are in addition to the existing DG set of 1010 KVA. DG sets will be used as standby during power failure. Existing 300 KVA will be removed after expansion Meteorological Data The project site is fairly flat without any undulations and topography of the impact zone around the project site is also covered with slightly sloppy terrain towards sea, a bay of Bengal is 5.5.km away from project site and semi urban area other side upto about 10 km radal distance. The data published by Indian Meteorological Department (IMD) on the prevalence of inversions and other stable layers in the planetary boundary layer and the CPCB publication Spatial distribution of hourly mixing depths over Indian region have been used for project region along with the site specific atmospheric stability parameters on hourly basis. The primary meteorological data is collected manually at project site, Manali Industrial Area on hourly basis i.e wind speed and direction, rainfall, temperature, relative humidity etc., for study period at site for summer season (March May 2017). The percentage frequencies of occurrence of various wind speed classes in different directions were computed from recorded data on 24 hourly basis and presented in the form of wind roses for summer season as shown in Fig and corresponding meteorological data on percentile basis is given in Table 4.4. The data was further analyzed to obtain predominant wind direction and average wind speed for 24 hours, and the same data was used in prediction of impacts on air environment for summer season KKB Envirocare Consultants Pvt. Ltd., Hyderabad
225 NATCO Pharma ltd.-chemical Divn.-Chennai-EIA Report Chapter 4: Impact Assessment & Mitigation Measures Meteorological data indicates that predominating wind mostly eastern winds (SE, SSE, WSW, NW and NNW ) with wind speed (2/3 m/sec) and stability mostly 2/3 during day time where as in night time wind speed is almost similar and stability 5/6. On overall wind speed average 2.7 m/sec and observed diurnal variation of mixing height. The hourly wind speed, isolation and partly cloudiness during day time as well as night time were used to determine the hourly atmospheric stability classes (Pasquill and Gifford) viz., A to F Prediction of Air quality Impacts The ISCST-3 model, which is a Gaussian-Plume atmospheric dispersion algorithm for estimating concentration of suspended particulate matter, was used to predict the Ground Level Concentrations (GLC s) of PM, SO 2 and NO x due to furnace oil based boilers. The GLC s were predicted on 24 hourly average basis keeping in view of the prescribed national ambient air quality standards (NAAQS). The GLC s of individual pollutants are predicted at 500 m X 500 m Cartesian Square Grid Receptors in the impact zone covering 10 km radial distance (20 km X 20 km), prediction made for existing and proposed steam boilers. The model result shown in Fig.4.2 has the highest SPM concentration of µg/m 3 at receptor location of 0.71 km and µg/m 3 at 1.12 km from the project site for a maximum total emission rate of g/s from proposed steam boiler of 6 TPH and Incinerator. The concentration of SPM will travel to a maximum predicted distance of around 10 km towards NW and NNW side of project site and all the values are less than 0.04 µg/m 3. Predicted concentration values of SO 2 on 24 hourly basis for an estimated emission load (7.964 g/s) from proposed steam boiler of 6 TPH and other point source is shown in Fig.4.3 (Isopleths). The predicted maximum 24 hourly concentration of SO 2 is varied from 3.99 to 8.95 µg/m 3 within a distance of 2.5 km from project site. The impact zone covers NW-NNE sector in accordance with prevailing winds (SE-SSE) covers up to a distance of 10 km. The SO 2 impact from the proposed expansion project would diminish to 0.5 µg/m 3 at 10 km radial distance from project site. Accordingly SO 2 impact from the proposed project would be well within the prescribed limits, NAAQS for residential, rural and other areas during normal operation phase. Table 4.4: Meteorological data on Percentile basis during study period Wind Direction >= 11.1 Total N NNE NE ENE E ESE SE SSE KKB Envirocare Consultants Pvt. Ltd., Hyderabad
226 NATCO Pharma ltd.-chemical Divn.-Chennai-EIA Report Chapter 4: Impact Assessment & Mitigation Measures Wind Direction >= 11.1 Total S SSW SW WSW W WNW NW NNW Sub Total: Calms: Missing /Incomplete: Total: 1 For estimated emission load of NOx (1.547g/sec), predicted ground level concentration of NOx for proposed boiler and incinerator in the form of isopleths (24 hourly averages) is shown in Fig.4.4 (up to 10 km). The maximum NOx predicted values are in the range of 0.85 to 2.2 µg/m 3 which is reflecting as in SO 2. Predicted values are at downwind distance in NW -NNE direction during summer season. Predicted NOx levels are 0.2 µg/m 3 at 10 km radial distance at wind ward side. It indicates that all the values are well within the prescribed NAAQS for residential, rural and other areas even after superimposing on existing background level concentration of NOx. The predicted values indicate that affected area covers at wind ward direction (NW, NNE) up to 10 km. The predicted concentration of SO 2 is higher when compare with NOx values, being industry is using high sulphur (4 %) content of oil and is reflecting in emission load, whereas SPM for summer season is negligible when compare with back ground concentration. The post project scenario of PM, SO 2 and NO x levels after super imposing predicted increments over baseline status at AAQ monitoring locations are well within the limits. The prediction results corresponding to PM, SO 2 and NO x as explained above indicate that the air quality impacts w.r.t. criteria pollutants exclusively from the proposed steam boiler and incinerator would be insignificant and the post-project status will remain well within the prescribed NAAQS for residential, rural and other areas, being contribution by proposed steam boiler is negligible at all receptors location. There are two existing DG sets with a capacity 1010 KVA and 300 KVA and proposed 3 more DG sets i.e 2x10¹⁰ KVA & 100 KVA. Existing 300 KVA DG set will be removed. However DG sets will be standby and operated during emergency in case of power failure, since plant has contract power supply demand of 2350 KVA. Estimated emissions are taken in to account for prediction in existing as well as in proposed activity. Existing 3 TPH furnace oil fired steam boiler is only standby and it will be operated during boiler maintenance. Attenuation of air 4.16 KKB Envirocare Consultants Pvt. Ltd., Hyderabad
227 NATCO Pharma ltd.-chemical Divn.-Chennai-EIA Report Chapter 4: Impact Assessment & Mitigation Measures pollution by green belt would further mitigate the air pollution impact to certain considerable extent. As per MoEF&CC guidelines, prediction is made for 1 hourly and 24 hourly basis for existing and proposed activity. Obviously predicted 1 hourly average values are high when compared with 24 hourly average values and these values will be considered only for occupational health point of view, being short time exposure and occurs at typical meteorological conditions. These values are very low when compared with occupational health standards. The 8 (eight) maximum values of PM, SO 2 and NOx are reported for proposed boiler on 1 hourly and 24 hourly basis and are presented in Tables 4.5. The post project scenario of PM, SO 2 and NO x levels after super imposing predicted increments over baseline status at AAQ monitoring locations are well within the limits (Table 4.6). The prediction results corresponding to PM, SO 2 and NO x as explained above indicate that the air quality impacts w.r.t. criteria pollutants exclusively from the proposed steam boiler will be well within the prescribed NAAQS for residential, rural and other areas is negligible at all receptors location KKB Envirocare Consultants Pvt. Ltd., Hyderabad
228 NATCO Pharma ltd.-chemical Divn.-Chennai-EIA Report Chapter 4: Impact Assessment & Mitigation Measures Fig.4.2: Predicted GLC of SPM in µg/m 3 24 hourly basis (Summer Season) 4.18 KKB Envirocare Consultants Pvt. Ltd., Hyderabad
229 NATCO Pharma ltd.-chemical Divn.-Chennai-EIA Report Chapter 4: Impact Assessment & Mitigation Measures Fig.4.3: Predicted GLC of SO 2 in µg/m 3 24 hourly basis (Summer Season) 4.19 KKB Envirocare Consultants Pvt. Ltd., Hyderabad
 4.20 KKB Envirocare Consultants Pvt. Ltd., Hyderabad")
230 NATCO Pharma ltd.-chemical Divn.-Chennai-EIA Report Chapter 4: Impact Assessment & Mitigation Measures Fig.4.4: Predicted GLC of NOx in µg/m 3 24 hourly basis (Summer Season) 4.20 KKB Envirocare Consultants Pvt. Ltd., Hyderabad
231 NATCO Pharma ltd.-chemical Divn.-Chennai-EIA Report Chapter 4: Impact Assessment & Mitigation Measures Table 4.5: Predicted Maximum Concentration in µg/m 3 Proposed Maximum PM SO 2 NOx Distance 1 hr 24 hr 1 hr 24 hr 1 hr 24 hr (km) Direction 1 st NW 2 nd NNW 3 rd NW 4 th NW 5 th WNW 6 th NNW 7 th NW 8 th NW Pollutant Table 4.6: Maximum Incremental and Resultant GLCs Maximum Incremental Level (µg/m 3 ) Maximum Baseline (µg/m 3 ) Maximum Resultant (µg/m 3 ) NAAQ Standard (24 hrs) (µg/m 3 ) PM SO NOx Impact on Noise Levels In general any industrial complex has several sources of noise in clusters or single. These clusters/single sources may be housed in buildings of different dimensions made of different materials or installed in open or covered sheds. The material of construction implies different attenuation co-efficient. The major sources of noise pollution are from the proposed expansion plant is due to stationary sources. There is no major noise generating operations envisaged in the plant. The only noise generating sources are DG sets, motors and rotating machinery like pumps/blowers/ compressors etc. DG sets will be installed with inbuilt acoustic enclosures. Low noise and noise reduction will be a part of design specification for all future plant equipment s. The limiting noise level of db(a) will be binding for all machinery under inspection and is an integral part of the routine preventive maintenance. Noise generating units are isolated and sensitive areas like canteen, administration building and plants are provided with enclosure doors. The noise levels at the plant boundary are significantly below 55 db (A). There is a considerable distance between the surrounding community and the plant boundary to effect adequate noise attenuation. The findings indicate that no significant impacts due to noise pollution are expected, due to the enhancement in production capacity. Besides this other noise control measures are as follows: 4.21 KKB Envirocare Consultants Pvt. Ltd., Hyderabad
232 NATCO Pharma ltd.-chemical Divn.-Chennai-EIA Report Chapter 4: Impact Assessment & Mitigation Measures Noise attenuating devices like earplugs and earmuffs has been provided to the workers exposed to high noise level area like DG Set. Sufficient green belt is being maintained in & around the plant premises Regular monitoring of noise level is being carried out and corrective measures in concerned machinery are being adopted accordingly Impact on Community Greenbelt developed around the periphery of the premises will also act as a barrier to the propagation of noise from the factory premises. This will further reduce the noise levels from the generation sources. The cumulative impact of all noise sources at boundary will be in the range from 50 to 55 db(a). There will not be much effect on the nearest village (habitation), which is 0.9km distance from the project boundary with a thick greenbelt. Hence, no significant impact is envisaged. It is, therefore, expected that noise level at the plant boundary will be within the prescribed norms of CPCB due to operation of the proposed expansion project and hence no significant adverse impact on noise environment is expected Impact on Occupational Health (Work Zone) The noise sources include boiler, cooling tower, DG sets and compressors etc. It is observed that noise levels inside the process units will not exceed 65 db(a). However, impacts on the working personnel are not expected to be significant, which means that workers will be exposed for short duration only and that too intermittently. However, exposure to noise to individual workers will be below 90 db(a) (for 8 hours shift) because of use of earmuffs near the noise generation sources. The noise generation during operation phase would be at source itself through different measures such as inspection, operation and maintenance at regular intervals. The noise control measures described in environmental management plan will be followed. The occupational noise exposure to the workers in the form of 8-hourly time weighted average will be maintained well within the prescribed Occupational Safety and Health Administration (OSHA) standards (<90dB(A)). Hence, the impact on occupational health of workers would be insignificant Impact on Water Environment The proposed expansion project requires additional water for various purposes like process, washings, boiler, cooling tower, scrubber, Q.C, R&D, domestic and greenbelt development. The estimated total water requirement after expansion for the production of TPA, APIs and its intermediates would be about 576 KLD of which fresh water 4.22 KKB Envirocare Consultants Pvt. Ltd., Hyderabad
233 NATCO Pharma ltd.-chemical Divn.-Chennai-EIA Report Chapter 4: Impact Assessment & Mitigation Measures requirement is 303 KLD. Treated effluent of 182 KLD from ETP will be reused in cooling tower makeup. About 91 KLD is recovered as boiler condensate. Fresh water will be met from Chennai Metropolitan Water Supply & Sewerage Board (CMWSSB) and through private tankers supply. There will be no discharge of effluent outside the plant premises, the unit will be a Zero Liquid Discharge. The estimated water requirement, wastewater generation, reuse as well as water balance after expansion for production unit is presented in Table 4.7. Table 4.7: Proposed Water Balance, Waste Water Generation and Segregation Sl. No. Description Fresh Water Input (KLD) Recovered/ Recycled water Generation/ Evaporation / Handling Loss Output (KLD) Total Wastewater Recovered/ Recycled water Segregation of Wastewater Process (16 Products at a time) Washings (136 reactors, centrifuges, nutch filters, containers, floor moping, etc.) Boiler (Proposed 6 TPH) Cooling Towers 3000 TR (33.7 Tons) Stream- 1: 25 KLD Stream- 2: 6 KLD Stream % make up 47 Recovered as Steam Condensate 182 Treated effluent % Blow down 23 (Bleed) Steam Condensate Stream- 3 Stream -3 5 DM Regeneration Stream- 2 6 Scrubber (Existing 8 nos. & Proposed Stream -2 nos.) 7 QC and R&D Stream Domestic (450 nos at 55 lpcd) Utility rejects (MGF,ACF Back wash, Softener etc.) Fire Hydrant make up Gardening 10 5 kl/acre) Total Stream Stream Water Loss in sludge, salts, stripper etc., will be: 13 KLD (6.6%) 4.23 KKB Envirocare Consultants Pvt. Ltd., Hyderabad
234 NATCO Pharma ltd.-chemical Divn.-Chennai-EIA Report Chapter 4: Impact Assessment & Mitigation Measures Wastewater Management The sources of wastewater generation are from the process, floor & reactor washings, utilities, Q.C, R&D, scrubber and plant domestic waste. Total proposed wastewater will be 195 KLD, which will be segregated into Stream- 1 (TDS/COD > mg/l), Stream- 2 (TDS/COD < mg/l and > 5000 mg/l) and Stream -3 (TDS/COD < 5000 mg/l) considering TDS / COD concentrations and collected by gravity into a collection tank separately. These effluents will be pumped to the RCC lined tanks for storage and neutralization then sent to ETP and treated with ZLD concept. The effluents segregated quantity with characteristics and treatment flow is briefly presented in Table 4.8, characteristics of raw and treated effluent are presented in Table 4.9 and schematic treatment flow sheet is presented in Fig.4.5 and water balance in Fig The ETP units wise existing include up-graded and proposed capacity details are presented in Table Table 4.8: Effluent Treatment Flow as per Segregation Effluent Characteristics Stream -1 (Process) TDS > mg/l COD > mg/l Stream- 2 (Process, Washings, Scrubber, QC, R&D and Domestic) TDS < mg/l COD < mg/l Stream 3 (Utility) TDS < 5000 mg/l COD < 5000 mg/l Quantity (KLD) Treatment Flow Collection Equalization Neutralization Settling Holding Stripper MEE MEE Concentrate to ATFD. Stripped Solvent sent for Incineration / cement industries for co-processing. Salt sent to Tamil Nadu Waste Management Limited (TNWML). Vapour condensate sent to Secondary RO. ETP Primary RO HP RO Secondary RO. Treated in ETP consists of primary treatment, electro chemical oxidation, two stage secondary treatment & sludge treatment. Tertiary treatment consists of Primary RO, HP RO, and Secondary RO. Secondary RO permeate recycled to cooling towers, HP RO rejects sent to MEE & ATFD along with HTDS. Treated in lamella clarifier and sent to primary RO along with Stream-2 treated water for treatment in Tertiary treatment system. Table 4.9: Raw and Treated effluent Characteristics with Standards Parameter Unit Raw Effluent (Streams) Treated effluent (Secondary RO permeate) Standards as per EPA Rules 1986 for discharge into fresh water body ph Oil and grease mg/l < 20 < 20 < 20 Nil 10 COD mg/l > < 5000 < TSS (Total Suspended Solids) TDS (inorganic) mg/l mg/l < 1500 < 1500 <500 < > < 5000 < KKB Envirocare Consultants Pvt. Ltd., Hyderabad

235 NATCO Pharma ltd.-chemical Divn.-Chennai-EIA Report Chapter 4: Impact Assessment & Mitigation Measures Fig. 4.5: Schematic Diagram of Effluent Treatment Plant - 3 Streams 4.25 KKB Envirocare Consultants Pvt. Ltd., Hyderabad

236 NATCO Pharma ltd.-chemical Divn.-Chennai-EIA Report Chapter 4: Impact Assessment & Mitigation Measures Fig. 4.6: Water Balance 4.26 KKB Envirocare Consultants Pvt. Ltd., Hyderabad
237 NATCO Pharma ltd.-chemical Divn.-Chennai-EIA Report Chapter 4: Impact Assessment & Mitigation Measures Sl. No. Stream - 2 Table 4.10: Existing & Proposed ETP Unit Capacities Description No. of Units Status Size Capacity 1. Oil & Grease trap 1 Existing 1.8m X 1.8m X 2.5m 8 KL 2. Equalization tank-1 1 Existing 10m X 3m X 10m 300 KL 3. Static Mixer 1 New - 6KL/hr (120 KLD) 4. Flocculent Dosing tank 1 Existing 1.2 m (Dia.) X 0.9 m (H) 1 KL 5. Coagulant Dosing tank 1 Existing 1.2 m (Dia.) X 0.9 m(h) 1 KL 6. Flash Mixer 1 Existing 1.2 m (Dia.) X 1.8 m (H) 2 KL 7. Clariflocculator 1 Existing 4.5 m (Dia.) X 3.35 m(h) 53 KL 8. Feed Tank 1 New - 20 KL 9. ECOT System 1 New - 6KL/hr (120 KLD) 10. Aeration tank - I 1 Existing 20 m X 12 m X 5 m 1200 KL 11. Clarifier 1 Existing 4.5 m (Dia.) X 3.35m(H) 53 KL 12. Aeration tank Existing 12 m X 12 m X 3.70 m 525 KL 13. Secondary clarifier 1 Existing 4.5 m (Dia.) X 3.35 m(h) 53 KL 14. Decanter feed tank 1 New 1.8 m (Dia.) X 2 m(h) 5 KL 15. Decanter Centrifuge 1-3 KL/hr (72 KLD) 16. Paddle Dryer 1 New kg/hr 17. Primary RO feed tank (along with Stream 3 Clarifier supernatant) (4.8 KL/hr) 1 Existing KL 18. Primary RO (80% recovery) 1 Upgraded Existing 125 KLD upgraded to 250KLD 19. Secondary RO Feed tank 1 Existing 10m X 3m X 10m 300 KL 20. Secondary RO (80% recovery) 1 Upgraded Existing 100 KLD upgraded to 250 KLD 21. Permeate Storage tank 1 Existing - 100KL 22. HPRO Feed tank 1 Existing - 100KL 23. HPRO (40% recovery) 1 New - 50KLD 24. MEE feed tank & RO rejects tank(along with Stream 1 1 Existing KL stripper condensate) 25. MEE -1 1 Existing - 3KL/hr (60KLD) 26. ATFD Feed Tank 1 Existing 2 m (Dia.) X 1.92 m(h) 6 KL 27. ATFD (Agitated Thin Film Drier) 1 Existing Kg/hr Stream High TDS Collection tank 1 New - 50 KL 2. Lamella Clarifier 1 New KL/hr (36KLD) with flash mixer 3. High TDS Stripper feed tank 1 New HDPE tank 10 KL 4. Stripper 1 New KL/hr (30KLD) 5. Stripper solvents collection 1 New HDPE tank 2 KL tank Stripper Condensate will be sent to MEE feed tank Stream Utility Effluent collection tank 1 Existing 5m X 2m X 5m 50 KL 2. Flash Mixer 1 New - 3KL 3. Lamella Clarifier 1 New KL/hr (70KLD) Clarifier supernatant will be sent to Primary RO feed tank 4.27 KKB Envirocare Consultants Pvt. Ltd., Hyderabad
238 NATCO Pharma ltd.-chemical Divn.-Chennai-EIA Report Chapter 4: Impact Assessment & Mitigation Measures Existing treatment system will be enhanced to meet the proposed effluent quantities. Additional tanks will be constructed / installed above the ground with water proof lining to meet the proposed effluent quantity. This individual effluent will be pumped to the RCC lined tanks for storage and neutralization then sent to up-graded ETP-ZLD of 200 KLD capacity within the plant premises. The proponent is required to maintain the effluent quality as per standards and with treated effluents recycled to utilities, there will not be any discharge of treated effluents. Online monitoring of effluent for the important parameters will help in checking contamination or surpassing of any set standard. Thereby treated water quality will meet the prescribed standards. Thus, it can be concluded that there will not be any adverse or negative impacts on the surrounding environment due to the treated effluents from the industry. There will not be any discharge of wastewater on the land. Besides, there will be separate storm water and industrial wastewater drains to eliminate chances of mixing of rainwater with wastewater. Hazardous wastes will be stored, managed and handled as per hazardous waste rules. All bulk chemicals and fuel storage areas will be provided with dyke wall / bunds to eliminate chances of any spillages/ leakages entering into the storm water drain. The surface/ground water quality and soil quality will not exceed the prescribed standards with implementation of mitigation measures. Therefore, the impact on surface/ground water quality and soil quality will be insignificant Handling, Storage and Detoxification of Toxic Raw Materials Detoxification and disposal of empty containers / empty polythene bags in the Production blocks: Washed with sufficient quantity of potable water by wearing the PPEs and repeat the operation till container/bag is clean and ph is neutral. Cleaned container/bag will be sent to storage area for disposal. Collect the spilled/contaminated water washings and sent to ETP for treatment Impact on Land Use The proposed expansion will be in the existing plant premises thus no major change will occur on the land use pattern of the surrounding villages. Soil is likely to be contaminated by improper disposal of waste or leakage of any storing tank containing chemicals. The anticipated pollution to soil environment due to the plant activities is as follows. Changes in soil texture due to settling of air borne dust or due to wash off of solid particulates by surface or ground water. This will lead to change in porosity, permeability & other such physical characteristics of soil of the area. Changes in soil chemistry due to addition of foreign material from polluted air and water due to plant activities in the area 4.28 KKB Envirocare Consultants Pvt. Ltd., Hyderabad
239 NATCO Pharma ltd.-chemical Divn.-Chennai-EIA Report Chapter 4: Impact Assessment & Mitigation Measures Effluent generated will be treated in ETP and no waste water will be disposed on ground. Any solid waste or hazardous waste generated are disposed off as per given norms. Proper mitigating measures like use of efficient pollution control systems, proper stack height, and use of top soil in plantation results in no significant impact on soil of the core zone. There will be no impact on soil of the study area located beyond the working area of the project. Soil samples will be collected and tested at regular intervals for the nearby areas. This will help in mitigation of any harmful impact on soil due to the plant activity, if any. The expansion has been proposed in existing plant premises (10.57 Ha) consist of built-up area, greenery, BT/CC roads area, parking area and open / lawn area etc. Hence, there are no R&R issues involved in the proposed project. About 4.96 Ha (47%) of the Ha land area including open space reservation land area has been developed as greenbelt. There are no Sanctuaries, National Parks, Tiger Reserve or Biosphere Reserve or Elephant Corridor or other protected areas within 10 km radius from core area. No land cutting or filling activity is involved during construction / operation of the plant as the site is mostly plain land which is existing unit and hence the land degradation is not envisaged Impact on Soil The soil at the project site and in the study area predominantly consists of Brown, Red and Black with loam, silty loam, silt clay loam and sandy silt soils. The present site and buffer zone is underlain by the youngest formations in the area is alluvium, which was deposited on the worn- down and eroded surface of Tertiary and Gondwana rocks by the major river. The expansion will be in existing plant premises. Spillages such as wastewater / solid wastes / raw materials are expected /possible and the risk of this would be limited to within the premises of the manufacturing facility. A precautionary measure like spillage control management is practiced in the industry. Hence, there is no impact on the top soil. The Hazardous / solid waste generated will be stored in the covered area till it is disposed to the SPCB authorized TNWML. Hence, apart from very few localized construction impacts at the plant site, no significant adverse impact on soil in the plant premises area is anticipated Impact due to Hazardous / Solid Waste Generation All process waste is considered as Hazardous waste and segregated into process organic residues, Inorganic salts and Spent Carbon. The organic residues and spent carbon will be used in in-house Incinerator / disposed to cement units for use as alternate fuel either in the solid or liquid form as recommended by CPCB. Inorganic salts are sent to landfill at TNWML for incineration. The agreement with TSDF enclosed at Annexure-XLVII. Solid waste generated from the different sections of proposed APIs manufacturing plant is presented in Table Hazardous / Solid waste will be segregated, detoxified and collected in the HDPE drums / bags and will be stored in the covered and raised platform with leachate collection 4.29 KKB Envirocare Consultants Pvt. Ltd., Hyderabad
240 NATCO Pharma ltd.-chemical Divn.-Chennai-EIA Report Chapter 4: Impact Assessment & Mitigation Measures system till its disposal. Incinerator ash will be sent to TNWML. All wastes including hazardous & non-hazardous wastes will be disposed through the method approved / permitted by the regulatory authority. Table 4.11: Hazardous / Solid Waste Generation, Handling and Disposal Sl. No Description Process Organic residue Distillation residue (1% of solvent recovery) 3. Spent carbon (a) Inorganic salt (Process) (b) Evaporation salt (Process) Evaporation salt (Non-Process) 6. ETP Sludge 7. Incinerator ash 8. Spent Catalyst (Spent Raney Nickel catalyst-0.03, Spent Palladium Catalyst-0.03) Schedule as HW rules 28.1 of Schedule -I 36.1 of Schedule -I 28.3 of Schedule -I 28.1 of Schedule -I 35.3 of Schedule -I 35.3 of Schedule -I 35.3 of Schedule -I 37.2 of Schedule-I 28.2 of Schedule-I Other Hazardous Waste generation from the Plant Detoxified Container / Liners drums, HDPE 33.1 of 9. Carboys, Fiber Drums, Schedule-I PP Bags Spent solvents with moisture (22 KLD) Recovered solvents from spent solvents Spent Mixed solvents (2 KLD from SRS KLD with 50% moisture from ETP) 13. Waste oils & Grease 14. Used Lead acid Batteries 28.6 of Schedule -I 28.6 of Schedule -I 28.6 of Schedule -I 5.1 of Schedule-I A1160 of Schedule-III Proposed Quantity (TPD) Proposed Quantity (TPA) Handling Method HDPE Bags / Drums HDPE Bags Drums Nos./ month 22 KLD 7920 KL/A 20 KLD 7200 KL/A 2.4 KLD 864 KL/A Stored in Scrap yard Tanks / Drums Tanks / Drums Tanks/ Drums -- 4 KL/A MS Drums Nos/A Stored in Covered shed Disposal Sent to Authorized Cement Industries (or) TNWML for incineration (or) disposed in in-house incineration in the plant premises Sent to Tamil Nadu Waste Management Limited (TNWML) Sold to Authorized Recyclers (or) Sent to TNWML After Detoxification sent to outside agencies or recyclers Recovered within the premises duly sending the residue to TNWML (or) On-site incineration of distillation residue. Reuse in process (or) sold to authorized recyclers Sent to Cement industries for Co-Processing (or) Sent to TNWML for incineration (or) On-site Incineration (Existing) Sent to authorized re-processors (or) TNWML Sent to suppliers on buy-back basis KKB Envirocare Consultants Pvt. Ltd., Hyderabad
241 Sl. No. NATCO Pharma ltd.-chemical Divn.-Chennai-EIA Report Chapter 4: Impact Assessment & Mitigation Measures Description 15. Date expired Off specification products/ chemicals Schedule as HW rules 28.5 of Schedule-I 28.4 of Schedule-I Proposed Quantity (TPD) Proposed Quantity (TPA) Handling Method HDPE Bags and stored in covered shed Disposal Sent to TNWML (or) Cement Industries for processing (or) On-site Incineration (existing Incinerator) Spill control Wastes/ 5.2 of Sent to TNWML Residues containing Oil Schedule-I * Solid waste quantities maximum on various combinations i.e., 16 products on campaign products at a point of time and R&D products **50% pure solvents recovered in process reactors for reuse and balance will be spent solvents. Table 4.11 contd.: Non-Hazardous Waste Generation, Handling and Disposal Sl. No. 1 2 Source Non-hazardous waste (Domestic canteen waste, discarded papers) Non-hazardous waste (Paper/cartons / packing materials, glass, plastic/used PPE, etc.) Proposed Quantity (TPD) Proposed Quantity (TPA) Handling Packed in drums / HDPE bags Stored in Scrap yard 3 Used Insulation waste Stored in Scrap yard 4 Metal scrap (MS/SS/ Aluminum) Stored in Scrap yard Disposal Handed over to local waste collection system Sent to outside agencies / recyclers Sl. No Table 4.11 contd.,: Biomedical Waste and E- Waste Generation, Handling & Disposal Name of the waste Category : Yellow (h) Decontaminated media from Microbiology Lab Category: White Waste sharps from OHC (Needles, syringes, scalpels, blades, glass, etc.) Category : Yellow (c) Soiled Waste from OHC (cotton, dressings, soiled plaster casts, other material) Category : Red) Contaminated Waste (Recyclable) (wastes generated from disposable items other than the waste sharps such as tubings, catheters, intravenous sets etc) Quantity (kg/day) Quantity (TPA) E waste Disposal option Pre-treat to sterilize with nonchlorinated chemicals on-site as per BMW Rules and sent to PCB authorized agency for incineration. Autoclaving and sent to PCB authorized agency. Sent to PCB authorized agency for incineration. Autoclaving and shredding and sent to PCB authorized agency. Sent to authorized E-waste collection centres/ registered dismantlers / authorized recyclers/ return back to manufacturers KKB Envirocare Consultants Pvt. Ltd., Hyderabad
242 NATCO Pharma ltd.-chemical Divn.-Chennai-EIA Report Chapter 4: Impact Assessment & Mitigation Measures Hence, impacts on land due to the solid / hazardous waste are not envisaged. In addition to these mitigation measures, proponent will be dedicated to maintain healthy greenbelt, which can have beneficial impact to land use, land cover and for prevention of erosion of topsoil Impact on Terrestrial and Aquatic Ecology Prediction of impacts is based on the direct and indirect; short-term as well as longterm; reversible and irreversible impacts that are most likely to occur owing to the proposed industrial activity during operation. The following ecological factors that are considered most significant as far as the impact on flora and fauna are concerned: Reduction in species diversity Habitat loss or fragmentation Additional risk or threat to the rare or endangered or endemic or threatened (REET) species Impairment of ecological functions such as (i) disruption of food chains, (ii) decline in species population and or (iii) alterations in predator-prey relationships There are many trees with vegetation in the entire core area except in the built-up area. All the trees in the core area will be retained. As there are no REET species in the study area, the proposed project will not pose any threat to local flora and fauna. No direct or indirect damage is expected to the flora and fauna of the buffer zone. As the industry is required to maintain the emission levels and treated effluents within the limits specified by the CPCB / TNPCB, the effects of the industry on the flora and fauna of the buffer zone will be negligible. As the all the effluent is routed to ETP ZLD system. Hence waste water from the industry will not get in to the drinking water resources. Further tall, wind resistant and evergreen trees will be grown in the green belt to act a wind break. Hence, the anticipated environmental impacts on the flora and fauna of the study area are negligible and easily reversible if any. It will not create any kind of environmental stress to the local flora and fauna. I4.2.7 Impact on Socio-economic Environment Invariably all industrial development projects lead to some change in quality of life in the respective regions in the form of increased business potential, subsequent (supportive) industrial & infrastructure development leading to opening up of employment opportunities as well as avenues for livelihood (direct as well as indirect). The requirements of workforce for industrial activities also result in demand for housing, communication facilities, education, health and recreational facilities thus contributing to changes in the quality of life in the vicinity of project. Such type of development will also lead to environmental pollution impacts, unless they are mitigated / controlled at the source through proper environmental management plan. Some of these impacts would be more effective in the immediate vicinity with short term 4.32 KKB Envirocare Consultants Pvt. Ltd., Hyderabad
243 NATCO Pharma ltd.-chemical Divn.-Chennai-EIA Report Chapter 4: Impact Assessment & Mitigation Measures effects, whereas the others would be higher order or of long term in nature. It is necessary to identify the extent of these impacts for further planning of control measures leading to mitigation of the adverse impacts Potential Socio-economic Impacts during Operation Phase For the community benefit M/s. NATCO Pharma Limited, Chemical Division and in association with Manali Industrial Association have been implemented welfare measures to develop various amenities in an effort to improve standard of living in the vicinity of the project. Positive Impacts No Land loosing PAPs / PAFs Scope for increase in job opportunities during the construction as well as operation phases for the qualified and skilled as well as unqualified and unskilled people. The proposed project expansion facility will generate direct and indirect employment to scores of local people. About 450 employees including existing 250 employees will be benefitted due to the proposed project, in that 350 nos. direct employment and 100 nos. of indirect employment Qualified human resource available in the surveyed 11 villages nearby the proposed project persons are qualified with 10 th to Degree, ITI- welders, plumbers, electrical, engineering and Computers. Local skilled and semi-skilled will be given preference in employment. Increases in demand of services include public transport, hotels, Tea and Tiffin centers kirana and general stores, medical and health, education, etc. As a result increase indirect employment for the surrounding villagers of the industry. Rising of house rents, land prices, business activities in labour rates will be increased in nearby villages of the study area. Strengthening the infrastructure like roads, road/traffics signals, street lights, power supply, water distribution network, schools, healthcare and recreation etc. Rapid growth of service sector will result in increase of income in the study area. Negative Impacts Air quality, ground water quality, soil quality, and noise levels may be marginally increased/disturbed which may result to rise in health problems, if necessary pollution control measures w.r.t air, water and hazardous waste are not properly planned and implemented KKB Envirocare Consultants Pvt. Ltd., Hyderabad
244 NATCO Pharma ltd.-chemical Divn.-Chennai-EIA Report Chapter 4: Impact Assessment & Mitigation Measures Impact on Health Adequate air pollution control measures, effluent treatment with zero liquid discharge concept and noise control measures will be undertaken to conform to regulatory standards. The environmental management and emergency preparedness plans are proposed to ensure that the probability of undesired events and consequences are greatly reduced, and adequate mitigation measures provided in case of an emergency Impact on Workers Health and Safety The wastewater generated from industry will be treated in ETP and treated effluent will be reused. Zero liquid discharge concepts will be followed. No significant impacts on ambient air, water and soil quality are predicted. Employees working in high noise work places would be provided with PPEs like ear plugs/ear muffs for ensuring minimum impact on human health. Hazards caused due to plant activities to the workers are known as occupational health hazard. Industrial activity involves the use of machinery, tools, equipment and process along with manpower. Such activity can pose a plethora or potential danger to man, machine and production, if due care and attention is not given to safety. Chemical industries experiences risk of a number of hazards inherent to the manufacturing process. Some examples of such hazards are: Exposure to hazardous chemicals Physical Hazards Industrial hygiene issues Others Working in the industry involves all above risks but proper safety measures are taken by NATCO Pharma for preventing any accident and safeguarding the workers life. NATCO Pharma safety management system involves following elements: Safety work practices Safety Training Safety committee Incident investigation and analysis In-house rules and regulations Safety promotion Contractors control Safety Inspections Maintenance programs Risk Analysis Hazardous substance control Emergency preparedness 4.34 KKB Envirocare Consultants Pvt. Ltd., Hyderabad
245 NATCO Pharma ltd.-chemical Divn.-Chennai-EIA Report Chapter 4: Impact Assessment & Mitigation Measures Occupational Health program Management Review The increase in staff strength will be about 200 both direct and indirect employees. The present occupational health centre will be strengthened to meet the requirements of increased staff. Industry will be evaluating the specific health status of worker during preplacement and regularly on annual basis for employees of all departments as per preplacement medical check-up format including various diagnostic services Transportation and Public Amenities The impact of economic development on civic amenities will be substantial. The area has already experienced a good network of roads and communication. Most of the villages have been electrified during the last decade. Although the level of existing communications and support services in the area are adequate, expansion of the proposed unit would further strengthen these services. Hence, it can be said that the proposed expansion project will have a positive impact on the study area. There will be increase in 3 staff buses with each capacity of 50 employees run to and from to the plant site to bring employees to the industry and take back to their home. About 40 two wheelers, four wheelers about 8 and trucks with different capacity are around 3 nos. will be increased after expansion. Industry earmarked the adequate parking area for the above vehicles separately. The fleet increase will be marginal and impact will be negligible since NH-16 is 8 km to the project site Impacts on Cultural Resources There are no historical monuments or ancient temples in 10km radius of the project site. Impact due to expansion of industry is not envisaged. 4.3 Summary NATCO Pharma provides a safe working environment to its employees. Proper measures are being taken to ensure occupational safety. Work zone environmental monitoring is done to find out presence of VOC/Solvents. Pre-employment and periodical medical examination is done for the workers. Care for personal hygiene for workers is taken. First aid treatment facility and medical officer is available all the time on the site. NATCO has tie-up with local hospital and has ambulance facility for immediate action in case of any accident. NATCO Pharma celebrates safety day and organizes road safety campaign for general public to spread awareness about safety. Though industry involves occupational health hazards like other industries but proper management and strategy help minimize the 4.35 KKB Envirocare Consultants Pvt. Ltd., Hyderabad
246 NATCO Pharma ltd.-chemical Divn.-Chennai-EIA Report Chapter 4: Impact Assessment & Mitigation Measures risk and provides safe working environment. The summary of anticipated adverse environmental impacts and the mitigation measures are presented in Table Table 4.12: Summary of Anticipated Impacts and Mitigation Measures Discipline Potential Impacts Air Quality Increase in SO 2, NOx level in ambient air Terrestrial Ecology Aquatic Ecology Water Quality Noise Increase in SO 2, HCl, Dimethyl amine, CO 2, NH 3, methyl bromide, Chlorine and chloro ethane level in ambient air Increase in SPM in ambient air Impact on plant species Impact on surface and ground water resources Deterioration of surface/ ground water quality Increase in noise levels in the plant area Probable Source Furnace oil fired boilers, Incinerator and DG sets. Process Scrubbers Vehicular traffic Gaseous emissions Effluent from industry Effluent from industry. DG sets, compressor, Pumps etc. Mitigation Measures Stack height of 40 m each for furnace oil fired Boiler and Incinerator. 7 to 11 m height stack for DG sets. Gaseous emissions are scrubbed with suitable solution in dual scrubbers. The scrubbed solutions are sent to ETP for treatment. All roads in the plant area are paved with concrete / black top to reduce dust emission. Emissions will be controlled by installation and operation of suitable Air Pollution Control devices as well as dispersed through appropriate height of stack Effluent will be segregated and sent to ETP ZLD for treatment. Treated effluent will be recycled into utilities. DG sets are equipped with acoustic enclosures. Compressors, Pumps etc., are procured to conform to noise levels prescribed by regulatory agencies. Adequacy of existing green belt and plantation would further help in attenuating noise. Remarks Maximum short term ground level concentration (GLC) of PM, NOx and SO 2 are well within the prescribed standards. Regular maintenance and monitoring to check the emissions within limits. Daily cleaning of the roads will help to reduce the fugitive emissions. Required emission control measures will be installed and monitor regularly. ETP with zero liquid discharge facility will be operated and online monitoring of the treated effluent quality and regular monitoring on daily basis. Regular maintenance and monitoring to check the noise levels within limits KKB Envirocare Consultants Pvt. Ltd., Hyderabad
247 NATCO Pharma ltd.-chemical Divn.-Chennai-EIA Report Chapter 4: Impact Assessment & Mitigation Measures Land Discipline Potential Impacts Change in land use pattern Impacts on soil and ground water due to discharge of organic waste Probable Source Setting up of industrial plant Effluent / Hazardous waste / chemicals Mitigation Measures Expansion is in existing plant premises. Effluent treatment plant will be in dykes to control the spills if any and are routed to collection tanks. Hazardous waste is stored in designated raised covered area, which will be handled carefully and sent to Incinerator / TNWML. -- Remarks Daily monitoring around the ETP / Hazardous waste storage areas for any spillages etc., and rectify immediately and improve the awareness to the workers to handle safely without spillages. Demography and Socioeconomics Contamination due to storage of chemicals and disposal of wastes Strain on existing amenities like housing, water sources and sanitation, medical and infrastructure facilities Improper storage of chemicals and disposal of hazardous wastes Influx of people of plant employees as well as contractor s employees/ Labourers Hazardous chemicals are stored in designated covered area, which will be handled carefully. Only authorized trained personnel will handle the Hazardous chemicals. Safe storage facility for chemicals fuels and waste. Spill kit will be provided at prominent places. Regular training & awareness to the workers for safe handling of chemicals without spillage. Community development activities are being taken up as part of ESC activities to minimise any adverse effects. Hazardous waste disposal through 7 copy manifest system if sent to TNWML for land fill. Regular meet through community Games / Sports etc., and develop Yoga centre to relief the strain 4.37 KKB Envirocare Consultants Pvt. Ltd., Hyderabad
248 Chapter 5 Environmental Management Plan
249 [[ NATCO Pharma Ltd. -Chemical Divn.- Chennai- EIA Report Chapter 5: Environmental Management Plan Chapter 5 Environmental Management Plan 5.0 Introduction The Environmental Management Plan (EMP) is required to ensure sustainable development in the study area of the proposed expansion plant, hence it needs to be an allencompassing plan for which the plant authorities, Government, regulating agencies like Pollution Control Board etc., working in the region and more importantly the population of the study area need to extend their cooperation and contribution. The details/data provided by proponent about the proposed expansion project (technical data, approach to environmental protection etc.) and the pre-project (baseline) environmental status monitored through field surveys by M/s KKB Envirocare Consultants and M/s KKB Micro Testing Labs teams during summer season (March - May 2017) have formed the basis to predict the impacts on all individual components of environment. In view of the above, project proponent will maintain the specifications / details / data as provided for preparation of this report or may try to improve further towards environmental betterment protection during various phases of implementation of proposed expansion project. The environmental management plan relevant to construction and operation phases is delineated in the following sections: The management action plan aims at controlling pollution at the source level to the maximum possible extent with the available and affordable technology followed by treatment measures before they are discharged / recycled / reused. Specifically, the EMP lays stress on key environmental aspects with mitigation measures and issues of the expansion project during construction and operation phase by: Identifying potential environmental impacts Recommending mitigation measures for the negative impacts Identifying opportunities for enhancement measures 5.1 KKB Envirocare Consultants Pvt. Ltd., Hyderabad
250 NATCO Pharma Ltd. -Chemical Divn.- Chennai- EIA Report Chapter 5: Environmental Management Plan Providing an organizational framework for operating environmental management system and other functions of the expansion project by assigning roles and responsibilities for existing environmental monitoring and management Formulating Environmental Action Plans (EAPs) which specify mitigation, periodic and annual monitoring activities during expansion project implementation and operation. The potential environmental impacts from the proposed expansion project are identified and the magnitude of these impacts also predicted. The potential environmental impacts to be regulated from the proposed expansion plant are summarized below: Air pollution due to the emission of particulate matter, sulphur dioxide & oxides of nitrogen mainly from boilers, Incinerator, DG sets and process emissions from manufacturing products Fugitive emissions for material / solvent handling Noise pollution due to various noise generating equipment Wastewater generation from processing units as well as from domestic activities Hazardous/Solid waste generation from manufacturing / utilities / raw material storage areas etc. In order to minimize these adverse impacts and to ensure that the environment in and around the project site as well as the neighboring population is well protected; an effective EMP is developed for construction phase as well as operation phase of the project. 5.1 Construction Phase In the proposed expansion project, no major construction activities are involved, except construction of buildings. No major site levelling, grading, transportation of the construction material are involved. However, the construction phase impacts are temporary, short term and localised phenomena except the permanent change in local landscape and land use pattern of the existing project site Air Pollution Control The construction activities and vehicular traffic contribute increase in PM, SO 2 and NOx concentrations. The mitigation measures recommended to minimize the impacts are: Water sprinkling in construction area Proper maintenance of vehicles and construction equipment Since electrical power is available in the project site, attempts will be made to utilize the electrically powered machinery to the extent possible to minimize the gaseous emissions during construction and 5.2 KKB Envirocare Consultants Pvt. Ltd., Hyderabad
251 NATCO Pharma Ltd. -Chemical Divn.- Chennai- EIA Report Chapter 5: Environmental Management Plan As far as possible, construction activities will be restricted to daytime only to minimize disturbance during night time Noise Level Operation of construction equipment and vehicular traffic contribute to the increased noise level. The noise effect on the nearest inhabitants during the construction activity will be negligible, as the noise levels will be dissipated within the project site area itself. Nevertheless, the following mitigation measures will be adopted: Good maintenance of vehicles and construction equipment Restriction of construction activities to day time only Trees planted around the plant boundary to attenuate the noise and Provision of earplugs and earmuffs to workers Water Quality The wastewater from construction equipment will contribute to increase in pollutant concentration like oil and grease. However, the following mitigation measures are recommended to minimize the impacts: Provision of sanitation facilities in the expansion project for the work force with a provision of sending sewage to existing effluent treatment plant(etp) and Waste oil collected in the oil trap will be sold to authorized recyclers for off-site recycling. Utilizing the wastewater back into the utilities / construction purpose Land Environment As mentioned, no site levelling and grading activities are involved in the project site. However, the following measures will be adopted for management of local land use. As soon as construction is completed, the surplus earth if any will be utilized to fill up the low lying areas, the rubbish is to be cleared Ecological Management All the plantation activities of the expansion project if any will be commenced along with construction activity, so that it can grow and help in the construction and operation stage of the expansion project Infrastructure Facilities Site Security and Migrant Labourers: The expansion site is secured with compound wall and manned entry points. Mainly local labourers will be employed for construction activities. 5.3 KKB Envirocare Consultants Pvt. Ltd., Hyderabad
252 NATCO Pharma Ltd. -Chemical Divn.- Chennai- EIA Report Chapter 5: Environmental Management Plan No labour camps are envisaged for the expansion project. The following facilities will be provided to the construction work force: First Aid: At work place, first aid facilities will be provided at accessible place. Potable Water: Adequate quantity of cool potable water fit for drinking will be provided at suitable places at the construction site. Rest Shelters: Rest shelter will be provided to workforce. Facilities for Women: Facilities as per applicable rules will be provided to the women workforce. Separate toilets for women are provided and marked in a vernacular language with conspicuous letters for women only. A poster showing the figure of a man and woman will also be exhibited at the entrance to toilets. 5.2 Operation Phase During operation stage the major pollution from the proposed expansion is from liquid effluents from process, utilities and domestic facilities. Air pollution from combustion of fuels (Boiler & DG set), Incineration and production process. The effluent treatment system will separate most of the solids from liquid effluents by way of evaporation salts and ETP sludge. The management action plan aims at controlling pollution at the source level to the extent possible, with the available facilities and affordable technology, followed by treatment measures before they are reused / discharged. The major contributions of pollution from proposed expansion are effluent generation from process, utilities and domestic sources and gaseous emissions from process and utilities. The majority of effluent generated will be from process and it will have considerable amount of COD & TDS load and suspended solids, which has to be effectively treated in ETP. The air pollution is caused due to combustion of fuels and product process reactions Air Environment The manufacturing process consists of reaction, separation and purification. The reaction is conducted in closed reactors, while the separation is conducted in centrifuge, filtration equipment etc. The purification would be conducted in reactors or filtration equipment. The transfer of materials will be through closed pipelines. Various sources of emissions are identified from process operations. The usage of boiler for steam generation, Incinerator for waste incineration and DG sets for emergency power back up also releases emissions. 5.4 KKB Envirocare Consultants Pvt. Ltd., Hyderabad
253 NATCO Pharma Ltd. -Chemical Divn.- Chennai- EIA Report Chapter 5: Environmental Management Plan Fugitive Emissions and Control Measures The fugitive emissions are mainly resulted from handling of solvents. All necessary precautions are taken to minimize the solvent losses to the extent possible. The predicted work room concentrations for the emissions from manufacture of all products were estimated and found to be well within the prescribed PEL limits for respective solvents. To control fugitive emissions the following facilities are provided: Vent condensers are provided to all reactors where solvents are being used. The vent condensers will be circulated with chilled water in the primary condenser and chilled brine in the secondary condenser. All vents of the bulk storages are provided with condensers. These condensers would be circulated with brine or chilled water to condense all the evaporated solvent. The same is collected and reused. Fugitive emissions are the air pollutants released in the air other than those from stacks or vents; Any chemical or mixture of chemicals, in any physical form, which represents an unanticipated or spurious leak from anywhere on an industrial site. Solvents are used for extraction of products and as reaction medium. Solvents constitute major consumable material of synthetic organic chemical manufacturing, mainly used as reaction medium. The used solvents constitute major waste stream of synthetic organic chemical manufacturing. The purpose of solvent recovery system is to recover solvents from spent solvent streams and to reuse the pure solvent in manufacturing process. Industry is having integrated solvent recovery system in the process to recover the spent solvents after reaction. The entire distillation operation of all streams is carried out in SS reactors under atmospheric pressure. Vent condensers are provided to all reactors where solvents are being distilled. The vent condensers will be circulated with chilled water in the primary condenser and chilled brine in the secondary condenser. The 90-95% pure solvent collected and reused in the manufacturing process. The solvents which are not fit for use are sent to authorized recovery units for recovery. To control fugitive emissions from process / reaction, all reactors will be equipped with two condensers primary condenser and secondary condenser. For effective condensation of vapour during reaction and distillation, primary condenser will be provided with circulation of cooling water of 28 o C / chilled water of 10 o C and secondary condenser will be provided with chilled brine solution of C as utility. All vents of condensers will be connected to the scrubber to minimize loss of solvents / process emissions in to the atmosphere. All the receiver tanks will be provided with vent condensers using chilled water circulation. 5.5 KKB Envirocare Consultants Pvt. Ltd., Hyderabad
254 NATCO Pharma Ltd. -Chemical Divn.- Chennai- EIA Report Chapter 5: Environmental Management Plan Storage of all solvents / chemicals will be in drums / storage tanks. Vent condensers will be provided to all storage tanks. Drums will be kept in covered roof with elevated platform to reduce the direct contact of sunlight thereby reducing the internal pressure and reducing the fugitive emissions from storage area while handling of any solvents in dispensing area. Transfer of solvents will be in closed conditions to further reduction of fugitive emissions as well as to reduce solvent losses during handling of solvents. Fugitive dust emissions due to traffic movement will be controlled by providing paved internal roads, regular cleaning of internal roads, proper maintenance of vehicles etc. Fugitive emissions are anticipated from equipment leakage and transfer spills. The periodic maintenance program will ensure integrity of equipment mitigating the equipment leakage. The spills however will be managed by adopting the spill management scheme as mentioned in the respective material safety data sheet (MSDS), spill control kit will be provided in storage and production blocks. The fugitive emissions will be reduced by closed transfer and handling of all solvents and chemicals. The ventilation system provided will reduce health impact on the employees by way of dilution of work room air and also dispersion of contaminated air. Measures to Reduce Fugitive Dust Emissions a) All transportation vehicles carry a valid PUC (Pollution under Control) Certificate b) All the Roads inside the plant premises are concreted or asphalted. c) Regular sweeping of all the roads & floors will be done. d) Green belt developed in an area of 3.51 Ha (33.2%), Lawn area of 0.39 Ha(3.7%) and Ha (10%). Total 4.96 Ha (47% including open space reservation land area) will be maintained to suppress the fugitive dust emissions. e) Ambient air quality is regularly monitored and effective control exercised, so as to keep emission within the limits. f) Local exhaust unit provided at source of emission Diffuse Emissions Emissions are also released from various operations viz., centrifuge, drying, distillation, extraction etc. These emissions mainly contain volatile contents of the material sent for processing. The emissions are normally passed through vents equipped with condensers / scrubber before releasing into atmosphere to mitigate odour. The emissions from distillation are passed through condensers, which mitigate odour / VOCs emissions release. The transfer pumps will be provided with mechanical seals. The transfer of solvents will be mainly by closed pipeline systems, while drum transfer is by using air operated diaphragm pumps in closed hoods. The solid raw materials will be charged through closed 5.6 KKB Envirocare Consultants Pvt. Ltd., Hyderabad
255 NATCO Pharma Ltd. -Chemical Divn.- Chennai- EIA Report Chapter 5: Environmental Management Plan hoppers to avoid dust emissions and hazard of static electricity. Breather valves will be provided to storage tanks. Thermal insulation and condensers will be provided for storage tanks of low boiling point solvents. The solvent storage tank vents will be connected to vent condensers followed by Breather valve Emissions from Utilities The gaseous emissions will be from fuel burning, which consists of common pollutants like SO 2, NO 2 and PM 10, would be discharged into atmosphere through 40 m height stack for wider dispersions and reduce the ground level concentrations from the proposed furnace oiled fired boiler of 6 TPH. These are in addition to the existing 3 TPH furnace oil fired boiler, which will be standby. Furnace oil of about 400 lit/hr used in the boiler. The various measures proposed to minimize the pollution from the boiler are as follows: To facilitate wider dispersion of pollutants, 40mm height stack each will be installed. The NOx emissions from the boilers will be controlled by controlling combustion measures, which will be approached by way of low NOx burners or by air stagging in boiler. Stacks will be provided to DG sets as per CPCB / SPCB Guidelines. Fugitive dust will be controlled by adopting dust extraction and dust suppression measures and development of greenbelt along the periphery of the proposed Boiler area Stack will be provided to the proposed DG sets of 2x10¹⁰ KVA and 100 KVA. These are in addition to the existing DG set of 1010 KVA and 300 KVA DG set will be removed. Diesel about 630 lit / hr will be used at full operation load in the DG sets. DG sets will be used as standby during power failure Process Emissions The sources of process emissions are reactors, where gaseous products are released, or excess gaseous raw material used in production, which mainly contain inorganic gases. The other emissions from process operations are mainly known as diffuse emissions containing dusts, fumes and volatile organic compounds (VOCs). The VOCs from among the diffuse emissions are the main cause of odour in the plant area and its neighborhood. Spillage, leakage and accidental releases are the cause of fugitive emissions, releasing solids, liquids and fumes of VOCs resulting in soil and ground water contamination in addition to odour in the plant area. 5.7 KKB Envirocare Consultants Pvt. Ltd., Hyderabad
256 NATCO Pharma Ltd. -Chemical Divn.- Chennai- EIA Report Chapter 5: Environmental Management Plan The HCl, Cl 2, NH 3, CO 2, N 2, H 2, O 2, SO 2, methyl bromide, Dimethylamine and Chloro ethane emissions are liberated from the process. HCl, CO 2, Cl 2, N 2, SO 2, methyl bromide and NH 3 emissions vents from the reactor will be connected to dual scrubber with suitable chilled or room temperature liquid water / caustic to scrub the emissions effectively and the scrubbing liquid sent to ETP for further treatment. H 2 will be diffused with flame arrestor and O 2 & N 2 will be dispersed into atmosphere by providing vents to the reactors/ through a stack above the production block following a standard operating procedure. Chloro ethane will be scrubbed and condensed. Dimethylamine will be scrubbed in water. The scrubbed solutions are sent for ETP for further treatment and reuse. Proposed gaseous emissions will be scrubbed in two stages with water and caustic solution based on the characteristics of gases. Proposed additional 4 scrubbers for the expansion project in addition to the existing 8 scrubbers to scrub the additional process emissions Odour Management Odour can be defined as the perception of smell or in scientific terms as a sensation resulting from the reception of stimulus by the factory sensory system. Whether pleasant or unpleasant, odour is induced by inhaling air-borne volatile organics or inorganics. Physical & chemical characteristic of specific odour are largely affected by the types of odour sources. Sources of Odour: Waste Water Treatment Plant ETP/ STP Sludge Industrial Processes Volatile (organic & inorganic) chemical Causes of Odour: Organic & inorganic compound like reduced carbon, Nitrogen & Sulphur Compound Typical odour emitting compounds like aldehydes, alcohol, Ketones, acids, ammonia, amines, sulphides, hydrogen sulphide gas & mercaptans VOCs that are less biodegradable Control of odor: Reduction of odour at generation source: Most effective way of controlling odour. This is done by storing volatile material in closed containers to prevent volatile emission and carrying out chemical reactions in closed chambers. Removal of odour from collection air stream : Effective air cleaning technologies like Scrubbers and bio-reactors 5.8 KKB Envirocare Consultants Pvt. Ltd., Hyderabad
257 NATCO Pharma Ltd. -Chemical Divn.- Chennai- EIA Report Chapter 5: Environmental Management Plan Destroying Odour emitting waste : Incineration Green Belt development : can help to mitigate the odour Odour Control Measures: Exhaust gases are routed through scrubber to adsorb odour emitting gases and released through stack of appropriate height Proper Ventilation system is provided to remediate the odour problem Incineration of hazardous odour emitting waste is done to eliminate odour Herbal de-odouriser (10 to 20% solution) shall be used to arrest foul smell emanating from effluent, sludge etc.; It can be effectively used by mixing with effluent and sprayed on to sludge bed to mask odour in the atmosphere surrounding ETP and also the far off places. Full-fledged green belt is developed. Odour is caused mainly by diffuse and fugitive emissions of low boiling organic chemicals / compounds releasing VOCs. The above mentioned measures for mitigation and control of diffuse and fugitive emissions will reduce release of VOC s into atmosphere and the resultant odour Noise Environment Noise is anticipated from motors, compressors, boiler area, pumps, cooling tower and DG sets. The DG sets will have in-built acoustic enclosures. The motors and compressors will be provided with guards and will be mounted adequately to ensure the reduction of noise and vibration. The employees working in noise generating areas will continue to be provided with earmuffs. The employees will be trained in the mitigation measures and personal protection measures to be taken to avoid noise related health impacts. An effective hearing conversation program will be undertaken where exposure to industrial noise is capable of producing hearing loss. The objective is to ensure that an employee hearing is not affected during his working life to an extent greater than that usually occurring with age and to preserve it at a level sufficient for normal speed perception. The following control aspects are identified for further implementation to reduce noise levels/exposure: DG sets are enclosed in acoustic enclosures Noise generating sources like motors and compressors will be provided with casings and guard to reduce the noise levels Placing attenuating screens between the operators and the sources. Adequate spacing between noise sources and operators will be provided. In free field conditions the sound levels roughly varies with the square of the distance. 5.9 KKB Envirocare Consultants Pvt. Ltd., Hyderabad
258 NATCO Pharma Ltd. -Chemical Divn.- Chennai- EIA Report Chapter 5: Environmental Management Plan Reflected noise is reduced by use of absorbent materials on roofs, walls and floors. By proper maintenance, which corrects vibrations and other imbalances, will be taken up Training would be imparted to plant personnel to generate awareness about the damaging effects of noise. Personal protective equipment s (PPEs) such as earplugs and ear muffs consisting of fine glass wool, ear muffs consisting of ear cups with a soft seal, fitted with a spring or adjustable headband. Comfort, maintenance and cleaning are important aspects of use. The green belt developed helps in reducing noise levels in the plant premises as a result of attenuation of noise generated due to plant operations, and transportation. Planted trees of tall as well as short trees in and around the plant area will protect the outside environment from any noise and dust nuisance. There are no major sources of industrial noise; minor noise is being generated from the industrial operations which are being controlled by proper maintenance and compact technology. Proper maintenance, oiling and greasing of machines at regular intervals is done to reduce generation of noise. Periodical monitoring is being carried out on regular basis and same will be maintained in future As per the Factories Act, the general health check-up of the workers will be checked for any Noise Induced Hearing Loss (NIHL) by a competent ENT doctor. By these measures, it is anticipated that noise levels in the plant will be maintained well below 75dB(A). The noise levels at the periphery of the plant are likely to be less than 55 db(a). The plant site is about 0.9 km from nearest habitation; no impact of noise will be felt at this village. Noise attenuation targeted & achieved with 3-4 m greenbelt of pure species monoculture Water Environment Wastewater Management The effluents generated in the process, separation techniques and during purification contain organic residues and inorganic raw materials, solvents and products. Hence the effluents contain both organic and inorganic salts in various quantities leading to high COD and TDS levels. Estimated effluents are 195 KLD from process, floor & reactor washings, scrubbing media; utility blow downs and domestic effluent will be segregated considering TDS / COD concentrations and collected by gravity into a collection tank separately and sent to the effluent treatment system for treatment. This individual effluent will be pumped to the RCC lined tanks 5.10 KKB Envirocare Consultants Pvt. Ltd., Hyderabad
259 NATCO Pharma Ltd. -Chemical Divn.- Chennai- EIA Report Chapter 5: Environmental Management Plan for storage and neutralization, then sent to ETP and treated with ZLD concept. The treated effluent in ETP will be reused for cooling tower make-up. The measures recommended for minimising the impacts and conservation of fresh water are: Proposed to reuse treated effluent as make-up water for utilities like cooling tower to reduce fresh water consumption Separate provision for storm water collection system and send the run-off water during rainy season to rain water harvesting tanks. This stored water will be used to reduce the fresh water requirement Rainwater harvesting structures Effluent Treatment Plant with Zero discharge scheme for reuse of treated water The wastewater generated from the process as well as non-process is segregated into: Stream 1 : High TDS (HTDS) effluent with TDS more than 25,000 mg/l Stream 2: Low TDS (LTDS) effluent with TDS less than 25,000 mg/l Stream 3: Utility Low TDS Effluent. Waste water generated from boiler blow down, condensate, cooling tower blow downs and utility rejects are considered in this stream. The existing ETP will be upgraded to meet the additional wastewater generated during expansion. All the proposed treatment additional tanks will be constructed / installed above the ground with water proof lining. These individual effluents will be pumped to the RCC lined tanks for storage and neutralization and then sent to upgraded ETP-ZLD of 200 KLD capacity within the plant premises. ETP ZLD facility consists of primary treatment (equalization and neutralization), secondary treatment (stripper with MEE, ATFD, ECOT & biological) and tertiary treatment (Pressure sand filter, Activated carbon filter & Reverse Osmosis) will be provided. Domestic wastewater will be sent to septic tank and the overflow to ETP (biological treatment). Concentrate from MEE system will be sent to ATFD and the salts from the evaporation system will be collected and sent to Tamil Nadu Waste Management Facility (TNWMF) for safe disposal. Environmental laboratory will be upgraded with additional glassware, equipment/ apparatus. Performance evaluation of ETP will be carried out to meet the cooling tower inlet water specifications. Additional Magnetic flow meters will be provided to inlet and outlet pipelines of segregated effluent to know the quantity of effluent generation, treatment and reuse KKB Envirocare Consultants Pvt. Ltd., Hyderabad
260 NATCO Pharma Ltd. -Chemical Divn.- Chennai- EIA Report Chapter 5: Environmental Management Plan Ground Water Management Though ground water is a replenish resource, proper management of the resource is essential due to its unequal distribution over space and time. The distribution over space is controlled by type of the rock, depth and weathering followed by the fracture pattern, intensity and their extent laterally and vertically below ground surface. Ground water being dynamic resource, it migrates following the topography of the area. Ultimately after having good aquifer material of sufficient volume, the rainfall precipitation and its infiltration into the groundwater system plays a key role in building up the potentiality of the aquifer system. Hence, the strategy of groundwater management starts with the precipitation of the rainfall at the higher reaches of surface basins, through arresting the surface water and allowing it to percolate into ground in order to recharge the ground water system by means of constructing suitable artificial recharge structures. Quality of ground water is also the major concern in recent days. Hence it is always a safe bet to make rain water harvesting practices a mandatory feature in order to lower the pressure on water / ground water utilization. Since the water requirement to the present plant and proposed expansion is from CMWSSB/ground water by tankers supply. In case if it solely from ground water from the surrounding area, that too extracting from shallow alluvial aquifers may create a local ground water depression, sometimes salt water ingression. In such case, it is suggested to pump the ground water from the wells with at least six hourly gaps, so that the well gets recouped sufficiently, and the cone of depression does not interfere. Daily requirement of 303 KLD of water will be extracted from different localities, so that there is no impact of withdrawal on aquifer Storm Water Management Storm water drainage system consists of well-designed network of open surface drains routed to rainwater harvesting tanks and pits so that all the storm water is efficiently drained off without any water logging in the existing site. Rooftop rain water will be collected separately and used for other than drinking purpose as it generally does not contain silt. Runoff volume that can be generated to the normal rainfall 1152 mm in the proposed site is given in Table 5.1. From the Table it is seen the total rainfall for the area is KL out of which KL is percolating into the ground equals to 186 days water and remaining KL of water is generated which can be used in the project equal to 215 days. There is already one storm water harvesting pond exiting in the premise with the dimensions of 28 m x 28m x 2 m with rainwater harvesting pit inside, which can accommodate about 1568 KLD of water for recycling and re use. It is also to mention that all the storm water 5.12 KKB Envirocare Consultants Pvt. Ltd., Hyderabad
261 NATCO Pharma Ltd. -Chemical Divn.- Chennai- EIA Report Chapter 5: Environmental Management Plan channels are well laid in the premises leading them all to the existing storm water pond. This storm water storage tank is insufficient to accommodate the peak hourly rain water generated (Around 3259 KLD) in the premises. In view of this it is recommended to increase the depth of the pond by 0.5 m, so that the whole of the storm water generated (1960 KLD) in the premises can be accommodated without making any additional provision for another pond. It is observed that there is a Rain water harvesting pit inside the pond, in case overflow of excess rain water collected in the pond. Whole of the pond will be fenced with barbed wire as a safety measure. Steps involved to recharge the rooftop rain water suitable to the present site are given below. Rainwater Harvesting System All the rain water from the rooftops of the permanent structures will be brought to the harvesting tanks either through pipes or open ducts, directly to rainwater collection tank cum pit of 2 nos. of 4m x 4m x 2.5m (80 KL capacity). These tanks will be in addition to the existing harvesting tank in NE corner of the plant. The collection tank will act as a clarifier to collect the silt and other matter and clear water will overflow to the rain water harvesting pit inside the tank. The collected rain water can also be used directly in process with very little treatment where very high purity of water is not required and non-process areas. In fact fresh rain water has low total dissolved salts (TDS) and is suitable for many other uses, other than drinking directly.the runoff volume available for use is presented in Table 5.1. This rooftop rain water harvesting tank, though insufficient to accommodate and recharge the peak hourly rooftop rain water of 1407m 3, provision of two recharge pits within the recharge tank will hasten and enhance the recharge process. With this arrangement, space for number of pits can be reduced, and with the single tank, maximum peak hourly rooftop rain can be recharged. Rain Water Harvesting Pits: After completing the rooftop rain water harvesting tank, two rain wain water harvesting pits, each with the dimension of 2m x 2m x 4m will be constructed with in the tank. With the excavation of 4 m deep pits, It is likely that sand zone with gravel and silt may be encountered. This pit will be refilled with 40mm boulders up to 1m depth, followed by 20mm gravel up to 0.4m. Over the gravel, coarse sand may be placed for about 0.3 m as shown in Fig.5.1. A parapet wall will also be constructed so that the sand silt coming with rain water does not settle in the pit. Nylon mesh will be placed over the sand to separate easily anything that settles over the mesh. With arrangement of two recharge pits, the recharge process can be enhanced two to three times than normally impounding in the tank. The area is having two to three metres of thick clay with sticky nature. In this type of 5.13 KKB Envirocare Consultants Pvt. Ltd., Hyderabad


262 NATCO Pharma Ltd. -Chemical Divn.- Chennai- EIA Report Chapter 5: Environmental Management Plan clay generally recharge process is very poor. The arrangement recharge tank with recharge pit will cut the entire thickness of the clay and hasten recharge process as the rain water is coming in contact with the sand zone. Table 5.1: Runoff volume Generated from Rainwater Harvesting System Land use Total Area Quantity of Rainfall Quantity of Rainfall Run-off Coefficient Quantity of Runoff from Rainfall Peak hourly Rain Water Peak Hourly Quantity of Rain Water sq.m mm KL KL mm KL Roof Area Road Area & pavements Green Belt Area Open and Other Areas Total Equaling to No. of days (303 KLD) Fig. 5.1: Rain Water Harvesting Pit in the Tank Hazardous / Solid Waste Management Hazardous / Solid wastes are generated from the process, solvent distillation, wastewater treatment and utilities. Process residue contains mainly unreacted raw materials. These are collected from the reactors and other process equipment which will be stored in drums. Solvent residue is generated from distillation units; the residues are tarry substances with good calorific value and are stored in drums. The other major waste is salts from MEE 5.14 KKB Envirocare Consultants Pvt. Ltd., Hyderabad
263 NATCO Pharma Ltd. -Chemical Divn.- Chennai- EIA Report Chapter 5: Environmental Management Plan with ATFD system. These salts are stored in HDPE lined bags. All solid waste storage containers/drums/bags are labeled showing the source, nature of hazard and type of wastes. All the hazardous wastes are stored in a covered shed with fire safety measures, and the shed is provided with a garland drain connected to the effluent treatment system. The process residue, spent carbon, distillation residue, solvent residue, incinerator ash, inorganic waste, ETP sludge, Spent mixed solvents, Misc. waste, rejects etc., will sent to Authorized Cement Industries for co-incineration/ TSDF for incineration / disposed in in-house incineration (100 kg/hr) in the Plant premises. Other Hazardous / Solid waste will be segregated, stored and disposed using 7-copy manifest system. Mixed solvents will be sent to authorized recyclers, while spent solvents are recovered within plant premises. The empty containers will be collected from all the sources of processing / warehouse area and will be kept in the covered raised platform with leachate collection and detoxification area. All containers will be detoxified under expert supervision. Detoxified containers will be used for storing the hazardous waste and the balance will be sold to scrap vendors. Wash water from the detoxifying area is sent to ETP for further treatment. Used oil / waste oil generated from the DG sets, Gear boxes, Vacuum pumps etc., will be collected separately in MS/ HDPE drums and stored in the designated area for further disposal to SPCB authorized Used / Waste oil re-processers using 7-copy manifest system. Used Batteries will be replaced with the new batteries and sold to suppliers on buy-back basis. Name boards will be provided in all dedicated areas for Hazardous / solid waste storage and maintain records for waste generation quantity, handling & storage and disposed quantity. Monthly records will be summarized and sent to SPCB for information and records. Annual Form IV statement comprising of all Hazardous waste disposal details for the financial year will be submitted to SPCB as per Hazardous & Other wastes (M & TM) Rules, 2016 and its amendments thereunder. Industry will be ensured for disposal of the Hazardous waste on priority. Other Non-Hazardous waste identified from the proposed expansion will be segregated, collected and stored in dedicated covered area before disposal to scrap vendors for recycling / reuse. HDPE & PP scrap will be sent to outside agencies for recycling. Biomedical waste & E-waste also identified from the proposed expansion with disposal options. Biomedical waste will be autoclave / disinfect before sent to the Authorized vendor. All types of Hazardous / Non-hazardous waste details with disposal options are given in Table KKB Envirocare Consultants Pvt. Ltd., Hyderabad
264 NATCO Pharma Ltd. -Chemical Divn.- Chennai- EIA Report Chapter 5: Environmental Management Plan Incinerator at NATCO NATCO Pharma-Chemical Division has installed a Venturi with Packed scrubber to incinerator and clean flue gases are dispersed into atmosphere through 40 m height stack. S. No. Waste Classification Nature Quantity (kg/hr) Handled In Calorific Value(Assumed) (Kcal/Kg) 1 Solid waste from process 2 Liquid Sludge, Spent All liquid streams Stationary Pyrolyser Combustion Chambers The combustion and flue gas cleaning system operates under safe negative pressure at all times. This prevents the combustible products to atmosphere prior to being processed through the entire incineration system. Both Main Combustion Chamber (MCC) and Post Combustion Chamber (PCC) are maintained at excess air condition at sufficient temperature and residence time to ensure the complete oxidation of wastes. Waste feeding system for both solids and liquids are automatically ceased when the temperatures are not maintained above and below the pre-determined set points Highly combustible i.e. high energetic liquid wastes are introduced into the MCC and PCC through self-atomized lances. Flue gases from MCC and Single Drum Pyrolyser (SDP) due to waste burning are retained at PCC for a residence time which is in excess of the minimum residence time required for complete oxidation Highly efficient air cleaning system traps the particulate matters and neutralizes the acidic gases prior to their release into the atmosphere System has got the in-built safety interlocks. If any operational parameter goes outside the pre-determined boundary limits, it will cause an automatic shutdown of portion/all of the incineration depending upon the particular upset parameter Green Belt Development and Plantation Programme NATCO Pharma Ltd., Chemical Division has social obligation to recreate the environmental status by providing thick green cover to suppress fugitive emission and provide aesthetic beauty. Trees form the important part of the biosphere in the Eco-system. This will help in reducing the concentration of pollutants and will also be effective in attenuating noise levels KKB Envirocare Consultants Pvt. Ltd., Hyderabad
265 NATCO Pharma Ltd. -Chemical Divn.- Chennai- EIA Report Chapter 5: Environmental Management Plan The Rare, Threatened, Endemic and Endangered species are either noticed or known to occur either from the plant area or from the surrounding areas up to 10 km radius. To compensate the adverse effects, Total Greenbelt area is 3.51 Ha (33.2% of Ha). In addition industry has given 1.05 Ha (10%) for Open Space Reservation (OSR) land for Greenbelt. Industry also developed the lawn in an area of 0.39 Ha (3.7% of Ha). Total 4.96 Ha (47%) of total area of Ha developed in and around the plant site for carbon sequestration, to provide shelter to the birds and people to restrict the adverse impacts of the industrial activity to the plant site. A total of 14 tree species exist in the current site area, apart from several seasonal scrub and herbaceous flora. The vegetation present in the present study area is purely maintained by green belt activity and rest of open area is left open. Tree species such as Alstonia scholaris (Silver oak), Pongamia pinnata, Terminalia catappa, Borassus sp, Syzygium cumini & Cocos nucifera are the visible trees. Efforts will be taken for strengthening the existing greenbelt with more flowering trees in the project site. Greenbelt area identified in the Plant Layout is shown in Fig The greenbelt development not only functions as foreground and background landscape features resulting in harmonizing and amalgamating the physical structures of the plant with surrounding environment, but also important because of the following. The development of greenbelt is an important aspect for any plant because: It acts as a 'Heat Sink'. It improves the Ambient Air Quality by controlling PM in air. It helps in noise abatement for the surrounding area. It helps in settlement of new birds and insects within itself and It increases the aesthetic value of Site. The plantation work for green belt development will be carried out as per CPCB guidelines, local species would be preferred. The natural vegetation of the area is represented by plant species, which are able to subsist and regenerate under poor moisture and soil conditions. Perennial, native tall trees, evergreen trees with very high leaf area index such as Tectona grandis, Anthocephalus cadamba will be grown in very high density along the boundary as the outer rows. The middle row will have multipurpose branched trees like Terminalia arjuna, Gmelina arborea, Mangifera indica etc. Saplings grown in polythene bags will be planted at a density of 1200 to 1500 per Ha in 2 x 3 m or 2 x 2.5 m spacing (as required). All plants are locally adapted and the present site is capable of supporting their growth with suitable horticultural practices. Sufficient resources and man power for development and maintenance is essential for a good Green belt management. A suggested list of plant 5.17 KKB Envirocare Consultants Pvt. Ltd., Hyderabad
266 NATCO Pharma Ltd. -Chemical Divn.- Chennai- EIA Report Chapter 5: Environmental Management Plan species suitable for greenbelt and list of Shrubs & Herbs proposed for plantation between the trees is given in Tables 5.2 and 5.3 respectively. Design of Green Belt: The following guidelines will be considered in green belt development. The spacing between the trees will be maintained as per CPCB Guidelines i.e. 1 tree per 4 sq.m. Spaces, so that the trees may grow vertically and slightly increase the effective height of the green belt. Planting of trees in each row will be in staggered orientation. The short trees (< 10 m height) will be planted in the first two rows (towards plant side) of the green belt. The tall trees (> 10 m height) will be planted in the outer three rows (away from plant side). Tall trees one line and short trees one line will be planted around the building house and around the production area to reduce the noise if any. Potted plants, Hedge shrubs as well as ground cover plants are used in the remaining areas KKB Envirocare Consultants Pvt. Ltd., Hyderabad
267 NATCO Pharma Ltd. -Chemical Divn.- Chennai- EIA Report Chapter 5: Environmental Management Plan Fig. 5.2: Greenbelt development 5.19 KKB Envirocare Consultants Pvt. Ltd., Hyderabad
268 NATCO Pharma Ltd. -Chemical Divn.- Chennai- EIA Report Chapter 5: Environmental Management Plan Table 5.2: List of Perennial native trees Identified for Greenbelt, Avenue and Block-Plantations Sl. Proposed Botanical name Common name Importance No. Nos. 1 Azadirachta indica Neem Shady, Pollutant absorbing & Fast growing Gmelina arborea Gamhar Broad leaved & Fast growing Manilkara zapota Sapota Fruiting bearing Holoptelea integrifolia Chilbil Shady, Pollutant absorbing, Tall & Evergreen Mangifera indica Mango Fruiting bearing 50 6 Spathodea campanulata Rugtoora Ornamental avenue tree Tamarindus indica Chinta/Imli Fruiting bearing Tectona grandis Teak Timber yielding Terminalia arjuna /Arjun Timber and shade tree Bixa orellana Jabaru kaya Shady, Native & Fast growing Mitragyna parvifolia Kaim Shady, Native & Fast growing Psidium guava Jama/Amrud Fruiting bearing Artocarpus heterophyllus Jackfruit/Katahal Broad leaved & Fast growing Dendrocalamus strictus Bamboo Tall growing Anthocephalus cadamba Kadamba Broad leaved & Fast growing Bombax ceiba Shalmali Attractive & Tall growing Acaia auriculiformis Australian wattle Attractive & Tall growing Dalbergia sissoo Shisham Multipurpose Bauhinia variegata Kachnar Attractive & fast growing 300 Total 2700 Table 5.3: List of Shrubs & Herbs proposed for plantation between the trees Sl.No. Scientific name Common Name 1 Agave cylindrica Kitha nara 2 Lantana camera lantana 3 Plumeria alba Devaganneru 4 Tecoma stans Tecoma 5 Nerium oleander Nerium 6 Euphorbia nill Euphrobia 7 Durantha repens Durantha 8 Acalypha sp 9 Murra exotica 10 Bambusa tulda 11 Vitex negundo 12 Aloe vera 13 Tagetes patula 14 Celosia argentea 15 Bougainvillea glavara 5.20 KKB Envirocare Consultants Pvt. Ltd., Hyderabad
269 NATCO Pharma Ltd. -Chemical Divn.- Chennai- EIA Report Chapter 5: Environmental Management Plan Planting methodology: The plantation will be done in pits. Pits of about 50 cm will be dug in grid of 0.5 m X 0.5 m up to a depth of 0.3 m. The pit will be refilled with soil (Red soil + Vermicomposting + Green manure). Planting will be done after first monsoon showers. The level of soil is about 10 cm above of ground level. The soil around the plant will be pressed to form a low through. About 25 gm chemical fertilizers will be added in ring of 25 cm radius around the plant (if required). Watering will be continued after plantation if any dry spells follows. Cleaning and wedding will be done twice during first and once during following seasons. Planted area will be inspected and mortality rate is to be noted ensured for each species. The dead and drying plant will be replaced by fresh seedlings. Soil: All the pits are to be filled with Red soil+ Vermicompost + Green manure for soil filling. Planting stocks are readily available from the Social Forest Department, as well as from the local private nurseries. All the plants selected are locally adapted, and the present site is capable of supporting their growth with suitable horticultural practices. Sufficient resources and man power for development and maintenance are provided in budget estimate is presented in Table 5.4. Table 5.4: Budget Estimate for Greenbelt Development Plan Physical Targets Financial Targets (Rs. in lakhs) Activity Total Selection of Site Selection of Species Maintenance Nursery development Appointing two real time employees Plantation* # 100# Total cost is Rs including plantation cost of Rs.5 Lakhs. * Approximately 1500 trees are already existing in the current site with the GBH more than 10 cm (1000 nos.) and less than 10 cm GBH (500 nos). # Proposed for the current consecutive year to replace dead saplings with new ones Major Recommendations for improving the existing green belt: Improving and strengthen the irrigation facilities Green manure to be applied every quarterly A green belt of 10 m average width must be developed along the boundary of the industry Strictly maintain suggested tree list mentioned in Table 5.2 for Plantation 5.21 KKB Envirocare Consultants Pvt. Ltd., Hyderabad
270 NATCO Pharma Ltd. -Chemical Divn.- Chennai- EIA Report Chapter 5: Environmental Management Plan Socio-economic Environment NATCO Pharma Ltd. has generated presently direct and indirect employment for 250 persons, out of which 150 persons are direct, 100 persons are indirect. After expansion, the direct and indirect employment will be 450 persons. NATCO Pharma Ltd. will give preference to the local population for employment in the semi-skilled and unskilled category. Medical and educational facilities for rural population in the vicinity are poor and the management is ready to undertake an appropriate contribution towards their improvement. Trained operators and workers in various aspects of ESH (Environment, Safety and Health) will be employed. The managers and officers involved in Environment Management cell would undergo refresher workshop, internal training programmes and updating of information on various environmental issues from time to time. The industry would help in promoting the activities related to environmental and social awareness in nearby villages Enterprises Social Commitment M/s. NATCO Pharma Limited, Chemical Division under the Enterprises Social Commitment (ESC), is carried out the requirements to the surrounding villages and the same will be continued for the surrounding habitations by identifying their requirements to get local people into confidence about the expansion project activities. Adequate funds (Rs 5 crores i.e. 5% of the proposed additional capital cost of Rs. 100 crores.) are earmarked towards enterprise social commitment, which will be spent during the first 5 years of the project. Budgetary allocation for the ESC activities for the activities identified for a period of 5 years is presented in Table 5.5. The following requirements will be met in phased manner for minimizing the adverse impacts on socio-economic and parameters of human interest: Drinking water Facility (RO) to the nearby villages LED lights & solar Panel to nearby schools Computers/Smart class rooms to nearby schools Providing nutritional Needs to Pregnant Ladies in villages Providing common Toilet & sanitation facility, Solar street lights, bus shelters to nearby villages Conducting Periodical Medical Health camp & fulfilling needs of nearby Government hospitals in the villages 5.22 KKB Envirocare Consultants Pvt. Ltd., Hyderabad
271 NATCO Pharma Ltd. -Chemical Divn.- Chennai- EIA Report Chapter 5: Environmental Management Plan S. No Table 5.5: Budget Allocation for ESC Activities Activity Budget allocation (Rs. in lakhs) Total 1. Drinking water Facility (RO) to the nearby villages LED lights & solar Panel to nearby schools Computers/Smart class rooms to nearby schools Providing nutritional Needs to Pregnant Ladies in villages Providing common Toilet & sanitation facility, Solar street lights, bus shelters to nearby villages Conducting Periodical Medical Health camp & fulfilling needs of nearby Government hospitals in the villages Total The following nearby Villages will be benefitted for the above activities Manali New Town/ Dwaraganagar 0.5km (NE) side Edayan chavadi / Elandacheri 1.3km (NE) Chennasekkadu/Polavaram 1.5km (S) Andarkuppam/ kanniyamman petti 0.9km (W) Ariyaloor 1.5km (W) Elandanur 1.6km (NE) Ammanthangal 3.6 KM (NW) Saleema nagar 0.2km (N) Kosapur KM 1.5 KM (NE) Sirugavur 5.6 KM (WNW) 5.3 Raw Materials Storage, Handling and their Management All the raw materials will be first received by the stores department and samples of raw materials will be sent to quality control (QC) laboratory wherein the quality of raw material will be tested. Only after confirmation of quality by the QC lab, the raw material will be transferred / unloaded at the respective storage area in the factory with proper labeling Approved. The raw material in general will be received in bags/ carboys/ drums as well as through tankers. Raw materials transported from the storage area to the production plant by 5.23 KKB Envirocare Consultants Pvt. Ltd., Hyderabad
272 NATCO Pharma Ltd. -Chemical Divn.- Chennai- EIA Report Chapter 5: Environmental Management Plan hydraulic trolley / trolley / lift as applicable. Modes of transportation of all raw materials to the plant site and finished products from the plant site are by road. Raw materials will be received in MS/ HDPE / fibre drums, carboys, bags, cartons and cylinders as well as through tankers. Material received from tanker will be stored in above ground tanks. All the storage tanks of hazardous flammable substances will be located within premises in separate storage area i.e. Tank farm area. Industry is having 5 warehouse storage areas in plant premises i.e. raw material storage area, solvent drum storage area, acid/alkali drum storage area, solvent storage yard (tank farm area) and engineering spares storage. All motors and electrical connections will be flame proof. All the liquid raw materials will be stored on the pallets in dedicated drum storage warehouse. The storage area for hazardous chemicals will be located within the boundary wall with a constant watch by security round the clock. All necessary firefighting system and safety arrangements will be provided near the storage area to combat any emergency accident. MSDS will be placed at each Hazardous raw material for ready information of the material Handling / Transportation of Solvents: Solvents are unloaded from road tanker to respective dedicated solvent tanks at tank farm area and solvent unloading permit system is being followed. Earth interlocking facility is available at tank farm area. Dedicated pipe lines are available for transferring the solvent from solvent yard to solvent day tanks (located at production blocks). The maximum line size is 1 to 2 dia. Color coding is being followed as per standard color coding standard. For chemicals with low consumptions will be dispensed in carboys/drums and will be transported by using forklifts to production blocks as per batch requirement and transferred to the reactors using air operated double diaphragm (AoDD) pumps or through vaccum. Spill control kit is available in the solvent dispensing area/tank farm area as well as production blocks for contain the spill and spill containment procedure in place and all employees are trained on spill containment procedure Spill Control Management The guidelines for spill control in protecting and preventing the environment from contamination will be ensured.the following are required for prevention of contamination for storage in vessels/ tanks based on the type of materials. They are: 5.24 KKB Envirocare Consultants Pvt. Ltd., Hyderabad
273 NATCO Pharma Ltd. -Chemical Divn.- Chennai- EIA Report Chapter 5: Environmental Management Plan Dyke or retaining wall Sump and drainage system Diversion system Retention tank Drip pans Absorbent Materials Practice and Requirement for liquid storage Tank Storage: Bulk chemicals, fuels or solvents will provide dyke or retaining wall around the tank. Drainage from dyke or walled storage area will be restrained by valves or other positive means. Drain valves will remain in closed position except during draining. Draining of liquid will not be commenced until sampling check is done & found free from contaminant. All dykes or wall built will be liquid tight and will be checked periodically. Standby empty tanks (dump tanks) will be available for transferring the liquid during any leakage of tank / reactor in Tank form area and near to each production blocks. Materials stored in tank will be compatible to the condition of storage such as corrosion, temperature and pressure rating. Outdoor above-ground tanks will have containment by dykes and able to hold the entire contents of the largest single tank (normally 110% capacity) plus adequate freeboard to allow for precipitation. Valves and pipelines will be audited regularly by technical and operation personnel. The job will include visual inspection for defects and deterioration, leakage, liquid accumulation, piping joints and supports etc. Truck Tanker / Drum and Vessel Contaminant: The spill control is meant to cover only the general precaution and measure throughout the whole process operations. However, each area will be individually supplemented by its own detailed procedure. Training: The team members will be trained to handle spill or leak incidents. Refresher training will be conducted regularly. Mock drill will be conducted at prescribed frequency to check & ensure sites readiness to respond in case of emergency Housekeeping, Predictive and Preventive Maintenance Maintaining a clean and orderly site is part of the environmental management policy. All areas will be cleaned routinely and wastes will be disposed as per waste disposal procedures. Floor washing is avoided and wet mopping will be adopted to minimize liquid 5.25 KKB Envirocare Consultants Pvt. Ltd., Hyderabad
274 NATCO Pharma Ltd. -Chemical Divn.- Chennai- EIA Report Chapter 5: Environmental Management Plan waste generation. Housekeeping in each area is required to be audited to ensure meeting the plant standards. A sound preventive and predictive maintenance program will be established to ensure the integrity of the piping, joints and gaskets. Pumps seal and other rotating equipment will be periodically inspected, replaced, serviced and maintained so that leak and spill will be prevented Fuel Storage, Handling and Management About 400 lit/hr of furnace oil will be used in the proposed 6 TPH oil fired boiler. Existing 3 TPH furnace oil fired boiler will be standby. Diesel of about 630 lit/hr will be used in the proposed DG sets of 2x10¹⁰ KVA & 100 KVA, in addition to existing 1 x 10¹⁰ KVA DG set. Existing 300 KVA DG set will be removed. DG set which will be used as standby during power failure. Fuel will be procured from the nearby market and it will be stored in closed sheds. 5.4 Occupational Safety and Health Aspects Many workers health and safety hazards are posed by synthesis operations. They include safety hazards from moving machine parts, pressurized equipment and pipes; heavy manual handling of materials and equipment; steam, hot liquids, heated surfaces and hot workplace environments; confined spaces and hazardous energy sources (e.g., electricity); and high noise levels. Acute and chronic health risks may result from worker exposures to hazardous chemicals during synthesis operations. Chemicals with acute health effects can damage the eyes and skin, be corrosive or irritating to body tissues, cause sensitization or allergic reactions or be asphyxiants, causing suffocation or oxygen deficiency. Chemicals with chronic health effects may cause cancer, or damage the liver, kidneys or lungs or affect the nervous, endocrine, reproductive or other organ systems. Worker exposure to chemicals can occur during manufacturing when chemicals spill, leak, or discharge from the process system and contaminate areas where workers are present. The most frequently reported industrial exposure occurs during the transfer of materials. The entry of workers into systems, equipment, or enclosures that are contaminated may occur inadvertently, but routine servicing, nonscheduled maintenance, and process monitoring appear to be the kind of activities with potential for significant exposure. Health and safety hazards may be controlled by implementing appropriate control measures (e.g., process modifications, engineering controls, and administrative practices, personal and respiratory protective equipment) KKB Envirocare Consultants Pvt. Ltd., Hyderabad
275 NATCO Pharma Ltd. -Chemical Divn.- Chennai- EIA Report Chapter 5: Environmental Management Plan The process modification will be a constant exercise of the Research and Development wing of the organization, resulting in reduced pollution loads and increased yields. The measures proposed are selection of alternative solvents / routes of synthesis, avoidance of hazardous chemicals usage and application of green chemistry principles. The engineering controls proposed for reducing occupational hazards are; provision of scrubbers, condenser systems for process equipment, piping systems, insulation to reactors, usage of transfer pumps with mechanical seals, Air Operated Double Diaphragm (AODD) pumps, Lifts and trolleys for transfer of drums or bags, closed hoods for charging raw materials, dip pipe provision for solvent and liquid raw material charging, level indicators, pressure and temperature indicators, barrier guards on moving machine parts, optimization of chemical inventory, control switches and emergency stop devices to mitigate and avoid physical, chemical, electrical and mechanical hazards. Administrative practices proposed for improving occupational safety are induction training programs, safety training programs, rotation of workers, implementation of proactive maintenance schedule, provision of standard operating procedures for all plant operations, access to MSDS for all employees, access to emergency numbers of contact, and avoidance of crowded work place, and strengthening of existing occupational health centre. Personal protective equipment will be provided to all the employees including contract employees. All the employees will be provided with safety shoe / gumshoe, helmet, masks and goggles. The other equipment like ear muffs, gloves, respirators, aprons etc., will be provided to employees depending on the work area allocated to them. The personal protective equipment (PPE) selection will strictly follow the prescribed guidelines of MSDS Medical Check-up The plant will have a medical program of pre-employment screening, periodic medical examination, emergency treatment, non-emergency treatment, and record keeping and review. The pre-employment screening and periodic medical examination will follow the guidelines of factories act. The pre-employment screening will obtain medical history, occupational history followed by physical examination and baseline monitoring for specific exposures. The existing occupational health centre will be strengthened to provide emergency and non-emergency treatment, by way of emergency first aid on site, liaison with local hospitals and specialists, arranging decontamination of victims, arranging transport of victims to hospitals, and to transfer medical records, and to provide details of incident and medical history to next care provider. The occupational health centre will maintain the health records and will analyse the records for any common symptoms and common health problems which may be due to exposure to chemicals, and or due to other occupational 5.27 KKB Envirocare Consultants Pvt. Ltd., Hyderabad
276 NATCO Pharma Ltd. -Chemical Divn.- Chennai- EIA Report Chapter 5: Environmental Management Plan hazards. Latest regular Medical health checkup for one employee is enclosed as Annexure XLVIII Occupational Health Centre within Plant Premises NATCO Pharma Ltd.-Chemical Division being a pharmaceutical company already maintains a good work culture to achieve high standards of health and hygiene as it follows FDA regulations. The health programme outlines a routine monitoring of health and safety of the NATCO Pharma Ltd.- Chemical Division work force. A regular medical check-up of each worker will be carried out once in six months and a data base for each worker will be maintained indicating any changes over a period in health factors like weight, hearing ability, eye-sight, blood pressure, hair loss, skin condition, any hereditary diseases, etc. The cause for any health effect symptoms noticed will be ascertained and proper medical treatment provided. If the symptoms indicate mild effects due to occupational exposure the person will be discontinued for any health affecting activities and appointed on other secondary duties in different workplace. Those workers exposed to hazardous chemicals handling are already provided with suitable protective equipment s. As per FDA regulations, all plant personnel change their working clothes and shoes in a separate room, undergo a wash before entering places like production area. There is no anticipated adverse impact on occupational health as utmost care & precaution is already exercised. Good communication will be maintained between plant management and operators, the health professionals and members of the hygiene and protection unit to ensure that information is passed on and that follow up actions such as further investigations or review of practices and controls are carried out. Procedures will be set up to ensure that actions are taken as necessary. However, after the proposed production enhancement, there will be a few raw materials which have not been handled previously and these are new for the plant personnel and also for the staff in the medical, safety & firefighting department. Therefore, particular importance will be given to the health monitoring of the plant personnel employed in the expansion area since these individuals will be exposed to the new chemicals Potential hazards, safety procedures, emergency measures etc. will be displayed at suitable locations at all workplaces to mitigate occupational hazards 5.28 KKB Envirocare Consultants Pvt. Ltd., Hyderabad
277 NATCO Pharma Ltd. -Chemical Divn.- Chennai- EIA Report Chapter 5: Environmental Management Plan Workers at different units may be trained properly to follow safety norms strictly to prevent incidences/accidents, about the procedures to be followed under emergency situations to minimize the intensity of impacts Awareness programmes will be conducted periodically for the workers regarding occupational hazards, safety aspects, emergency preparedness and environmental protection Strict enforcement for use of personal safety and protective devices provided to them, while they are on duty 5.5 Transport systems All the raw materials and finished products are transported by road. There will be about 32 truck trips per day to the factory. Traffic signs are placed in the battery limit. The drivers of the vehicles will be provided with TREM cards and will be explained the measure to be adopted during various emergencies. 5.6 Concept of Waste Minimization, 3r s (Recycle, Reuse & recover Techniques) Improving Efficiency: Process Development Team will be working continuously to improve the yield of products, intermediates and finished products. This reduces the amount of waste generated per kilogram of output Reducing Raw Material Usage: For an API industry, R&D is a continuous process that helps in optimization of raw material consumption in each stage of the product, thereby helping in reduction of raw material and solvent consumption, ultimately resulting in reduction of waste and improving the yield of the product. Reducing No. of Stages: During the R&D process, there are more possibilities of combining 2 or more stages / reaction steps / unit operations, thereby reducing the time lines, ultimately resulting in reduction of lead time of production and waste generation, which also helps in saving energy. Minimizing Repacking: Industry plans to purchase Raw materials from vendors in customised quantities and packing so that re-packing and issuing from the warehouse can be minimized. For example: Activated carbon could be procured in cellulose bags Minimizing Solvent Losses: Industry intends to use innovative equipment that provides less environmental exposure hence improves operation efficiency and reduces any solvent losses 5.29 KKB Envirocare Consultants Pvt. Ltd., Hyderabad
278 NATCO Pharma Ltd. -Chemical Divn.- Chennai- EIA Report Chapter 5: Environmental Management Plan Recovery: Reuse: - Recovery of heat from Boiler flue gas. - Identifying the by-products from the production of API s - Reuse of solvents after recovery within the plant premises. - Reuse of treated effluent in utilities after treatment in ETP Energy Conservation and Natural Resource Conservation: Will install energy saving equipment s and rain water harvesting will be practiced. Minimising Energy consumption: Exploring the possible technologies like using LED lights, 5 star rating pumps / air conditioners etc. 5.7 Cost Provision for Environmental, Occupation Health & Safety Measures Total capital cost earmarked towards environmental pollution control measures is Rs.5 Crores and the Recurring cost (operation and maintenance) will be about Rs.12 Crores per annum. The item wise details are presented in Table 5.6. Table 5.6: Estimated Budget for Environmental, Health & Safety Management (Capital & Recurring cost) Sl. No. Description Existing cost (in Lakhs) Proposed cost (in Lakhs) Capital *Recurring Capital *Recurring Air Pollution Control 1. Dust collection chamber with Stacks Scrubbers Vent condensers Water Pollution Control & Hazardous / Solid Waste Management 4. Expansion of existing wastewater recycling plant (ZLD) consists of stripper, MEE, ATFD, ETP, Primary RO plant, HP RO Plant, Secondary RO Plant, Sludge ** decanter & Sludge dryer, Covered sheds with leachate platforms etc. Noise Pollution Control 5. Silencers / acoustic enclosures Others 6. Greenbelt Development Occupational Health and Safety Fire Management Dyke walls and Storm water drains Environmental Laboratory Miscellaneous Total * Recurring cost includes manpower, consumables, maintenance, energy charges per annum ** Includes transportation, handling and disposal charges of hazardous waste KKB Envirocare Consultants Pvt. Ltd., Hyderabad
279 NATCO Pharma Ltd. -Chemical Divn.- Chennai- EIA Report Chapter 5: Environmental Management Plan 5.8 Environmental Monitoring Programme Introduction Regular monitoring of environmental parameters is of immense importance to assess the status of environment during plant in operation. With the knowledge of baseline conditions, the monitoring programme will serve as an indicator for any deterioration in environmental quality due to operation of the expansion project, to enable taking up suitable mitigatory steps in time to safeguard the environment. Monitoring is as important as that of control of pollution since efficiency of control measures can only be determined by monitoring. The baseline study is carried out for summer season. Hence, post project monitoring programme of the environmental parameters is essential to take into account the changes in the environmental quality to ascertain the following: State of Pollution within the plant site and in its vicinity. Generate data for predictive or corrective purpose in respect of pollution. Examine the efficiency of air pollution control system adopted at the site. To assess environmental impacts. Monitoring will be carried out at the site as per the norms of CPCB. Environmental Monitoring Programme will be conducted for various environmental components as per conditions stipulated in Environmental Clearance Letter issued by MoEF&CC & Consent to Operate issued by TNPCB. Six monthly compliance reports will be submitted on regular basis to MoEF&CC, Regional Office, Chennai on 1st of June & 1st of December. Quarterly compliance Report for conditions stipulated in Consent to Operate will be submitted to SPCB on regular basis Environmental Management System In order to maintain the environmental quality within the standards, regular monitoring of various environmental components is necessary. The company has a fullfledged environmental management cell (EMC) reporting directly to EHS Manager for environmental monitoring and control. The EMC team takes care of pollution monitoring aspects and implementation of control measures. A group of qualified and efficient engineers with technicians is deputed for maintenance, up keeping and monitoring the pollution control equipment, to keep them in working at the best of their efficiencies. For effective and consistent functioning of the plant, the EMS at the site will be strengthened further with the following: Environmental management cell covering EHS (Environment, Health & Safety) team: 5.31 KKB Envirocare Consultants Pvt. Ltd., Hyderabad
280 NATCO Pharma Ltd. -Chemical Divn.- Chennai- EIA Report Chapter 5: Environmental Management Plan Environmental Monitoring Personnel Training Regular Environmental Audits and Corrective Action Plan Documentation Standard operating procedures, Environmental Management plans and other records Environmental Management Cell Responsibilities It is necessary to have a permanent organizational set up charged with the task of ensuring its effective implementation of mitigation measures and to conduct environmental monitoring. The major duties and responsibilities of Environmental Management Cell will be as under: To implement the environmental management plan (EMP) To Ensure regulatory compliance with all relevant rules and regulations To ensure regular operation and maintenance of pollution control devices To minimize environmental impacts of operations by strict adherence to the EMP To initiate environmental monitoring as per approved schedule Review and interpretation of monitored results and corrective measures with reference to prescribed standards Maintain documentation of good environmental practices and applicable environmental laws for ready reference. Maintain environment related records. Coordination with regulatory agencies, external consultants, monitoring laboratories. Organising meetings of the Environmental Management Committee and reporting to the committee To improve the capacity building of the Environment Department, as a part of the management hierarchy a separate division has been created under the General Manager(O)- Operations in the form of Manager- Environment, Health & Safety (EHS) who is assisted by Assistant Manager, Officer, Supervisors /Chemists, Operators and Indirect/contract workers. One of the Assistant Managers will be for Documentation, procedures & Compliances and also heading the operations assisted by officers, operators & helpers.the Organizational Structure of Environmental Health and Safety is presented in Fig The Organizational Structure of Environmental Health and The Environment Manager, Occupational health & safety (OHS) are fully responsible for the OHS aspects of the employees, workers and will be assisted by Assistant Manager who monitor the on-site & off-site emergency teams and assisted by the Officer for compliances of OHS norms KKB Envirocare Consultants Pvt. Ltd., Hyderabad
281 NATCO Pharma Ltd. -Chemical Divn.- Chennai- EIA Report Chapter 5: Environmental Management Plan Any non-compliance/violations witnessed by any employee in the organization can directly communicate the same to the Manager-EHS, who will assess the serious and not so serious violations /non-compliances and will communicate to the Plant Head. Any non-compliances/violations of serious nature will be addressed by the Plant head to Executive Vice-President and Executive Vice-President shall consult with the directly involved officials and will report to the Board of Directors of the company. The primary focus is to comply with the regulations and work out on action taken report to be placed before the Board of Directors. Similarly a preventive action for non-recurrence of such violations/noncompliances will also be worked out and strict monitoring will be done by the Management for implementation of the same. Vice Chairman & CEO Executive Vice President GM (Operations)/ Plant head Manager - EHS Asst.Manager- Environment Documentation & Compliance and Operation Environment Officer for Operation Chemist/Operators for Operation Fig. 5.3: Organisational Structure of Environment, Health & Safety 5.33 KKB Envirocare Consultants Pvt. Ltd., Hyderabad
282 NATCO Pharma Ltd. -Chemical Divn.- Chennai- EIA Report Chapter 5: Environmental Management Plan Environmental Monitoring and Reporting Procedure Monitoring may take the form of direct measurement and recording of quantitative information, such as concentrations of discharges, emissions and wastes, for measurement against corporate or statutory standards, consent limits or targets. It may also require measurement of ambient environmental quality in the vicinity of a site using ecological/biological, physical and chemical indicators. Monitoring may include socioeconomic interaction, through local liaison activities or even assessment of complaints. Monitoring will also be required to meet compliance with statutory and corporate requirements. Finally, monitoring results will provide the basis for auditing Objectives of Monitoring The objectives of environmental post-project monitoring are to: Verify effectiveness of planning decisions Measure effectiveness of operational procedures Confirm statutory and corporate compliance and Identify unexpected changes Monitoring Schedule for Construction and Operation Phases Environmental monitoring schedules are prepared covering various phases of project advancement, such as construction and operation phases. Construction Phase The proposed expansion project envisages setting up of additional buildings and machinery, establishment of production and chemical/solvent storage facilities. The construction activities are expected to last for about one year. As there are no major construction activities for the plant, simple and generic environmental monitoring measures that need to be undertaken during project construction stage are given in Table 5.7. Sl. Potential No. Impact 1. Air Emissions Table 5.7: Environmental Monitoring during Construction Stage Action to be Followed All equipment s are operated within specified design parameters Vehicle trips to be minimized to the extent possible Any dry, dusty materials stored in sealed containers or prevented from blowing Parameters for Monitoring Frequency of Monitoring Random checks of Monthly equipment logs/ manuals Vehicle logs Monthly, during site clearance & construction activities Absence of Monthly during stockpiles or open construction activities containers of dusty materials KKB Envirocare Consultants Pvt. Ltd., Hyderabad
283 NATCO Pharma Ltd. -Chemical Divn.- Chennai- EIA Report Chapter 5: Environmental Management Plan Sl. No. Potential Impact Action to be Followed Ambient air quality within the plant premises of the unit to be monitored 2. Noise levels List all noise generating machinery onsite along with age to be prepared. Parameters for Monitoring Ambient air quality will conform to the standards for NAAQ parameters and VOC Equipment logs, noise reading Frequency of Monitoring As per CPCB/ SPCB requirement or on monthly basis Regular during construction activities 3. Wastewater Discharge Equipment to be maintained in good working condition. Night working is to be avoided. Generation of vehicular noise Implement good working practices (equipment selection and siting) to minimize noise and also reduce its impacts on human health (ear muffs, safe distances, and enclosures). No machinery running when not required. Acoustic mufflers / enclosures to be provided in large engines Noise to be monitored in ambient air within the plant premises. All equipment s operated within specified design parameters. Vehicle trips to be minimized to the extent Working hour records Maintenance of records of vehicles Site working practices records, noise reading Mufflers / enclosures will be in place. Spot Noise recording possible No untreated discharge Discharge hoses will be connected to Collection of ETP 4. Soil Erosion Minimize area extent of construction site by staying within the defined boundaries 5. Waste Management Implement waste management plan that identifies and characterizes every Daily records Daily records Periodic during construction activities Prior to use of equipment. Monthly and as and when required Random checks of Periodic during equipment logs/ construction activities manuals Vehicle logs Monthly during construction activities Construction site boundaries not extended / breached as per planned document. Follow as per waste management plan Periodic construction activities waste arising associated 5.35 KKB Envirocare Consultants Pvt. Ltd., Hyderabad during Periodic during construction activities Periodic check during construction activities
284 NATCO Pharma Ltd. -Chemical Divn.- Chennai- EIA Report Chapter 5: Environmental Management Plan Sl. No. Potential Impact Action to be Followed with proposed construction activities and which identifies the procedures for collection, handling & disposal of each waste arising. 6. Non-routine Plan to be drawn up, events and considering likely accidental releases emergencies and steps required to prevent/limit consequences. 7. Health Employee and migrant labour health check ups 8. Flora and fauna Vegetation development as per CPCB guidelines Parameters for Monitoring Mock drills and records of the same All relevant parameters including HIV No. of plants, species Frequency of Monitoring Periodic during construction activities Regular check ups During site clearance and as applicable Operation Phase During operation stage of the project, air emissions from process areas, Boilers, DG sets, incinerator, ETP treated effluent, hazardous and non-hazardous waste generation is envisaged. The following attributes which merit regular monitoring based on the environmental setting and nature of project activities are listed below: Source emissions and ambient air quality Work zone monitoring for VOCs/solvents in air Groundwater levels and ground water quality in bore wells Raw and ETP effluent quality Hazardous and solid waste characterization (process hazardous waste, oily wastes, ETP sludge, used and waste oil) Soil quality Noise levels (equipment and machinery noise levels, occupational exposures and ambient noise levels) and Ecological preservation and afforestation KKB Envirocare Consultants Pvt. Ltd., Hyderabad
285 NATCO Pharma Ltd. -Chemical Divn.- Chennai- EIA Report Chapter 5: Environmental Management Plan Monitoring Schedule: Details of the Post Project Environmental Monitoring schedule, which will be undertaken for various environmental components, are detailed below: Sl.No. Description Frequency of Monitoring 1. Ambient Air Quality at Plant site Continuous with the existing auto AAQ station and Once in a month for other NAAQ parameters at 3 locations with 1 upwind, 1 downwind and at plant site 2. Ground Water Quality Yearly 3. Noise Level Monitoring Monthly 4. Soil Quality Yearly 5. ETP Raw & Treated Daily 6. Utilities Stack/Scrubber Monthly Methodology Adopted: Post project monitoring will be carried out as per conditions stipulated in Environmental Clearance Letter issued by MoEF&CC and Consent to Operate issued by TNPCB as well as according to CPCB guidelines. The plant site is considered as core zone and the area lying within 10 km radius from the plant site is considered to be the buffer zone. In the Buffer zone slight impact may be observed and that too is occasional. Post project monitoring programme is presented in Table 5.8. Sl. No. Table 5.8: Environmental Monitoring Plan during Operation Phase Potential Parameters for Frequency of Action to be Followed Impact Monitoring Monitoring Stack emissions from Gaseous emissions Monthly with process stacks to be (HCl, SO 2, CO 2, NH 3, recommended optimized and monitored Cl 2, and as methods of CPCB 1. Air Emissions Stack emissions from Boiler,and DG sets to be monitored Stack emissions from Incinerator Ambient air quality within the plant premises of the proposed expansion unit and nearby habitations to be monitored. Exhaust from vehicles to be minimized by use of fuel efficient vehicles and well maintained vehicles having PUC certificate. applicable) Gaseous emissions (PM, SO 2, HC, NOx) Online CEMs for Boiler and Monthly with recommended methods of CPCB As per PCB / CPCB Monthly with recommended methods of CPCB Ambient air quality will conform to the standards for NAAQ parameters (MoEF circular dated ) and HCl, Cl 2 and HC Vehicle logs to be maintained Online continuous AAQ one station and Monthly in Industry and nearby habitants with recommended methods of CPCB KKB Envirocare Consultants Pvt. Ltd., Hyderabad
286 NATCO Pharma Ltd. -Chemical Divn.- Chennai- EIA Report Chapter 5: Environmental Management Plan Sl. No. Potential Impact 2. Noise Levels Action to be Followed Measuring onsite data of Meteorology Vehicle trips to be minimized to the extent possible Noise generated from operation of boiler/cooling towers to be optimized and monitored (3 locations within plant and 2 locations outside plant) Parameters for Monitoring Wind speed, direction, temperature, relative humidity and rainfall. Vehicle logs Spot Noise Level recording; Leq(night), Leq(day), Leq(dn) Frequency of Monitoring Continuous monitoring using auto weather station during operation phase Daily records Regular and Monthly 3. Wastewater Discharge Noise generated from operation of DG sets to be optimized and monitored Generation of vehicular noise Segregated effluent Stream wise (3 streams) Maintain records of vehicles ETP performance will be monitored for raw and treated effluent characteristics for reuse of treated effluent. Monthly Daily with internal lab and monthly from authorized lab 4. Drainage and effluent Management 5. Water Quality 6. Work zone air quality In-house ETP treated Effluents reuse in Cooling Towers Ensure closed drainage system connecting to ETP collection tanks and specific design measures are working effectively. Groundwater quality surrounding plant site Contaminants such as VOCs to be reduced by providing adequate ventilation Basic parameters like ph, TSS, TDS, COD, Oil & grease ph, TDS, COD and Temperature etc. Visual inspection of drainage and records thereof Comprehensive monitoring as per BIS Indoor monitoring of VOCs. Daily and Online continuous monitoring system sensors for treated effluent. Daily Quarterly Online continuous VOC monitoring system with alarm system and Daily at all process and storage areas KKB Envirocare Consultants Pvt. Ltd., Hyderabad
287 NATCO Pharma Ltd. -Chemical Divn.- Chennai- EIA Report Chapter 5: Environmental Management Plan Sl. Potential No. Impact 7. Hazardous / Solid Waste Management Action to be Followed Implement waste management plan that identifies and characterizes every waste arising associated with proposed activities and which identifies the procedures for collection, handling & disposal of each waste arising. 8. Soil quality 3 locations within plant site, solid waste storage area, near production block and ETP area 9. Occupational Health Parameters for Monitoring Records of solid waste generation, storage and disposal Physico-chemical parameters and Heavy metals. Frequency of Monitoring Periodic during operation phase Half yearly Employees and migrant All relevant Once in a Year labour health check -up parameters including HIV Comprehensive Pre-employment medical checkup for all employees. Medical examination will be done for all the employees once in a year. Tie up with local hospitals and Govt. health monitoring system will be engaged during emergency. Dispensary and ESI facility will be provided to all workers as applicable All safety gears will be provided to workers and care will be taken by Environmental Management Cell (EMC) that these are used properly by them. All safety norms will be followed Location of Monitoring Stations Location of the monitoring stations will be selected on the basis of prevailing micro meteorological conditions of the area like; Wind direction & Wind speed, Relative Humidity, Temperature. Post project air quality monitoring will be carried out at plant site and 2 locations (one each in upwind and downwind direction) to asses ambient air quality of the area. Major surface water bodies and ground water quality monitoring will be carried out. Regular monitoring of noise will be done to control noise levels at plant site. Soil quality will be tested of the plant site area regularly to keep check on any leakage in storing hazardous waste. Locations for the post project monitoring will be as under: Sl. Description Location of Monitoring No. 1. Ambient Air Quality Plant site, Villages in upwind & downwind direction (with Max. Ground level concentration) from the plant site 2. Noise Level Monitoring Plant Boundary, High Noise generating areas within the plant boundary 3. Water Quality From Nearby Source and Ground Water Source 4. Soil Quality At plant Site and Nearby area 5.39 KKB Envirocare Consultants Pvt. Ltd., Hyderabad
288 NATCO Pharma Ltd. -Chemical Divn.- Chennai- EIA Report Chapter 5: Environmental Management Plan Monitoring and Data Analysis Air Quality Monitoring and Data Analysis Stack Monitoring: The emissions from all the stacks will be monitored for exit gas temperature, velocity and pollutant concentrations. Any deviation from the design criteria will be thoroughly examined and appropriate correction will be initiated. Air blowers will be checked for any drop in exit gas velocity. The industry has installed the continuous emission monitoring system (CEMS) in the flue gas outlets of the Incinerator with night vision cameras as per the CPCB guidelines and informed to the CPCB. Work Zone Monitoring: The concentration of air borne pollutants in the workspace/work zone environment will be monitored periodically. If concentrations higher than threshold limits are observed, the source of fugitive emissions will be identified and necessary measures taken. Industry has installed the 3 Online VOC analysers at various locations in the plant premises with alarm facility. Data s are uplinked to Care Air centre- TNPCB. In addition to this, Industry is monitoring the ambient air quality (AAQ), Stack emissions monitoring at Boilers, DG sets, effluent treatment at various stages of treatment, Noise levels, VOC within plant premises from time to time with the help of third party laboratory. The industry has established in-house laboratory to monitor the effluent parameters and also equipped with portable instruments to measure VOC/sound levels etc. Ambient Air Quality Monitoring: The concentrations of RSPM/ PM 10, SO 2, NO X, VOC,CO and HC in the ambient air will be monitored at regular intervals. In case of any excess concentration in the ambient air quality due to the proposed production enhancement, proponent will take necessary action and follow the air pollution control measures. Greenbelt will further be developed for minimising dust propagation. The ambient air quality data will be transferred and processed in a centralised computer facility equipped with required software. Trend and statistical analysis will be carried out. Industry installed the online continuous AAQ monitoring station (mobile van) in plant premises and connected to TNPCB website- Care Air Centre. Anyone can watch the hourly AAQ levels in terms of PM 10 through TNPCB website Water and Wastewater Quality Monitoring and Data Analysis To ensure a strict control over the water consumption, flow meters will be installed for existing and proposed facilities for all major inlets in expansion. All leakages will be identified and rectified. In addition, periodic water audits will be conducted to explore possibility of water conservation. Industry will analyse the basic parameters and the procedures prescribed in "Standard Methods for Examination of Water and Wastewater" prepared and published jointly by 5.40 KKB Envirocare Consultants Pvt. Ltd., Hyderabad
289 NATCO Pharma Ltd. -Chemical Divn.- Chennai- EIA Report Chapter 5: Environmental Management Plan American Public Health Association (APHA), American Water Works Association (AWWA) will be followed for all the parameters of monitoring. Groundwater Monitoring: The monitoring of groundwater is the most important tool to know the variations from the baseline study. This is indispensable as it provides detection of the presence of waste constituents in ground water in case of leachate migration. In this project, chances are very less for leachate as the total effluent is segregated and is sent to ETP ZLD and the treated effluent is reused in cooling tower makeup. The water samples from the bore wells will be analysed for relevant parameters as per monitoring program. Records of analysis will be documented. Monitoring of Wastewater Streams: All the segregated wastewater streams will be regularly measured for flow rate, physico-chemical, nutrient & demand parameters. The monitoring will be carried out from stream wise raw wastewater, raw and treated effluent characteristics of ETPs before recycling to utilities. These data will be documented and compared against the design performance values of ETPs for necessary corrective action. The ETP will be operated and maintained by existing & additional skilled and dedicated personnel. Daily log sheets for no. of hours of the ETP operation, chemicals, electrical and steam consumption; effluent monitored parameters with their results, etc. will continue to be maintained. In addition, as per CPCB guidelines, Industry also installed online ph, TDS, TSS, COD & BOD analysers along with CCTV facility to monitor the treated effluent quality as per TNPCB/CPCB guidelines and real time monitoring data s are uplinked to TNPCB Water Quality Watch centre Noise Levels Noise levels in the work zone environment such as boiler house, cooling tower area, and DG house will be monitored. The frequency will be once in a month in the work zone. Audiometric tests will be conducted periodically for the employees working close to the high noise sources Soil quality Soil quality will be tested for the parameters given in schedule Reporting Schedules of the Monitoring Data It is proposed that voluntary reporting of environmental performance with reference to the EMP will be undertaken. The environmental monitoring department will co-ordinate all monitoring programmes at site and data thus generated will be regularly furnished to the State regulatory agency. The frequency of reporting will be on monthly basis to the local state 5.41 KKB Envirocare Consultants Pvt. Ltd., Hyderabad
290 NATCO Pharma Ltd. -Chemical Divn.- Chennai- EIA Report Chapter 5: Environmental Management Plan PCB officials and six monthly reports to Regional Office of MoEF&CC. The Environmental Audit reports will be prepared for the entire year of operations and will be regularly submitted to regulatory authorities in Form V Environmental Statement Environmental Laboratory Existing laboratory will be upgraded with well-equipped analytical instruments and consumable items for monitoring of environmental parameters at the site. Alternatively, monitoring will be continued to be outsourced to a recognized/approved laboratory. The following equipment and consumable items will be made available at the site for environmental monitoring Air Quality and Meteorology Existing: Online Continuous AAQ monitoring station, Auto weather station, Online VOC analyser, Spectrophotometer (visible range), Single pan balance, Relevant Chemicals as laid down in IS: Proposed: Reagents, equipment s to analyse the standard parameters and applicable process emissions, Personal Dust sampler Water and Wastewater Quality The sampling is done as per the standard procedures laid down by IS: The equipment s available in the Environmental Laboratory are Heating Mantle, Digital conductivity meter, Digital ph Meter, COD Digestion Apparatus, BOD Incubator, Hot air oven, Muffle Furnace, Thermometer, Microprocessor based conductivity meter, Microprocessor based ph Stat Analyzer, Electronic Balance, HOT Plate, Mechanical Balance, Hand Held DO meter, Hand Held Turbidity meter, Magnetic Stirrer and consumables, chemicals and Glassware. In addition, this industry installed online continuous sensors at treated effluent outlet pipes for ph, TOC, Electrical conductivity, etc. Proposed: Digital COD reflux set-up, Refrigerator, Oven and other relevant equipment and chemicals Noise Levels Noise monitoring will be done utilising an integrating sound level meter to record noise levels in different scales like A-weighting with slow and fast response options Occupational Health and Safety Aspects All the preventive and corrective actions to protect the health of all the employees, from any possible occupational health problems will be undertaken KKB Envirocare Consultants Pvt. Ltd., Hyderabad
291 NATCO Pharma Ltd. -Chemical Divn.- Chennai- EIA Report Chapter 5: Environmental Management Plan Exposure to chemicals: As the company is proposing to handle acute toxic chemicals like phosgene or cyanide, the specific precautions needed to prevent exposure of employees to the chemicals in various physical forms will be ensured. All the reactors, centrifuges, etc., will be operated only in closed condition All the liquids will be added only through fixed pipelines Solids will be added through closed system Centrifuges and catch pots will be connected to vent condensers with chilled brine circulation and nitrogen blanketing All the storage tanks will be provided with vent condensers Solvent transfer lines will be provided with mechanical seals Primary and Secondary condensers will be provided for all the reactors Two stage scrubbers will be provided for process emissions treatment Fugitive emissions will be monitored Exposure to dust: Addition of solids / powders will be done only through closed system. Dust collectors will be provided wherever dust generating operations like milling, shifting, packing etc. Noise: Maximum noise is generated from DG sets, compressors and boilers. To reduce the noise levels, silencers and noise resistant enclosures will be provided. Periodic noise level monitoring will be carried out to ensure the noise levels are maintained within the permissible levels. Illumination: In all the work places, adequate ventilation and illumination will be ensured. Routine monitoring will be conducted to ensure that illumination in all places is above 500 lux. Heat: Arrangements will be made to ensure that employees are not exposed to temperatures above permissible limit. Air conditioning will be provided wherever activities are carried out in closed rooms. Temperature mapping will be carried out on daily basis. Musculo-skeletal problems: Employees will not lift weights beyond the limits prescribed by the Factories Act. Seating facilities will be provided to employees, who normally stand while working. Those employees who normally sit while working, ergonomically designed chairs and tables will continue to be provided. In addition to the above, the following facilities will continue to be provided in concordance with Indian Factories Act. Candidates on recruitment, safety training will be given for one week on handling of chemicals 5.43 KKB Envirocare Consultants Pvt. Ltd., Hyderabad
292 NATCO Pharma Ltd. -Chemical Divn.- Chennai- EIA Report Chapter 5: Environmental Management Plan Potable drinking water will be provided Adequate latrines, urinals and washing facilities will be provided for male and female employees separately Ambulance room, rest rooms and lunch room/canteen will be provided First aid facilities will be provided in production areas, maintenance workshop, laboratories and at the security office Training on First aid will be provided to all the employees All the wastes generated will be properly treated, stored and disposed off Cleanliness will be maintained throughout the premises Personal protective equipment s (PPEs) suitable for various operations will be supplied to all the employees. Pre and post-employment medical checkup will continue to be conducted. The tests will include, but not limited to the following: Blood test: Blood group and Rh factor, Blood sugar, Fasting and Post Meal Total count/differential count Lipid profile Erythrocyte sedimentation rate Routine urine test Liver function tests Pulmonary function test ECG Chest X-ray Audiometry Vision test Complete physical examination. The results of these tests will be assessed by company's Medical Officer and his recommendations will be implemented. Industry is already entered into the agreement with the nearby hospitals in case of emergency and Medical officer is visiting industry regularly. The post-employment tests will be conducted regularly. Company will employ qualified paramedical staff so that one person is always available in each shift. First aid training will be given to employees, so that such employees will be available in all the shifts. The above activities will be undertaken to ensure that the employees do not suffer from any health problems due to their occupation. Employees also trained for First-Aid / Emergency Response etc., in 1: 10 ratio. List of Emergency Response Team also displayed near 5.44 KKB Envirocare Consultants Pvt. Ltd., Hyderabad
293 NATCO Pharma Ltd. -Chemical Divn.- Chennai- EIA Report Chapter 5: Environmental Management Plan entrance and a Badge placed in Helmet of the Employee for easy recognize during emergency. M/s NATCO Pharma Limited-Chemical Division will continue to follow the safety norms as per the guidelines of the National Safety Council for a process industry and will provide all the necessary safety equipment for the protection of the Industrial establishment as well as the personnel working in the plant premises. Personnel Protective Equipment s (PPEs) will be provided to all its employees who are involved in the handling of hazardous activities. The storage and handling of various chemicals will be according to the norms of MSDS and the Inspector of Factories. Personnel involved in the production will be provided with protective clothing, helmets, goggles, masks, gloves, etc. These handling operations will be carried out under the strict supervision of the trained and highly skilled personnel. Supervision will be provided to ensure the usage of these PPE s. Necessary firefighting facilities like extinguishers, sand buckets etc., will be provided to meet the on-site emergencies. A detailed On-site emergency plan will be prepared for expansion project and implemented as per the provisions of Factories Act. An agreement has been made with a nearest hospital for treating the employees due to unforeseen emergencies. To take care of Occupational Health, the following measures will be implemented: Existing Occupational Health Centre will be strengthened and this will be manned by certified paramedical attendants, round the clock Adequate Wash and Toilet facilities will be provided to all employees, separately for male and female employees Canteen facility will be upgraded to meet the requirement of proposed employment. Cool, potable, drinking water will continue to be provided at various locations, easily accessible to all employees For people doing their work standing, seating facilities will be provided to relax in between For employees doing their work seating, ergonomically designed seats will be provided Evaluation Plan of health workers By pre-designed format during pre-placement and periodical examinations. Proper schedule will be devised and followed with help of occupational health experts and doctors. Health effects of solvents & chemicals used and health hazard plans based on monthly correlation of related diseases and people affected KKB Envirocare Consultants Pvt. Ltd., Hyderabad
294 NATCO Pharma Ltd. -Chemical Divn.- Chennai- EIA Report Chapter 5: Environmental Management Plan Flood Incident Mitigation Plan The mitigation on loss study is prepared collectively after several discussions with all related departments like Production, Engineering, Experts inputs and Learnt from previous experiences. The methodology followed for mitigation plan by 1. Risk identification 2. Risk mitigation action plan Risk identification The following are major and critical area which are considered on Risk identification areas Power distribution system Power generation system High cost/hazardous material storing system Critical equipment/instrument location Risk mitigation Action plan Power Distribution system: 1. Standby 300KVA DG shifted to 1 st floor to provide uninterrupted power connections to the critical equipment s in stores, QC & Production departments and emergency lights. 2. All Power distribution electrical panels are lifted at elevated height. 3. All network switches & servers are lifted to 2 Meter height. 4. In HT yard Vacuum circuit Breaker (VGB) lifted to 1 Meter height. Power Generation system: KVA DG lifted to 1.2 M elevated height to avoid the damages during flood KVA DG shifted to 1 st Floor to provide emergency power supply. 3. Air compressors are shifted to 1.2 M height. High cost/hazardous material storing system: 1. Raw Material & Engineering Stores, Critical and expensive material are stored at elevated 2 Meters. 2. Maintaining minimum stock of raw materials during rainy season. 3. Storing Finished Good (FG) items at elevated Locations. Critical equipment location: 1. Shifting & placing the Refrigerator & Deep Freezer in RM 2M elevated height. 2. All the critical mobile equipment placed at elevated height. 3. Critical electronics equipment are placed at elevated level KKB Envirocare Consultants Pvt. Ltd., Hyderabad
295 NATCO Pharma Ltd. -Chemical Divn.- Chennai- EIA Report Chapter 5: Environmental Management Plan 4. ETP online instruments such as ph analyser, TSS Analyser, TDS analyser & TOC analyser are 2.5 Meter height. Safety Precautions: Nos Life jackets & Lifebouy are purchased for emergency usage. 2. Anti-venom injections & adequate first aid materials are in place. 3. Diesel operating water pumps are purchased to dewatering the critical area. 4. Additional responsibilities given to Emergency response team(ert) to create awareness & provide communications to factory officials during flood emergency situation by consulting with government bodies/officials KKB Envirocare Consultants Pvt. Ltd., Hyderabad
296 Chapter 6 Analysis of Alternatives
297 NATCO Pharma Ltd.-Chemical Division- Chennai- EIA Report Chapter 6: Analysis of Alternatives Chapter 6 Analysis of Alternatives 6.1 Analysis of Alternative sites M/s. NATCO Pharma Limited, Chemical Division proposes to expand Active Pharmaceutical Ingredients (APIs) & its Intermediates with R&D facility in the existing area of Ha. The Unit is located in R.S.Nos. 73/1A, 73/2, 74/7B, 78/1B, 79/1, 79/2B, 79/3, 79/4B, 79/5, 79/6A, 79/6B, 79/7, 80/1, 80/2, 80/3, 80/4, 84/1, 84/2, 84/3A, 84/5A, 84/6, 84/7A, 85/1, 85/2B, 86/2B, 86/2C, 86/2D2, 86/3B, 86/4, 86/5, 86/6, 86/7, 86/8, 86/9 of Manali Industrial Area, Thiruvottiyur Taluk (formerly Vaikkadu (V), Ambattur (Tq.)), Thiruvallur District, Tamil Nadu. The unit is located in Manali Industrial Area. Also, having its address as No.74/7B, Vaikkadu TPP Salai, Manali, Chennai. The project site was reclassified from Primary Residential use zone to Special and Hazardous use zone by Chennai Metropolitan Development Authority (CMDA). The proposed expansion site is well connected by Road and Air with Chennai. This is existing unit and therefore Alternate sites are not considered for the proposed expansion project. Availability of the supporting facilities include skilled manpower is available in abundance since plant is close to the city of Chennai. Rehabilitation and Resettlement is not applicable to this project site as the expansion site is existing industrial land and located in Manali Industrial Area. Land is in possession of project proponent. Environmental considerations for proposed expansion project site are as under: Existing industry going for Expansion There are no rare or endangered or endemic or threatened (REET) species of animals or birds. Availability of adequate land for the proposed expansion plant Proximity to end users Proposed project land is in existing land only and doesn t involve R&R issues 900 m away from human habitation, Kanniyammanpettai village (W) and Manali Town at 1.6 km (S) 6.1 KKB Envirocare Consultants Pvt. Ltd., Hyderabad
298 NATCO Pharma Ltd.-Chemical Division- Chennai- EIA Report Chapter 6: Analysis of Alternatives Water Bodies a. Kadapakkam Panchayat Lake 1.5 km (NW) b. Retteri Lake at 6.3 km (SW) c. Puzhal Lake at 8 km (WSW) d. Korttalayar R at 1.8 km (NE) There is no National Park or Wild life Sanctuary or Eco sensitive area within 10 km radius Exist Transportation and Communication network Topographically, the project site is plain, with gentle slope Proximity of National Highway-16, Transport of raw materials and manufactured drugs Availability of infrastructure facilities 6.2 KKB Envirocare Consultants Pvt. Ltd., Hyderabad
299 Chapter 8 Project Benefits
300 NATCO Pharma Ltd.-Chemical Division -Chennai-EIA Report Chapter 8:Project Benefits Chapter 8 Project Benefits 8.1 Introduction The proposed expansion of Active Pharmaceutical Ingredients (APIs) & its Intermediates manufacturing unit will result in improvement of infrastructure as well as overall socio-economic development in the area. M/s NATCO Pharma limited, Chemical Division is a responsible care organization, which is focused on overall development of employee, various stakeholders and the society within which the company operates. In addition, the company s commitment towards sustainable development and inclusive growth encompasses; maintenance of the ecological balance and providing a safe environment to keep employees and community healthy and safe. The people residing in the nearby and surrounding areas will be benefited directly and or indirectly due to the proposed expansion project. It is anticipated that the proposed project will provide benefit for the locals in two phases i.e. during construction phase as well as during operation phase of the unit. In operation phase, the proposed expansion plant would require significant workforce of technical and non-technical persons. Migration of persons with better education and professional experience will result in increase of population and literacy in the surrounding villages Construction Phase During construction phase, the proposed expansion project will benefit the region in following manner: Employment generation The proposed expansion project will generate employment opportunities to the local population during construction phase. The total manpower requirement during construction 8.1 KKB Envirocare Consultants Pvt. Ltd., Hyderabad
301 NATCO Pharma Ltd.-Chemical Division -Chennai-EIA Report Chapter 8:Project Benefits is about 100 people. This will last for approximately twenty four months. Unskilled/semiskilled labour for the plant would be drawn locally or from nearby places. The employment of local personnel in skilled and executive staff category would depend on availability and suitability of individuals. In addition to the direct employment in the construction of unit, an indirect employment will generate in truck transport operation, workshops, other ancillary units, markets/shops etc Community service NATCO Pharma- Chemical Division will provide necessary facilities like water supply, sewerage and medical facility etc. for catering to the needs of the project personnel during the construction phase Transportation During construction of unit, movement of material of great magnitude, other construction material and construction machinery would involve. The materials to be transported include concrete, steel and other materials. Transport of construction materials to the project site will result in increased traffic in the area, the existing road network will support the increased load Demography and Socio-economics As the labours / workmen are generally un-skilled, the locals would get opportunities for employment during construction activities. In addition to the opportunity of getting employment as construction workers, the local population would also have employment opportunities in related service activities like petty commercial establishments, small contracts/sub-contracts and supply of construction materials for buildings and ancillary infrastructures etc. Consequently, this may lead to economic up-liftment of the area. 8.2 Operational Phase Employment The total manpower requirement during operation phase (including existing) is estimated to be 350 direct and 100 indirect people including contract labour required for auxiliary services like loading, unloading of stores and miscellaneous materials and general cleaning work and security. Unskilled/semi-skilled labour for the plant would be drawn locally or from nearby places. 8.2 KKB Envirocare Consultants Pvt. Ltd., Hyderabad
302 NATCO Pharma Ltd.-Chemical Division -Chennai-EIA Report Chapter 8:Project Benefits Sl. No Other Benefits As part of the Enterprises Social Commitment (ESC), NATCO Pharma proposes to take steps in the following: Drinking water Facility (RO) to the nearby villages LED lights & solar Panel to nearby schools Computers/Smart class rooms to nearby schools Providing nutritional Needs to Pregnant Ladies in villages Providing common Toilet & sanitation facility, Solar street lights, bus shelters to nearby villages Conducting Periodical Medical Health camp & fulfilling needs of nearby Government hospitals in the villages Prediction of Impacts on Socio-Economic This project will create many job opportunities for the local people. The employment of people will be both on permanent as well as on contract basis. The employment will be categorized into different categories as skilled laborers, semi-skilled and unskilled workers. This plant will also have job offers for managers, supervisors, engineers, technicians, operators, helpers etc. 8.3 Enterprises Social Commitment (ESC) Activities The project proponent will carry out the following welfare measures to residents of nearby villages. The ESC activities proposed by the proponent during next 5 years along with year wise budgetary allocation for each ESC activity are presented in Table 8.1. Table 8.1: Budgetary allocation for the ESC activities Year wise budget allocation Activity KKB Envirocare Consultants Pvt. Ltd., Hyderabad Rs. in lakhs 1. Drinking water Facility (RO) to the nearby villages LED lights & solar Panel to nearby schools Computers/Smart class rooms to nearby schools Providing nutritional Needs to Pregnant Ladies in villages Providing common Toilet & sanitation facility, Solar street lights, bus shelters to nearby villages Conducting Periodical Medical Health camp & fulfilling needs of nearby Government hospitals in the villages Total
303 NATCO Pharma Ltd.-Chemical Division -Chennai-EIA Report Chapter 8:Project Benefits Beneficiary nearby Villages Manali New Town/ Dwaraganagar 0.5km (NE) side Edayan chavadi / Elandacheri 1.3km (NE) Chennasekkadu/Polavaram 1.5km (S) Andarkuppam/ kanniyamman petti 0.8km (W) Ariyaloor 1.5km (W) Elandanur 1.6km (NE) Ammanthangal 3.6 KM (NW) Saleema nagar 0.2km (N) Kosapur KM 1.5 KM (NE) Sirugavur 5.6 KM (WNW) The enterprise social commitment (ESC) activities will be taken up to fulfill the basic requirement of the people in the identified villages, the development activities further needs to be taken up. The basic requirement of the community needs will be strengthened in the area. The preference will be given to the local population for direct and in-direct employment. The proposed project may create opportunities for direct and indirect employment which will help in improving the socio economic status of the region. 8.4 Conclusion The NATCO Pharma Ltd., Chemical Division plant has generated a fair amount of direct, indirect and induced employment in the study region. The local economy has received a boost due to employee spending and services generated by NATCO Pharma Ltd. The overall effect has improved buying power of employees and thus a standard of living. This is envisaged as a major positive benefit. Migration into the existing area or displacement of existing population is insignificant. Housing, transport, water, power supply, medical, educational and other civic amenities are not adversely affected nor appear to get affected in future. On the other hand, there is an employment opportunity for the local people due to the presence of NATCO Pharma Ltd. in this area. 8.4 KKB Envirocare Consultants Pvt. Ltd., Hyderabad
304 Chapter 9 Summary
305 NATCO Pharma Ltd., Chemical Division- Chennai-EIA report Chapter 9: Summary Chapter 9 Summary Summary of the EIA report and Executive summary is same. Hence Summary of EIA report is provided in beginning of the EIA report as Executive Summary prior to Chapter 1. Page no. ES 1 to ES KKB Envirocare Consultants Pvt. Ltd., Hyderabad
306 Chapter 10 Disclosure of Consultant
307 NATCO Pharma Ltd.-Chemical Division- Chennai-EIA Report Chapter 10: Disclosure of Consultant Chapter 10 Disclosure of Consultant 10.1 Introduction The Environmental Impact Assessment (EIA) including Environmental Management Plan (EMP) report has been prepared by carrying out various scientific studies. Studies have been carried out by engaging experts of M/s KKB Envirocare Consultants Pvt. Ltd., Hyderabad and its associates. Sl. No. Study Consultants 1. Environmental Impact Assessment KKB Envirocare Consultants Pvt. Ltd., Hyderabad study including Environmental (NABET ACCREDITED) Management Plan 2. Baseline Environmental Studies KKB Micro Testing Labs Pvt. Ltd., Hyderabad (NABL Accredited Laboratory) KKB Envirocare Consultants has been accredited by NABET for Sector 21, Category A as per the NABET Accreditation Certificate mentioned below KKB Envirocare Consultants Pvt. Ltd., Hyderabad

308 NATCO Pharma Ltd.-Chemical Division- Chennai-EIA Report Chapter 10: Disclosure of Consultant 10.2 NABET Accreditation 10.2 KKB Envirocare Consultants Pvt. Ltd., Hyderabad

309 NATCO Pharma Ltd.-Chemical Division- Chennai-EIA Report Chapter 10: Disclosure of Consultant 10.3 Declaration of Experts 10.3 KKB Envirocare Consultants Pvt. Ltd., Hyderabad

310 NATCO Pharma Ltd.-Chemical Division- Chennai-EIA Report Chapter 10: Disclosure of Consultant 10.4 KKB Envirocare Consultants Pvt. Ltd., Hyderabad

311 NATCO Pharma Ltd.-Chemical Division- Chennai-EIA Report Chapter 10: Disclosure of Consultant 10.5 KKB Envirocare Consultants Pvt. Ltd., Hyderabad