Optimisation of the WWTP performance and design using computer simulation
|
|
|
- Douglas Flowers
- 5 years ago
- Views:
Transcription
")

1 Optimisation of the WWTP performance and design using computer simulation Jacek Mąkinia, Ewa Zaborowska Gdańsk University of Technology (Poland) Department of Sanitary Engineering IWAMA 6th International Capacity Development Workshop on Constructional and Operational Challanges Gdańsk, September 2018
. Optimisation of the Hamburg wastewater treatment plants by dynamic simulation. Wat. Sci. Tech., 39 (4), 37-44. Ladiges, Bertram and Otterpohl (2000).")
2 Maybe the best example of plant optimization Hamburg WWTPs Preliminary cost of upgrade (ATV-131) 100 mln Euro Preliminary cost of upgrade (simulation studies) 1 mln Euro!!! Cost of simulation studies 0.15 mln Euro Ladiges, Gunner and Otterpohl (1999). Optimisation of the Hamburg wastewater treatment plants by dynamic simulation. Wat. Sci. Tech., 39 (4), Ladiges, Bertram and Otterpohl (2000). Concept development for the optimisation of the Hamburg Wastewater Treatment Plants. Wat. Sci. Tech., 41 (9),
 Design of new facilities Mathematical modeling and computer simulation in wastewater treatment Legal regulation (evaluating the impact of new effluent standards) Process control")
3 Traditional applications of mathematical modeling and computer simulation Operation of existing facilities (diagnosis and optimization) Research (development of new treatment concepts, process understanding) Design of new facilities Mathematical modeling and computer simulation in wastewater treatment Legal regulation (evaluating the impact of new effluent standards) Process control (testing new control systems) Education (teaching and staff training)
 Optimisation Design Prediction Training Total Universities and public research centers Governmental")
4 ASM users, % Results of a survey on model applications (Hauduc et al., 2009) Optimisation Design Prediction Training Total Universities and public research centers Governmental organisations Private companies Europe North America
5 No. of publications (1) No. of publications (2) Number of publications on activated sludge modeling referenced in the SCOPUS database (1) "activated sludge AND model" (2) "activated sludge AND model and full-scale" ASM Year
")


 www.wrcplc.co.")
 and")
 www.")
6 Program Company Contact GPS-X Hydromantis (Canada) BioWin Envirosim Associates Ltd. (Canada) STOAT Water Research Centre (UK) SIMBA Popular simulation programs IFAK (Germany) and InCTRL (Canada) simba.ifak.eu WEST DHI (Denmark) SUMO Dynamita (France)
 Savings in financial expenditures DISADVANTAGES It is neither cheap nor easy to apply Simulation gives only approximate results Results can be no better than the model")
7 Advantages and disadvantages of computer simulation ADVANTAGES No disruptions to existing systems Testing a concept prior to installation Detection of unforeseen problems Much greater speed in analysis ( time compression ) Savings in financial expenditures DISADVANTAGES It is neither cheap nor easy to apply Simulation gives only approximate results Results can be no better than the model (and data), Much cleaner job than physical experimenting (validation required!)


8 Main steps in model calibration/validation Full-scale bioreactor STEP 1: Steady-state and phase dynamic simulation of the full-scale AS system STEP 3: Dynamic simulation of the batch tests during other study periods STEP 2: Dynamic simulation of the batch tests during the summer study period STEP 4: Dynamic simulation of the full-scale AS system Batch reactor
 (P removal and denitrification) Three-phase experiments (P removal, nitrification and")
9 Laboratory batch experiments One-phase experiments (nitrification, denitrification) Two-phase experiments (P removal and nitrification) (P removal and denitrification) Three-phase experiments (P removal, nitrification and denitrification)
10 Operating cost model components in GPS-X Aeration energy (blower compression efficiency, headloss, etc., and the factors included in the oxygen transfer model) Pumping energy (water/air flow rate, hydraulic head, density of water/air) Sludge handling (disposal price and rate) Miscellaneous energy (operation of gates, arms, rakes, mixers, moving bridges, etc.) Chemical addition (chemical price and dosage rate)


11 Operating cost model - example Pumping
12 Example 1 SŁUPSK WWTP CASE STUDY OPTIMIZATION OF OPERATIONAL STRATEGIES


13 Characteristics of the Słupsk WWTP Loading and hydraulic capacity Parameter Unit Design Actual Size PE Flowrate m 3 /d SŁUPSK. Baltic Sea Annual average concentrations Parameter Unit Influent Effluent Limit COD mg O 2 /L Total N mg N/L Total P mg P/L Baltic Sea Poland
14 Flow diagram and computer model of the activated sludge system in the Słupsk WWTP BIOREACTOR - 3 TRAINS INFLUENT PRIMARY CLARIFIER 1xO34, h=2,5m 908 m 2 ANAEROBIC ANOXIC 2x720 m 2x1470 m ANOXIC/ AEROBIC 520 m SECONDARY EFFLUENT AEROBIC CLARIFIER 2xO40, h=2,8m 2xO40, h=3,5m m 2 4x1256 m m RETURNED ACTIVATED SLUDGE RAW SLUDGE WASTE ACTIVATED SLUDGE


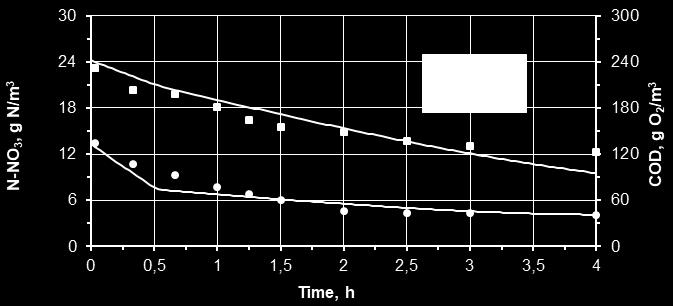

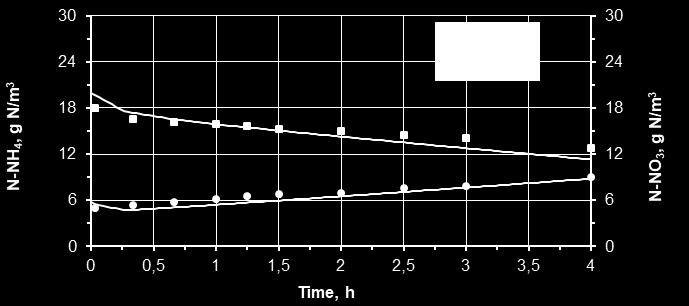
15 Model calibration in lab-scale Nitrification Denitrification P removal / nitrification P removal / denitrification
16 Model in full-scale - 4-day measurement campaign (a) Flow rate, 10 3 m 3 /d Q inf and T 20,0 (b) 20 Flow rate Temperature 19,5 16 NO 3 -N 12 19,0 8 18,5 4 Temperature, o C NO3-N, g N/m Time, h 18, Time, h (c) 20 PO4-P, g P/m PO4-P, anoxic zone PO4-P, aerobic zone (d) 20 PO 4 -P NH 4 -N NH4-N, g N/m NH4-N, anoxic zone NH4-N, aerobic zone Time, h Time, h Zaborowska et al. (2016)
17 N removal in sidestream Scenarios for improving N removal (1) NO 3 -N = 4.7 g N/m 3 NH 4 -N = 0.07 g N/m 3 Additional treatment line NO 3 -N = 5.6 g N/m 3 NH 4 -N = 0.07 g N/m 3
18 Scenarios for improving N removal (2) Increasing MLR NO 3 -N = 5.8 g N/m 3 NH 4 -N = 0.07 g N/m 3

19 The idea of improving energy balance and reduction GHG emission
20 Strategies for improving energy balance and reduction GHG emission Sidestream deammonification (partial nitritation/ anammox) Chemically enhanced primary treatment (CEPT) Energy savings for aeration Increased biogas production Reduction in the total WWTP energy consumption Increased share of renewable energy Positive impact on energy and environment
21 Plant-wide layout CHEMICAL PRECIPITATION (UPGRADE) BIOREACTOR - 3 TRAINS MLR INFLUENT m /d 6.2 MGD PE= TSS=450 mg/l COD=1130 mg/l TN=82 mgn/l TP=12 mgp/l PRIMARY CLARIFIER RAW SLUDGE ANAEROBIC ANOXIC 4.8 Mg/d 6.3 Mg/d ANOXIC/ AEROBIC AEROBIC DO RETURNED ACTIVATED SLUDGE WASTE ACTIVATED SLUDGE SECONDARY CLARIFIER EFFLUENT SIDESTREAM TREATMENT DEAMMONIFICATION (UPGRADE) ANAEROBIC DIGESTER C BIOGAS CHP PLANTS ENERGY 260kWe / 360kWt m /d 8185 kwh/d 2 x 341kWe / 480kWt 60-65% CH 4 SLUDGE LIQUOR DIGESTED SLUDGE
22 Plant-wide model of the Słupsk WWTP in GPS-X PLANT-WIDE MODEL INFLUENT PRIMARY CLARIFIER EXTERNAL CARBON ANAEROBIC ZONE ANAEROBIC ZONE ANOXIC ZONE REJECT WATER TREATMENT MLR ASM2d BIOLOGICAL REACTOR MODEL ANOXIC ZONE AEROBIC ZONE ANOXIC/AEROBIC ZONE DO SECONDARY CLARIFIER EFFLUENT GRAVITY THICKENER ANAEROBIC DIGESTER CENTRIFUGES BIOSOLIDS MatntisAD CENTRIFUGES Zaborowska et al. (2017)
23 Measurements vs. model predictions. Model validation. Energy for aeration R 2 = 0.70 measured predicted N 2 O emission measured predicted
24 Model predictions under the energy neutrality conditions for the proposed upgrades TSS removal efficiency from raw WW the reference state Ref 10 mgn/l energy neutrality level TN removal efficiency from reject water acceptable results in % excess energy energy neutral point Energy recovery from biogas was found the most influential factor affecting the energy balance

25 Model predictions of the cost balance for the proposed upgrades TSS removal efficiency from raw WW Ref. in $/d 10 mgn/l acceptable results acceptable results TN removal efficiency from reject water positive cost balance The price of the coagulant/flocculent was found the main factor determining a positive cost balance

26 Model predictions of the energy consumption for the proposed operational strategies in kwh Ref. the reference state the optimal state Opt. The energy balance affected mainly by aeration

27 Example 2 CASE STUDY. STAROGARD GD. WWTP OPTIMIZATION OF UPGRADES IN THE SLUDGE LINE

28 Characteristics of the Starogard WWTP Loading and hydraulic capacity Parameter Unit Design Actual Size PE Flowrate m 3 /d Annual average concentrations Parameter Unit Influent Effluent Limit COD mg O 2 /L Total N mg N/L Total P mg P/L
29 Plant layout the actual state BIOREACTOR (A2O) INTERNAL CIRCULATION - MLR ( %) INFLUENT (100%) SCREEN GRIT AN A/DN A/DN DN DN DN N SECONDARY CLARIFIER 2 x O36 m/h=3,6-4,6 m EFFLUENT 392 m m m m 392 m m m RETURNED ACTIVATED SLUDGE (~100%) REJECT WATER WASTE ACTIVATED SLUDGE WAS TANK OPEN DIGESTION CHAMBER DEWATERED SLUDGE (AGRICULTURAL USE) DEWATERING (15% TSS) 570 m m

30 Plant-wide model in GPS-X the actual state INFLUENT GRIT CHAMBER EFFLUENT AN A/DN N A/DN DN SECONDARY CLARIFIER DEWATERING WAS TANK OPEN DIGESTER
31 Model calibration in lab-scale Nitrification Denitrification P removal / nitrification P removal / denitrification The calibration facilitated by the experiences from other Pomeranian WWTPs (comparable set of the kinetic parameters, except for the ones related to AOB growth)

32 Plant-wide model in GPS-X with the upgrades in the sludge line
 + SIDESTREAM DEAMMO- NIFICATION + SIDESTREAM NITRIFICATION-")
33 Model predictions. Cost balance: sedimentation vs. CEPT PRIMARY CLARIFIER + AD + EXTERNAL CARBON (FUZZLE OIL) + SIDESTREAM DEAMMO- NIFICATION + SIDESTREAM NITRIFICATION- DENITRIFICATION + STRUVITE RECOVERY The operational cost balance includes energy and chemicals
 + SIDESTREAM DEAMMO- NIFICATION + SIDESTREAM NITRIFICATION-")
34 Model predictions. Cost balance: co-digestion vs. digestion PRIMARY CLARIFIER + AD + EXTERNAL CARBON (FUZZLE OIL) + SIDESTREAM DEAMMO- NIFICATION + SIDESTREAM NITRIFICATION- DENITRIFICATION + STRUVITE RECOVERY The operational cost balance includes energy and chemicals
35 Conclusions I Computer simulation is a useful tool for optimization WWTP performance and design (but requires significant efforts and skills) I The example of a large WWTP (the Słupsk case) showed possible shift from the energy deficit to the energy neutrality and a positive cost balance by applying the CEPT and sidestream deammonification I Regarding the actual operational conditions, the potential reduction was estimated as high as 19% for the energy demand and 32% for the C-footprint by controlling aeration in the aerobic zone and the mixed liquor recirculation
 sedimentation, co-digestion with external substrates, sidestream")
36 Conclusions I In the medium-size upgraded WWTP (the Starogard case), the potential energy recovery was estimated up to 75%, while maintaining the discharge limits, improving the operational cost balance and decreasing the total C-footprint I The recommended option comprised a new primary clarifier with gravitational (natural) sedimentation, co-digestion with external substrates, sidestream deammonification as well as agricultural sludge disposal


37 Acknowledgements Model of sludge management in a wastewater treatment plant focused on increasing the production of renewable energy and nutrients recovery The project is financially supported by Regional Fund for Environmental Protection and Water Management in Gdansk/Poland in the "Pomeranian R&D projects" competition (2017 edition), grant no WFOS/D/201/3/2018.

38 THANK YOU FOR YOUR ATTENTION!

39 Questions??? Contact: Jacek Mąkinia