Assessment and Modelling of Baltic Ecosystem Response (AMBER)
|
|
|
- Ginger Weaver
- 5 years ago
- Views:
Transcription
1 Assessment and Modelling of Baltic Ecosystem Response (AMBER) Joachim W Dippner and the AMBER team AMBER Kick-off meeting
2 Participants Leibniz-Institute for Baltic Sea Research Warnemünde, D (Coordination) Leibniz-Institute for Freshwater Ecology and Inland Fisheries, Berlin, D Institute for Hydrobiology and Fisheries Research, University Hamburg, D Swedish Meteorological and Hydrological Institute, Norrköping, S Department of Applied Environmental Science, University Stockholm, S Department of Biological and Environmental Sciences, University Helsinki, FI Archipelago Research Institute, University Turku, FI Coastal Research and Planning Institute, University Kleipeda, LIT Institute of Oceanography PAS, Sopot, PL
3 AMBER - GOALS Implementation and application of the Ecosystem Approach to Management (EAM) to the Baltic Sea in the face of eutrophication and climate change Focus is the coastal ecosystem in a holistic view Separation of climate from anthropogenic signals Combination of different climate change scenarios with land use/life style change scenarios Science based advise for integrated management Risk assessment Mitigation strategies Ecological Quality Objective Improvement of monitoring strategies Fisheries management
4 Methods Retrospective analysis of long-term data sets Measurements of biogeochemical transformation processes in the coastal waters Measurements of fluxes into the coastal area from cold seepages Climate modelling Ecosystem modelling Catchment modelling Combination of climate and catchment models Implementation and application of EAM


5 The near coastal area Climate Change Change in land use Internal transformation River runoff Open Baltic Sea groundwater
6 Research Clusters A) Time series analyses Climate change Open Baltic Sea B) Process studies and observations Internal transformation River runoff Groundwater discharge C) Spatial river basin coast sea interaction Change in land use River runoff Combined modelling D) Policy and advisory Implementation of EAM Application of EAM
7 Research Cluster A Updated data collection Retrospective data analyses Analysis of potential predictability (POP) Prediction of future changes (statistical downscaling) Analysis of future development of Baltic ecosystem (AMOEBA) Analysis of optimal environmental window (Cury & Roy Model)
8 Research Cluster A (Example) Background is the documented increase of rain fall for the last 40 years. Modelling Baltic Sea runoff from 1970 to 2000 in order to separate years with low and high runoff Modelling relations between low and high runoff and its consequences on nutrients and biota. We should be able to point out a chain of events from Baltic climate conditions to species level in biota and more general changes e.g. eutrophication
9 Research Cluster B Estimate of N-removal in contrasting estuarine systems DOM input and transformation in Baltic estuaries (bioavailability of DON for food web) Isotopic signature in nitrate for source identification Identification and quantification of submarine groundwater discharge Geochemical composition of groundwater seepage Groundwater seepage impact on biota
10 Isotope signals of Nitrate in Baltic Sea rivers is related to land use Voss et al. 2006
11 How much of the nitrogen loading do natural processes remove before river waters enter the sea? Average denitrification 420 µmol N m -2 d -1 (= 2 g N m -2 a -1 ) NOx removal 4.5% Ntot removal 19% N km 0 Paimionlahti Bay Aug-Sep-03 of loading in August- September 2003 Silvennoinen et al. 2007

12 Submarine Groundwater Discharge
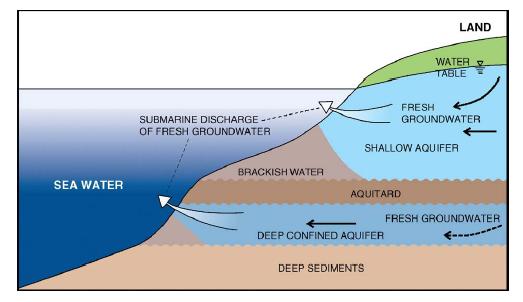
13 Subterranian Estuary

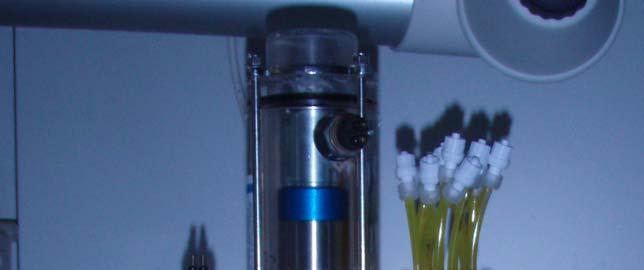
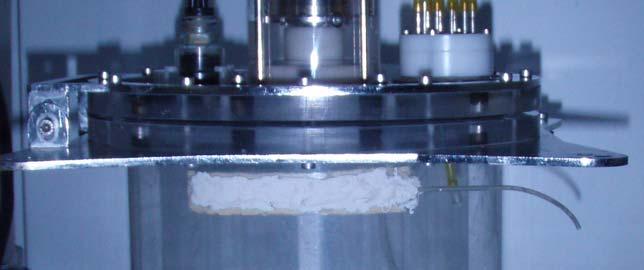
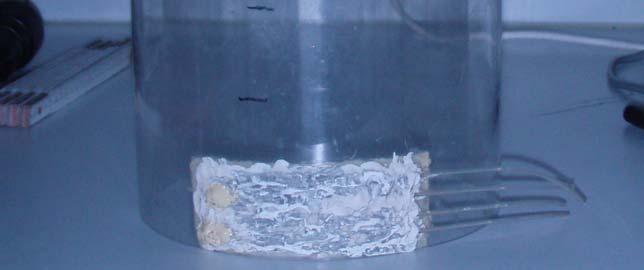
14 Fotos: Dellwig Seepagemeter


15 Research area Gulf of Gdansk PUCK BAY
")
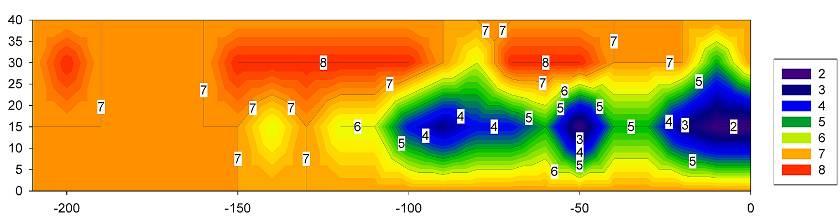
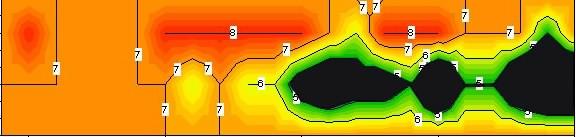
16 distance (m) salinity distance (m)
17 Ground Water Release ~ l/d per seepage (10 l/m 2 d) 200 μmol/l silicate 150 μmol/l ammonium (7.7 g N/m 2 a) 40 μmol/l phosphate
18 Research Cluster C Spatial data of Baltic river basins Future scenarios considering climate change and change in land use Detailed river basin senario studies River basin induced functional changes in lagoon waters Functional changes between coastal waters and the sea Biogeochemical fluxes between coastal regions and the open sea.
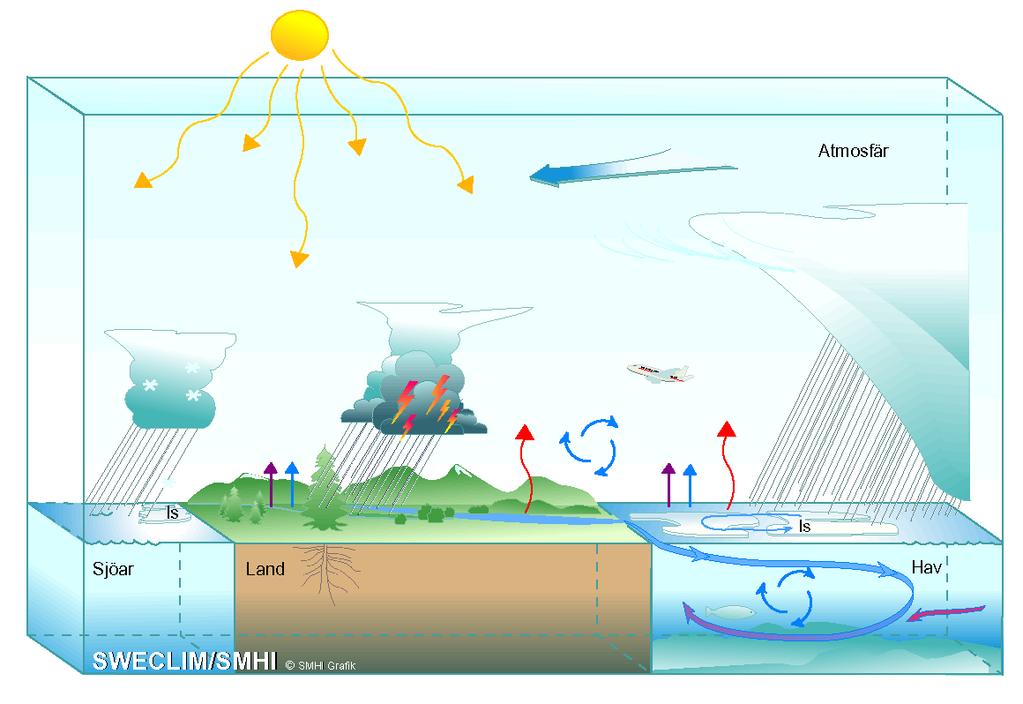
19 Atmosphere-ice-ocean-land surface model system
20 RCO-SCOBI High-resolution 3-D coupled physical-biogeochemical model for climate and process studies Nitrogen fixation From upper layer From upper layer Pelagic variables: Sediment department N 2 Denitrification Nitrification O 2 H 2 S Denitrification Nitrification Ammonium adsorption NO 3 NH 4 PO 4 Decomposition Assimilation Assimilation Assimilation Decomposition Burial NBT PBT A1 A2 A3 Sedimentation To lower layer Grazing Mortality Predation Resuspension DET Excretion Faeces Sedimentation To lower layer ZOO Grazing nitrate ammonium phosphate autotrophs (NO3) (NH4) (PO4) (A1,A2,A3) (diatoms, flagellates, cyanobacteria) zooplankton (ZOO) detritus (DET) oxygen (O2) Hydrogen sulfide (H2S) is included as negative oxygen The sediment contains nutrients in the form of benthic nitrogen (NBT) and phosphorus (PBT). Aggregated process descriptions for oxygen dependent nutrient regeneration, denitrification and adsorption of ammonium to sediment particles as well as re-suspension and permanent burial of organic matter. Meier et al. 2006

21 Schernewski et al Modelling nutrient fluxes in the river basin: The model MONERIS (with MODEST & NIIRS)


22 The Oder/Odra River Basin Total emissions: Nitrogen Behrendt et al. (2005)
23 Research Cluster D Indicator system for ecosystem-based fisheries management Assessment of the effect of productivity changes in coastal areas on open-sea fish stocks Evaluation and modification of EQO Assessment of climate change impact on EQO Management implication for river basin-coast-sea system Synthesis and assessment of changes in coastal areas Improvement of monitoring strategies Risk assessment on relative contribution of land use changes vs climate change on nutrient inputs to the Baltic Sea Cost-benefit analysis Web-based information site for scientific administrative and public use
24 Research Cluster D Indicator system for ecosystem-based fisheries management Assessment of the effect of productivity changes in coastal areas on open-sea fish stocks Evaluation and modification of EQO Assessment of climate change impact on EQO Management implication for river basin-coast-sea system Synthesis and assessment of changes in coastal areas Improvement of monitoring strategies Risk assessment on relative contribution of land use changes vs climate change on nutrient inputs to the Baltic Sea Cost-benefit analysis Web-based information site for scientific administrative and public use Skipped due to budget reduction

25 AMBER Flow Chart
26 Education Programme Workshops Non-linear time series analyses Stable isotopes as bio-indicators Climate modelling Lagoon management using ECOPATH Integrated caostal zone management Summer school Developing ecosystem-based management strategies Skipped due to budget reduction

27 Thank you for your attention!