6.3 Appraisal of Biomass CHP Technology
|
|
|
- Hilary Montgomery
- 5 years ago
- Views:
Transcription
1 6.3 Appraisal of Biomass CHP Technology Key Themes Comments ENVIRONMENT Carbon reduction and Energy Generation potential Biomass CHP utilises renewable wood chips/pellets as a fuel source (or potentially biofuel) to generate heat and power; and therefore reduces carbon emissions further when against traditional gas boiler and gas CHP technologies. However, this technology is only feasible when sufficient sustainable wood chip/pellet fuel is available. Provided that sufficient biomass fuel is available then this technology can be sized to meet the energy requirements of the development; as follows (based on 2.82MWe system): Electricity Generation = 21,109,582 kwh Heat Production = 44,330,122 kwh The net savings after grid displacement of electricity would be 19,922 tonnes. The below summaries the percentage of energy generated and carbon savings achieved relative to regulated and unregulated energy: Regulated & Unregulated % energy demand met 87% 124% % carbon savings 77% 143% Regulated only Spatial and Landscape No significant landscape issues associated with this option as the biomass plants are enclosed within a building structure; with the exception of the biomass fuel storage which may be a silo type structure; which is in keeping with the existing rural nature of the site and is not considered to represent a landscape impact. It is likely that at least 2 energy centres would be required; sized approximately 25m x15m with additional service yards. It is not considered that these would represent a negative spatial or landscape impact as they would be fully integrated into the masterplan layout and design. However, each would have exhaust flues extending some 15m from the CHP plant; which would have limited local landscape impact. Biodiversity Environmental Quality There are no significant biodiversity concerns with this technology at the site. Potential air quality can occurs due to the burning of wood fuel, which have a higher nitrogen oxide content than traditional gas boilers; however this would be controlled as part of the plant and flue arrangements and so unlike to cause any actual impact. Noise will be generated by the CHP engines; however, this would be mitigated by acoustic enclosures to acceptable levels. SOCIAL Governance Equity Health / Wellbeing This is district scale technology that requires a site wide DHN to facilitate the transfer of hot water to each building. This type of technology could be linked to local governance structure, if deemed appropriate, and facilitate the community buy-in. This technology has the potential to help reduce the heating bills, depending on the pricing strategy adopted and biomass fuel supply; as low cost waste heat could be used to meet the sites thermal demand. In addition; it is likely that the Biomass fuel would be purchased locally which would benefit local economy. No significant health and wellbeing issues. ECOMONIC Hyder Consulting (UK) Limited Page 28
2 Typical Cost Typical Payback Incentives/Grants Phasing Land Values As a comparable cost, this technology equates to / kwh (based on 25 year life time cost). This is based upon meeting complete thermal demands and approximately 68% of electricity demands. This cost includes, the fuel tariff cost at the rate of 125/tonne of biomass, a provisional sum relative to provision of district heat network across the development site, maintenance and capital cost. The above cost includes 4% RPI average per year for maintenance and fuel cost and 5% interest rate for the capital cost. Typical Payback Years Grants & Funding Current available grants/ funding are as follows: RHI= 2.6pence/kWh, ROC =0.5/MWH This technology would need to be implemented at the start of build out; if it were to be a main contribution to the thermal demand; necessitating installation and connection to a site wide DHN. Therefore this technology is not usually associated with small phases but can be implemented in development batches; incorporating at least a few hundred homes. It is considered that this technology would not have any significant impact on land values. TECHNICAL Connecting Infrastructure Physical factors Integration with other technologies This option requires a site wide heat network to distribute the hot water across the site to each building. In addition; it would require grid connection relative to electricity generated. The major technical constraint is the availability of biomass fuel and fuel security for long term generation. According to Nation al Biofuel Supply database there are few biomass logs, chip and palettes suppliers are available within the close proximity of the site (more information is presented in Appendix D). To generate the energy as mentioned under Carbon and Energy section approximately 20,693 tonnes of biomass fuel would be required. This technology can integrate with other CHP technologies as part of site wide network; if all units are designed to facilitate this. It will also integrate with other power generating technologies such as wind and solar PV. It would not integrate well with micro heat technologies such as solar thermal; unless specific areas of the site were not to be connected to the DHN. SUMMARY Biomass CHP could meet the overall heating demands and a considerable proportion of the electrical demand of the development; however, consistent and availability biomass fuel would be required to facilitate this. This option would also create significant carbon savings. Hyder Consulting (UK) Limited Page 29
3 6.4 Appraisal of Gas CHP Key Themes Comments ENVIRONMENT Carbon reduction and Energy Generation potential Gas CHP design would be optimised to meet the space heating and hot water demands of development. A 2.79MWe gas CHP unit would be able to meet the space heating/ hot water requirements for the whole site (or smaller units equalling this total); generating: Total Electricity Generation = 20,428,627 kwh Total Heat Production = 44,330,122 kwh The net carbon savings after grid displacement of electricity would be 12,045 tonnes. The below summaries the percentage of energy generated and carbon savings achieved relative to regulated and unregulated energy: Regulated & Unregulated % energy demand met 86% 123% % carbon savings 47% 86% Regulated only Spatial and Landscape No significant landscape issues associated with this option as the gas CHP plants are enclosed within a building structure. It is likely that at least 2 energy centres would be required; sized approximately 25m x15m with additional service yards. It is not considered that these would represent a negative spatial or landscape impact as they would be fully integrated into the masterplan layout and design. However, each would have exhaust flues extending some 15m from the roof of the CHP plant; which would have limited local landscape. Biodiversity Environmental quality There are no biodiversity issues linked to this technology. Noise will be generated by the CHP engines; however, this would be mitigated by acoustic enclosures to acceptable levels. SOCIAL Governance Equity Health / Wellbeing This is district scale technology that requires a site wide DHN to facilitate the transfer of hot water to each building. This type of technology could be linked to local governance structure, if deemed appropriate, and facilitate community buy-in. This technology has the potential to help reduce the heating bills, depending on the pricing strategy adopted and biomass fuel supply; as low cost waste heat could be used to meet the sites thermal demand. There are no negative health and wellbeing concerns of this technology. ECOMONIC Typical Cost Typical Payback Incentive/Grants As a comparable cost, this technology equates to / kwh (based on 25 year life time cost). This is based upon meeting complete thermal demands and approximately 66% of electricity demands. This cost includes the capital, maintenance and fuel cost to generate the energy from this option and also the distribution network cost from the energy centre across the development site. The above cost includes the 4% RPI average per year for maintenance and fuel cost and 5% interest rate for the capital cost Typical Payback Years There are no FIT s and RHI available for this option, however some export tariff and Climate Change Levy tax relaxations are available for this option Hyder Consulting (UK) Limited Page 30
4 Phasing Land Values This technology would need to be implemented at the start of build out; if it were to be a main contribution to the thermal demand; necessitating installation and connection to a site wide DHN. Therefore this technology is not usually associated with small phases but can be implemented in development batches; incorporating at least a few hundred homes. It is considered that this technology would not have any significant impact on land values. TECHNICAL Connecting Infrastructure Physical factors Integration with other technologies This option requires a site wide heat network to distribute the hot water across the site to each building. In addition; it would require grid connection relative to electricity generated. There are no specific physical limitations to this option. However, this technology will be dominated by the global supply of natural gas and fossil fuel prices. This technology can integrate with other CHP technologies as part of site wide network; if all units are designed to facilitate this. It will also integrate with other power generating technologies such as wind and solar PV. It would not integrate well with micro heat technologies such as solar thermal; unless specific areas of the site were not to be connected to the DHN. SUMMARY Gas CHP, if correctly sized, is capable of producing enough heat to meet the thermal demands of site; and a significant portion of the electrical demand. However, as with the other district heating technology, this will incur extensive site wide DHN to ensure each building is connected. However; this technology is completely dependent upon natural gas as a generation fuel and therefore does not provide the same level of carbon savings as some renewable alternatives. Hyder Consulting (UK) Limited Page 31
5 6.5 Appraisal of Solar PV (Roof mounted) Key Themes Comments ENVIRONMENT Carbon reduction and Energy Generation potential Roof mounted solar PV would be limited to south facing roofs. For this appraisal; it has been assumed that 50% of roofs will be orientated southwards; and available for PV generation. The following demonstrate the generation capacity: Total Electricity Generation from available Residential roof space = 14,856,351 kwh The above meets the full regulated electricity demands of the residential development and some of the unregulated demands. In total approximately 72% of the overall residential electricity demand can be met through this option; with a total carbon savings of 7,710 tonnes Total Electricity Generation from available Commercial roof space = 3,618,122 kwh The above meets approximately 35% of the commercial electricity demand of the site; with a carbon saving of 1,877 tonnes The below summaries the percentage of energy generated and carbon savings achieved relative to regulated and unregulated energy: Regulated & Unregulated % energy demand met 25% 35% % carbon savings 37% 69% Regulated only Spatial and Landscape This technology is unlikely to have any impact to landscape character or view. It may however create a distinctive streetscape and design concept relative to the development. Biodiversity Environmental quality There are no biodiversity impacts associated with solar PV option. There are no negative issues with regards to air quality, land quality, noise and water quality as this option. SOCIAL Governance As this technology is installed on each building; it can largely be owned by the home owners / occupiers of the development. Equity Health / Wellbeing Solar PV creates an immediate and direct benefit to the home owners and occupiers of buildings; reducing electricity bills. There are no negative health and wellbeing concerns of this technology ECOMONIC Typical Cost Solar PV is one of the more expensive renewable technologies, but one which has been subject to significant downward price shifting due to relatively rapid take up and technology improvements. For this appraisal the guided solar PV installation cost has been assumed to be 2500/kWp (incl. installation). As downward pricing continues the economics of this option will improve. As a comparable cost, this technology equates to / kwh (based on 25 year life time cost). The above cost contributes towards meeting approximately 59% of total regulated and unregulated electricity demands of the site. This cost includes the capital and maintenance of this option. The above cost includes the 4% RPI average per year for maintenance and fuel cost and 5% interest rate for the capital cost. The above costs do not include any reinforcement works required to the national grid to enable grid connection. Hyder Consulting (UK) Limited Page 32
6 Typical Payback Incentives/Grants Phasing Land Values The typical Payback is approximately 10 Years but reducing Grants & Funding Current available grants/ funding are as follows: FIT= 6.85pence/kWh ROC = 2/MWH Export Tariff = 4.64 pence/kwh Phasing is easily achievable with roof mounted solar PV; as panels are fitted as each building (or group of buildings) near completion. Therefore operation and cash flow can be phased alongside build out. There are not considered to be any land value issues associated with this technology. TECHNICAL Connecting Infrastructure Physical factors Integration with other technologies Due to the intermittency of electricity generation and balancing generation with demand; there is often a significant grid reinforcement issue associated with solar PV that requires additional infrastructure to be put in place or the incorporation of some balancing / storage technology. The primary physical constraint is the necessity to have roof orientations facing south to attain the maximum solar harvest for the benefit of the technology. Also the overshadowing needs to be considered for each dwelling/ buildings. Solar PV is a standalone technology that can integrate with other most other technologies; other than those that may compete for roof space (such as solar thermal). It can contribute to meeting the electricity demands without interfering with heat generating technologies and sit comfortably with other electrical generating options. SUMMARY Roof mounted solar PV is able to generate significant electricity on site. However there are several challenges to this technology such as roof availability, roof orientation, shading/ shadowing and the need for grid reinforcement. Due to the restricted available roof space this option would not be able to meet the total electricity demands of Eco Town but could contribute significantly. This option is able to sit comfortably alongside many other technologies and therefore could be considered as part of a suite of technologies utilised to achieve energy demand and carbon savings. Hyder Consulting (UK) Limited Page 33
7 6.6 Appraisal of Solar PV (Land Base) Key Themes Comments ENVIRONMENT Carbon reduction and Energy Generation potential A large scale land based PV array has the potential to generate significant amounts of electricity resulting in substantial carbon savings. For this appraisal; a 20 ha field has been utilised to demonstrate the generation capacity: PV array Size = 28,200 kwp Total Electricity Generation = 23,970 MWh Net Carbon Savings = 12,440 tonnes To meet the complete electricity demands of the site approximately 92 hectares would need to be required for PV array. The below summaries the percentage of energy generated and carbon savings achieved relative to regulated and unregulated energy (based on the 20 ha option): Regulated & Unregulated % energy demand met 32% 45% % carbon savings 48% 89% Regulated only Spatial and Landscape Land based PV array would occupy a significant area of land and depending where it is located may be overlooked. However, the site and immediate surrounding area is relatively flat, with numerous hedgerows that define the existing field patterns; which would likely afford significant screening. Biodiversity Environmental quality Installation of land based PV arrays can sit comfortably alongside planting fields with certain species of meadow grass. The need to secure the area around the PV array would likely benefit biodiversity. There are no negative issues with regards to air quality, noise and water quality as this option. SOCIAL Governance Equity Health / Wellbeing Local governance is possible but unlikely due to the need to fund the complete array early. However, some sort of share type arrangement may be possible as occupiers move into the development; linked to owning properties. This technology has the potential to reduce energy bills; as it requires significant investment cost it will likely managed through private investment. There are no negative health and wellbeing concerns of this technology ECOMONIC Typical Cost Solar PV is one of the more expensive renewable technologies, but one which has been subject to significant downward price shifting due to relatively rapid take up and technology improvements. For this appraisal the guided solar PV installation cost has been assumed to be 2500/kWp (incl. installation). As downward pricing continues the economics of this option will improve. As a comparable cost, this technology equates to / kwh (based on 25 year life time cost). The above cost contributes towards meeting approximately 59% of total regulated and unregulated electricity demands of the site. This cost includes the capital and maintenance of this option. The above cost includes the 4% RPI average per year for maintenance and fuel cost and 5% interest rate for the capital cost. The above costs do not include any reinforcement works required to the national grid. Hyder Consulting (UK) Limited Page 34
8 Typical Payback Incentives/Grants Phasing Land Values Better payback is achievable due to large energy users are available on site. This is generally between 8 to 10 years. Grants & Funding Current available grants/ funding are as follows: FIT= 6.85pence/kWh ROC = 2/MWH Export Tariff = 4.64 pence/kwh FITs are not applicable above 5MW and ROC would only be applicable to 31 st March 2017 and then the scheme will be closed for new generations. Theoretically it would be possible to phase installation; as the systems are modular and additional load could be added in stages; however, it is more typical to install larger trenches of arrays at a time; which facilitates other grid connection issues such as sub stations etc. Land based PV arrays take up large areas of land; and therefore directly compete with other land uses. Dependent on screening and security issues; adjoining land values may also be affected by the presence of a PV array. TECHNICAL Connecting Infrastructure Physical factors Integration with other technologies Due to the intermittency of electricity generation and balancing generation with demand; there is often a significant grid reinforcement issue associated with solar PV that requires additional infrastructure to be put in place or the incorporation of some balancing / storage technology. The major physical constraint is availability of land; that is not overshadowed and overlooked. Solar PV is a standalone technology and can integrate with most other technologies. It can contribute to meeting the electricity demands without interfering with heat generating technologies and can sit comfortably with other electrical generating options. SUMMARY A solar PV land based array would be able to generate significant electricity; provided that sufficient land was available. It is estimated that approximately 92ha of land would be required to meet 100% of the electricity demand of the site; and would require significant grid reinforcement (which will be necessary as part of the development). This option is able to sit comfortably alongside many other technologies and therefore could be considered as part of a suite of technologies utilised to achieve energy demand and carbon savings. Hyder Consulting (UK) Limited Page 35
9 6.7 Appraisal of Solar Thermal Key Themes Comments ENVIRONMENT Carbon reduction and Energy Generation potential Solar Thermal technology generally only contributes towards the hot water demands and therefore has small footprint with regards to energy generated and carbon savings. At the NW Bicester site this technology could contribute to meeting the hot water demands of the residential dwellings; requiring approximately 65% of the available roof space. The following calculations has been made for residential properties: Residential Hot Water Generation = 12,891,619 kwh (from 65% of available Residential roof space); saving 2785 tonnes of carbon Commercial Hot Water Generation = 747,500 kwh (from 65% of available roof space); saving 161 tonnes of carbon The below summaries the percentage of energy generated and carbon savings achieved relative to regulated and unregulated energy: Regulated & Unregulated % energy demand met 18% 26% % carbon savings 11% 21% Regulated only Spatial and Landscape This technology is unlikely to have any impact to landscape character or view. It may however create a distinctive streetscape and design concept relative to the development. Biodiversity Environmental quality There are no biodiversity impacts associated with solar Thermal option. There are no negative issues with regards to air quality, land quality, noise and water quality regarding this option SOCIAL Governance As this technology is installed on each building; it can largely be owned by the home owners / occupiers of the development. Equity Health / Wellbeing Solar Thermal would create an immediate and direct benefit to the home owners and occupiers of buildings; reducing electricity bills. There are no significant health and safety issues linked with this technology, except the risk of scalding which can if not designed appropriately. Design should be undertaken to maintain the balance between bacteria growth, scald risk, water flow rates and scale reduction. ECOMONIC Typical Cost Typical Payback Incentives/Grants The solar thermal installation cost relatively low but additional plumbing is required in comparison with the traditional boiler which increases the overall cost. As a comparable cost, this technology equates to / kwh (based on 25 year life time cost). The above cost is based upon contribution to the hot water demands only. This cost includes the capital and maintenance of this option. The above cost includes the 4% RPI average per year for maintenance and fuel cost and 5% interest rate for the capital cost. Typical Payback 10 years Grants & Funding Current available grants/ funding are as follows: RHI = 8.5pence/kWh Hyder Consulting (UK) Limited Page 36
10 Phasing Land Values Phasing is easily achievable as this technology is building mounted and the solar thermal collectors can be fitted as each building (or group of buildings) near completion. Therefore operation and cash flow can be phased alongside build out. There are not considered to be any land value issues associated with this technology. TECHNICAL Connecting Infrastructure Physical factors Integration with other technologies No grid connection is required and no additional infrastructure required except the additional plumbing and large hot water storage tank. This might be an issue for small 1 to 2 bedrooms unit types. The technical constraints associated with this option are south roof facings, extra plumbing, and year round hot water demands (which requires a larger than normal hot water storage with immersion heater to boost heat). This technology may be difficult to install in small unit types and flats. This is a standalone hot water generation technology that can combine with electricity generating technologies; although may conflict with roof mounted solar PV. SUMMARY This technology can contribute to the hot water demands at the site. However there are several challenges to this technology such as amount of roof available for installation, roof orientation and shading/ shadowing. In addition, if there may be conflicting demands on roof space between Solar Thermal and Solar PV dependent upon demands and carbon savings achieved. Hyder Consulting (UK) Limited Page 37
11 6.8 Appraisal of Wind (Small/Medium Scale) Key Themes Comments ENVIRONMENT Carbon reduction and Energy Generation potential The carbon reduction and energy generation potential of wind turbine technology is dependent upon wind speed. Small scale wind turbines would not be feasible due to poor wind speed (approximately 4.7m/s) at Bicester at 10m above ground level. Medium scale wind turbines, with a tower height of 45meters and the average wind speed of 6.1 m/s to 6.4 m/s has the potential to generate electricity; albeit at the lower end of the power scale. Total electricity Generation from a single 800kW wind turbine system at a wind speed of 7m/s and hub height of 60m = 387,472kWh; saving 201 tonnes of carbon per turbine. To meet the total residential electricity (regulated and unregulated) demands of the site would require around 54 of the above wind turbines and a further 27 to meet the commercial demands. The below summaries the percentage of energy generated and carbon savings per wind turbine to achieved relative to regulated and unregulated energy: Regulated & Unregulated % energy demand met 0.51% 1% % carbon savings 2% 3% Regulated only Spatial and Landscape Landscape visual impacts will occur as a result of the installation of wind turbines; which would necessitate detailed assessment. Residential development is typically sited at least 500m away from wind turbines (see below). Biodiversity Environmental quality There are potential biodiversity issues associated with wind turbines i.e. small bird trappings/killing within the turbine wings associated with wind turbines however there are none major issues of concerns occurs for this site. Noise can be an issue associated with this technology; generally requiring turbines to be located at least 500m away from residential areas. SOCIAL Governance Equity Health / Wellbeing Local governance is possible but unlikely due to the need to fund the complete array early. However, some sort of share type arrangement may be possible as occupiers move into the development; linked to owning properties. This technology has the potential to reduce energy bills; as it requires significant investment cost it will likely managed through private investment. As mentioned above, there may be noise issues associated with this technology that may be regarded as a nuisance. ECOMONIC Typical Cost Typical Payback As a comparable cost, this technology equates to / kwh (based on 25 year life time cost). This is based on meeting approximately 2% of total regulated and unregulated electricity demands of the site; from a single medium scale (circa 60m hub height) turbine. This cost includes the capital and maintenance of this option. The above cost includes the 4% RPI average per year for maintenance and 5% interest rate for the capital cost. The above costs do not include any reinforcement works required to the national grid to enable grid connection Typical Payback 10 to 20 years Hyder Consulting (UK) Limited Page 38
12 Incentives/Grants Phasing Land Values Grants & Funding Current available grants/ funding are as follows: FIT = pence/kwh (15kW to 100kW turbines) Export Tariff = 3.20 pence/kwh Theoretically it would be possible to phase installation; one turbine at a time; however, it is more typical to install several turbine in one go to facilitate planning, grid connection issues and funding. Adjacent and nearby land values may be negatively affected due to perceived visual impact. TECHNICAL Connecting Infrastructure Physical factors Integration with other technologies Due to the intermittency of electricity generation and balancing generation with demand; there is often a significant grid reinforcement issue associated with wind turbines that requires additional infrastructure to be put in place or the incorporation of some balancing / storage technology. Wind speed is the predominant factor in determining the suitability of this technology. Even at 60m hub height, the predicted wind speed is at the lower end of the power scale; only just making medium scale turbines viable. Medium scale wind turbine is a standalone technology and can integrate with most other technologies. It can contribute to meeting the electricity demands without interfering with heat generating technologies and can sit comfortably with other electrical generating options. SUMMARY Small scale wind turbines would not be viable at Bicester due to the lack of sufficient wind speed. Medium scale turbines may be viable; with an estimated average speed of 6.8m/s at a hub height of 60meters. Each medium scale turbine would only contribute a small portion of the sites electricity demand; requiring around 81 turbines to meet the total electrical demand. (Note: If higher wind speeds were recorded at the site it would significantly improve electricity generation) Hyder Consulting (UK) Limited Page 39
13 6.9 Appraisal of Wind (Large Scale) Key Themes Comments ENVIRONMENT Carbon reduction and Energy Generation potential The carbon reduction and energy generation potential of wind turbine technology is dependent upon wind speed. Large scale wind turbines generally require a minimum of 6 m/s to operate; and commonly require wind speeds over 9m/s to generate electricity efficiency. Based upon another proposal for large scale wind with Cherwell District Council area we have assumed a wind speed of 6.4m/s may be achievable. Total Electricity Generation from a 3MW wind turbine at a wind speed of 6.8m/s = 904,102 kwh; saving circa 938 tonnes of carbon (per turbine). The above meets the portion of the electricity demands of the EcoTown, in total approximately 4% of the overall electricity demands of the residential dwellings and 9% of the commercial buildings. However to meet the residual electricity demand additional 34 similar large scale wind turbines would be required. The below summaries the percentage of energy generated and carbon savings per wind turbine to achieved relative to regulated and unregulated energy: Regulated & Unregulated % energy demand met 1.2% 2% % carbon savings 4% 7% Regulated only Spatial and Landscape Landscape visual impact is commonly regarded as one of the major issues associated with this technology and often means that medium to large scale turbines are located away from existing and new developments. Biodiversity Environmental quality There are potential biodiversity issues associated with wind turbines i.e. small bird trappings/killing within the turbine wings associated with wind turbines however there are none major issues of concerns occurs for this site. Noise can be an issue associated with this technology; generally requiring turbines to be located at least 500m away from residential areas. SOCIAL Governance Equity Health / Wellbeing Local governance is possible but unlikely due to the need to fund the complete array early. However, some sort of share type arrangement may be possible as occupiers move into the development; linked to owning properties. This technology has the potential to reduce energy bills; as it requires significant investment cost it will likely managed through private investment. As mentioned above, there may be noise issues associated with this technology that may be regarded as a nuisance. ECOMONIC Typical Cost Typical Payback As a comparable cost, this technology equates to / kwh (based on 25 year life time cost). This is based on meeting approximately 2.9% of total regulated and unregulated electricity demands of the site; from a single large scale turbine. This cost includes the capital and maintenance of this option but does not include the grid connection cost to distribute the electricity. The above cost includes the 4% RPI average per year for maintenance cost and 5% interest rate for the capital cost Typical Payback 4 8 years Hyder Consulting (UK) Limited Page 40
14 Incentives/Grants Phasing Land Values Grants & Funding Current available grants/ funding are as follows: FIT = 4.9 pence/kwh (greater than 1.5MW turbines) Export Tariff = 3.20 pence/kwh Theoretically it would be possible to phase installation; one turbine at a time; however, it is more typical to install several turbines in one go to facilitate planning, grid connection issues and funding. Adjacent and nearby land values may be negatively affected due to perceived visual impact. TECHNICAL Connecting Infrastructure Physical factors Integration with other technologies Due to the intermittency of electricity generation and balancing generation with demand; there is often a significant grid reinforcement issue associated with wind turbines that requires additional infrastructure to be put in place or the incorporation of some balancing / storage technology. Wind speed is the predominant factor in determining the suitability of this technology. Available information suggests that average wind speeds are relatively low to moderate; at the lower end of the power scale; only just making wind turbines viable. Another physical constraint is spacing distance between turbines and usual separation zone to any residential land use (due to noise impacts). Wind turbine is a standalone technology and can integrate with most other technologies. It can contribute to meeting the electricity demands without interfering with heat generating technologies and can sit comfortably with other electrical generating options. SUMMARY Using a wind speed of 6.4 m/s and 100 m hub height a single large scale turbine would generate electricity to meet 4% of total residential demands and 9% of commercial demands. This would require around 34 large scale wind turbines to meet the total electricity demands of the site. Hence, the wind speed investigations should be carried out before the consideration of this option. The economic appraisal of this option has been discussed under section 8 of this report. (Note: If higher wind speeds were recorded at the site it would significantly improve electricity generation) Hyder Consulting (UK) Limited Page 41
15 6.10 Appraisal of Heat Pump Technology Key Themes Comments ENVIRONMENT Carbon reduction and Energy Generation potential This low carbon technology requires electricity to leverage the generation of high efficient heat, and therefore has a reduced carbon reduction potential relative to some renewable options. For this appraisal; we have sized this technology to meet the total thermal demand of the site; however, it is often associated with only providing space heating demand. The below details the energy generation and carbon savings associated with this option: Residential thermal demand = 27,398,887 kwh (Net Carbon Savings in comparison with traditional (85% efficient) boiler = 1178tonnes) Commercial thermal demand = 16,931,235 kwh (Net Carbon Savings in comparison with traditional (85% efficient) boiler = 728tonnes) The below summaries the percentage of energy generated and carbon savings achieved relative to regulated and unregulated energy: Regulated & Unregulated % energy demand met 59% 84% % carbon savings 7% 14% Regulated only Whilst this technology can be sized to meet thermal demand; the corresponding carbon saving is relatively limited because of the electricity used to leverage this heat generation. Spatial and Landscape The heat pump does not have any visual impact within the landscape and would not influence streetscape. Biodiversity Environmental quality There are no biodiversity concerns of this technology at Bicester site. Noise issues can occur with air source heat pumps and therefore careful selection of low noise machines and siting external units in locations to avoid nuisance would be essential. Open loop ground source heat pumps have the potential to impact underlying groundwater characteristics; and would need approval from the Environment Agency. Close loop systems would be more typical and would not have the same potential risk. SOCIAL Governance Equity Health / Wellbeing This technology is typically installed on a building by building basis; and therefore it can largely be owned by the home owners / occupiers of the development. This option would create an immediate and direct benefit to the home owners and occupiers of buildings; reducing electricity bills. There are no significant health and wellbeing issues associated with heat pump technology. As mentioned above, there is the potential for air source heat pumps to cause noise issues; which requires careful selection of low noise machines and siting of external units in locations to avoid nuisance. ECOMONIC Typical Cost Typical Payback As a comparable cost, this technology equates to / kwh (based on 25 year life time cost). This cost includes the capital, maintenance and fuel cost of this option. The above cost includes the 4% RPI average per year for maintenance and fuel cost and 5% interest rate for the capital cost. Typical Payback 8 years Hyder Consulting (UK) Limited Page 42
16 Incentives/Grants Phasing Land Values Grants & Funding Current available grants/ funding are as follows: RHI = 3 pence/kwh Installation is typically on a building by building basis and therefore operation and cash flow can be phased alongside build out. There are not considered to be any land value issues associated with this technology. TECHNICAL Connecting Infrastructure Physical factors Integration with other technologies There are no additional infrastructure issues directly linked with this technology however for ground source heat pump the bore hole system would cause some additional infrastructure cost for ground works. Ground source heat pumps require access to land where the borehole system can be installed (underneath buildings if needed). Air source heat pumps require careful siting of the external heat exchanger to prevent nuisance. This technology generally works better with under floor heating system rather than wet radiator heating systems. This is a standalone hot water/space heating generation technology that can combine with electricity generating technologies. It would not integrate with other heat generating technologies. SUMMARY Heat pump technology could meet the thermal demands of the site; however it requires electricity to operate and therefore does not create the same carbon savings as some other options. Ground source heat pumps require some ground space for borehole installation or trenches and air source heat pumps require careful siting of the external heat exchanger to avoid noise nuisance. Hyder Consulting (UK) Limited Page 43
17 6.11 Appraisal of Biomass Boiler Technology Key Themes Comments ENVIRONMENT Carbon reduction and Energy Generation potential Biomass boiler utilises renewable wood chips/pellets as a fuel source (or potentially biofuel) to generate heat; and therefore reduces carbon emissions further when against traditional gas boiler technology. However, this technology is only feasible when sufficient sustainable wood chip/pellet fuel is available. Provided that sufficient biomass fuel is available then this technology can be sized to meet the thermal energy requirements of the development; as follows (based on 2000kW Unit): Heat Production = 44,330,122 kwh The net carbon savings would be 8,741 tonnes. The below summaries the percentage of energy generated and carbon savings achieved relative to regulated and unregulated energy: The below summaries the percentage of energy generated and carbon savings achieved relative to regulated and unregulated energy: Regulated & Unregulated % energy demand met 59% 84% % carbon savings 34% 63% Regulated only This technology option can be sized to meet the thermal demands on site and also reduces the carbon footprint due to non-reliance on fossil fuel.. Spatial and Landscape No significant landscape issues associated with this option as the biomass plants are enclosed within a building structure; with the exception of the biomass fuel storage which may be a silo type structure; which is in keeping with the existing rural nature of the site and is not considered to represent a landscape impact. It is likely that at least 2 energy centres would be required; sized approximately 25m x15m with additional service yards. It is not considered that these would represent a negative spatial or landscape impact as they would be fully integrated into the masterplan layout and design. However, each would have exhaust flues extending some 15m from the CHP plant; which would have limited local landscape impact. Biodiversity Environmental Quality There are no significant biodiversity concerns with this technology at the site. Potential air quality can occurs due to the burning of wood fuel, which have a higher nitrogen oxide content than traditional gas boilers; however this would be controlled as part of the plant and flue arrangements and so unlike to cause any actual impact. SOCIAL Governance As this technology is installed on each building; it can largely be owned by the home owners / occupiers of the development Equity Health / Wellbeing Biomass Boiler would create an immediate and direct benefit to the home owners and occupiers of buildings; reducing the heating bills. No significant health and wellbeing issues. ECOMONIC Typical Cost Typical Payback Hyder Consulting (UK) Limited Page 44
18 Incentives/Grants Phasing Land Values Phasing is easily achievable with this option; as biomass boilers are fitted as each building (or group of buildings) near completion. Therefore operation and cash flow can be phased alongside build out. There are not considered to be any land value issues associated with this technology. TECHNICAL Connecting Infrastructure Physical factors Integration with other technologies No grid connection is required and no additional infrastructure required except the additional plumbing and large biomass fuel storage space. This might be an issue for small 1 to 2 bedrooms unit types. The technical constraints associated with this option are mainly the availability, secure and consistent delivery of Biomass fuel and also at the cost effective manner. This is a standalone technology that can combine with any other electricity generating technologies without interruption. SUMMARY Biomass boiler could meet the overall heating demands of the development; however, consistent and availability biomass fuel would be required to facilitate this. This option would also create significant carbon savings. Hyder Consulting (UK) Limited Page 45
19 6.12 Appraisal of Enhance FEE standards Key Themes Comments ENVIRONMENT Carbon reduction and Energy Generation potential Adoption of enhanced FEE standards can result in carbon savings due to reduction in heating demand. The savings in regulated energy demand shown in the graph below are through improvements in the fabric efficiency, ventilation, thermal bridging and air tightness proposed. The chart below shows the impact of changing FEE standard with regards to the % improvement in overall energy demands relative to CSH level 4 FEE standards; which is the PPS1 baseline for the eco-development. 60% 40% 20% 0% -20% -40% BR 2010 baseline CSH 4 FEE CSH 5/6 FEE Passivhaus Spatial and Landscape This option would not impact landscape character or views. Biodiversity Environmental quality There are no biodiversity concerns from enhance FEE as it does not alters the construction process. There are no negative issues with regards to air quality, noise and water quality regarding this option SOCIAL Governance Equity Health / Wellbeing There are no governance issues associated with this option. As each unit would be built to the FEE standards all residents would have equal benefit. This option would minimise the overall heating demand of the building and therefore reduce energy bills for every occupant. Potential indoor air quality issues may occur due to air tightness; which would require mechanical ventilation and education of occupiers. Improved insulation and build quality would potentially improve noise penetration. ECOMONIC Typical Cost Incentives: Paybacks: Phasing Land Values Adopting higher FEE standards increases the overall construction costs. However by its very nature reduces heating requirements. No monetary incentives available for higher fabric efficiency No data available There are no phasing restrictions as each unit is built to FEE standard. There are no land values issues. TECHNICAL Connecting Infrastructure No additional infrastructure has been required for this option Hyder Consulting (UK) Limited Page 46
20 Physical factors Integration with other technologies There are certain limitations imposed to this option and it is difficult to achieve higher level of fabric efficiency due to building structure and available technology. If very high FEE standards are adopted; which result in very low heating demand, then the selection of which heating and hot water technology may be influenced. SUMMARY Adopting very high FEE levels increases build costs whilst reducing heating demands. Increasing FEE standards beyond a certain level may influence whether some heating and hot water technologies remain valid. Ultimately a decision is required whether to continue to reduce demand at higher build cost or connect to a LZC heating technology. This report has considered that all residential units would be built to Code level 5 FEE standards. Hyder Consulting (UK) Limited Page 47
21 7 TECHNOLOGY INTEGRATION The appraisal sections discuss the limitations of each technology and how they may complement (C) or pair (P) well together; and conversely where they do not typically work well together (X). The following table provides a summary of technology integration and combination. EfW AD CHP Gas CHP Biomass CHP PV array Wind Roof PV Solar Thermal Heat pumps EfW - X X X C C C X X AD CHP X - X 1 X 1 C C C X X Gas CHP X X 1 - X 1 C C C X X Biomass CHP X X 1 X 1 - C C C X X PV array C C C C - P P C C Wind C C C C P - P C C Roof PV C C C C P P - C 2 C Solar Thermal X X X X C C C 2 - X Heat pumps X X X X C C C X - Table 7-1 Technology Integration As always, there are never hard and fast rules; and exceptions exist where technologies that do not typically complement each other; such as biomass CHP and gas CHP, comes when there is a significant heat demand and opportunity exists to have more than one technology combining to service that demand. For example several energy centre with differing CHP technologies all linked via a site wide DHN; sized to share the heat demand these opportunities are identified in the above table as X 1. Such a situation may exist at the NW Bicester site due to the size of heat demand and may provide benefit relative to resilience and security of supply. Where one technology generates heat and another power; then these technologies would typically complement each other. There can, however, be certain situations where physical limitations can create conflict; for example roof mounted solar PV and solar thermal complement each other relative to their respective electrical and thermal generation but compete on roof space to achieve this such aspects are identified in the above table as C 2. In other circumstances; technologies may be able to be paired together to meet a specific demand; such as roof mounted PV and wind turbines. Each generate electricity but do not necessarily compete against each other. Hyder Consulting (UK) Limited Page 48
22 8 SUMMARY OF ENERGY GENERATION, CARBON SAVINGS AND COSTS This section summarises the energy generation and carbon savings of each option in the following tables. These enable comparison of each technology and, together with the previous section, help identify which options may work well together as a collective solution. Table 8-1 below provides a summary of each technology options energy generation capability relative to regulated and regulated/unregulated energy demand. Table 8 1 Energy Generation Potential of Various Options Technology Options Total Generation Capacity % of Total Demand met (Regulated and Unregulated) % of Regulated Demand Ardley (EfW) T: 44,330,122 kwh 59% 84% AD (only food and catering waste) Biomass CHP (sized to meet thermal demands) Gas CHP (sized to meet thermal demands) Large Scale PV (20ha - land space) Large Scale Wind (3MW turbine) Building Scale PV (50% of Roof space) Biomass Boiler (2000 kw th Unit) Medium Scale Wind (800kW turbine) Solar Thermal (to meet the hot water demands) Heat Pump (to meet the thermal demands) E: 1,589,844 kwh T: 2,649,740 kwh E: 21,109,582 kwh T: 44,330,122 kwh E: 20,428,627 kwh T: 44,330,122 kwh 6% 8% 87% 124% 86% 123% E: 23,970,000 kwh 32% 45% E: 904,102 kwh 1.20% 2% E: 18,474,473 kwh 25% 35% T: 44,330,122 kwh 59% 84% E: 387,472 kwh 0.51% 1% T: 13,639,119 kwh 18% 26% T: 44,330,122 kwh 59% 84% Where E reflects to Electrical Demand and T reflects to thermal generation Notes: Site Total Thermal Demand = 44,330,122 kwh and Site Total Electrical Demand = 31,139,326 kwh The above options do not provide any connection hierarchy and have been appraised as individual options relative to their potential to meet the energy demands of the proposed development. Some of the district level options are optimised to meet the complete thermal demand and therefore the above generation capacity depends upon the size of the proposed technology option. The Biomass CHP and Gas CHP options have the potential to meet significant portions of the developments total energy demands; however individual option cannot satisfy the total regulated and unregulated energy demands and a suitable options mix is inevitable. Hyder Consulting (UK) Limited Page 49
23 Table 8-2 below provides a summary of carbon savings of each option; relative to the energy generation identified in table 8-1 above. Table 8 2 Total Carbon Emissions Savings Technology Options Ardley (EfW) (meeting thermal demand) AD CHP (only food and catering waste) Biomass CHP (sized to meet thermal demands) Gas CHP (sized to meet thermal demands) Large Scale PV (20ha - land space) Large Scale Wind (single 3MW turbine) Biomass Boiler (2000kW Unit) Building Scale PV (50% of Roof space) Medium Scale Wind (single 800kW turbine) Solar Thermal (to meet the hot water demands) Heat Pump (to meet the thermal demands) Total Carbon Savings Zero Carbon (Regulated and Unregulated) Zero Carbon (Regulated Energy Only) 9,575 tonnes CO2 37% 69% 1,387 tonnes CO2 5% 10% 19,922 tonnes CO2 77% 143% 12,045 tonnes CO2 47% 86% 12,440 tonnes CO2 48% 89% 938 tonnes CO2 4% 7% 8,741 tonnes CO2 34% 63% 9,588 tonnes CO2 37% 69% 402 tonnes CO2 2% 3% 2,946 tonnes CO2 11% 21% 1,906 tonnes CO2 7% 14% The carbon factors utilised above are as follows: Natural Gas=0.216kgCO2/kWh, Electricity = 0.519kgCO2/kWh and Biomass = 0.016kgCO2/kWh The above table shows the carbon savings from each option and also the percentage of overall carbon saving relative to meeting regulated and regulated/unregulated energy carbon emissions. As can be seen from the above; no one single option is capable of generating the total carbon saving needed; however some options provide significantly more carbon saving than others; therefore a combination of options is inevitable. It should be noted that the above tables (8-1 and 8-2) quote the wind turbine options as a single turbine. It is obvious from the above that a significant number of turbines would be required generate the required electrical demand and create sizeable carbon savings. Table 8-3 below presents a summary of the cost analysis for each option relative to the energy each option generates (as presented in Table 8-1 above). The cost summary table (8-3) presents a comparable / kwh cost for each option. Costs have been calculated on the based on capital costs; and a 5% interest rate on capital cost; average RPI (Retail Price Index) of 4% for maintenance and fuel cost over the period of 25 years. Hyder Consulting (UK) Limited Page 50
24 Following is the indicative costs evaluation table for residential development and lists the capital, maintenance and fuel costs for all the options. Table 8 3 Technology Options Cost Appraisal Technology Option District Heat Network (DHN) Cost 1 ( ) Capital Cost 1 ( ) Maintenance Cost 2 ( )/yr Fuel Cost 2 (,000)/yr Cost Comparison 3 ( /kwh) Ardley Energy from Waste - 26MWe 23,880,000 4,375,000 43, Anaerobic Digestion - 185kWe 23,880, ,000 27,750 Unknown Biomass CHP MWe 23,880,000 9,850, ,000 2, Gas CHP MWe 23,880,000 9,470, , Land base PV Array - 36,635kWp Not Applicable 91,580, ,000 Not Applicable Large Scale Wind kwe Not Applicable 1,330,000 13,300 Not Applicable Building mounted Solar PV - 21,735 kwp Not Applicable 54,330, ,000 Not Applicable Solar Thermal - 85,244m2 Not Applicable 72,455, ,000 Not Applicable Medium Scale Wind Turbine - 456kWe Not Applicable 684,000 3,500 Not Applicable Heat Pumps - 1,687kWth Not Applicable 4,635,000 23,000 1, The capital costs are taken from table 2.11, Cyrill Swett research and survey of suppliers and installers, in Research to Assess the cost and benefits of the Government s proposals to reduce the Carbon footprint of new housing development CLG, September 2008, The AD capital cost is taken from Carbon Trust CTG011, Making sense of renewable energy technologies, March The Ardley cost is based upon the pipe network cost of 3.5 km with the average cost based upon the cost of 1000 for soft land and 1500 for hard land and average cost of 1250 has been used to driver Ardley capital cost. The 3.5km pipe run is the indicative distance for the pipe to follow a connection track from Ardley plant to the EcoTown, however there will be additional extra cost to cross motorways and railway line. Fuel Cost would be Wood Pellets = 125/tonne and Gas = 3.48 pence/kwh Maintenance cost are taken from Energy Savings trust, domestic low and zero Carbon technologies document, ref CE317, September The above cost does not include the cost to build and operate the energy centre and the above CHP options cost will increase to build the energy centre upon the energy centre. Notes: 1: Total Cost this would be subject to 5% interest over 25 years period 2: Maintenance & Fuel Cost this would be subject to annual Retail Price Index (RPI) of 4% over 25 years period 3: The cost comparison is based upon the annual cost over 25 years period with the reflection of 5% interest and 4% RPI. Hyder Consulting (UK) Limited Page 51
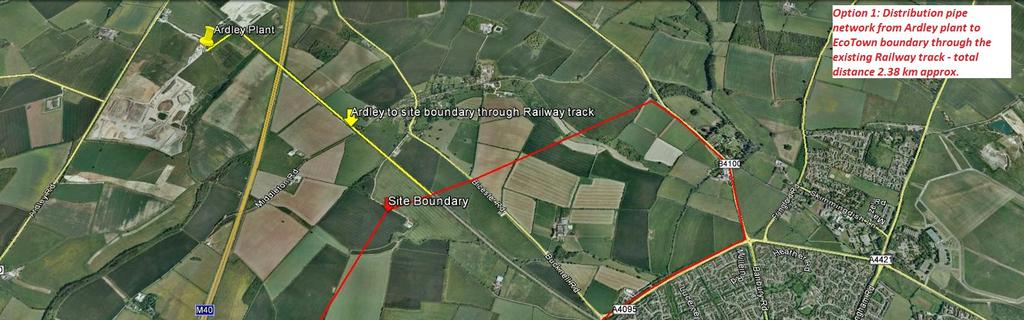
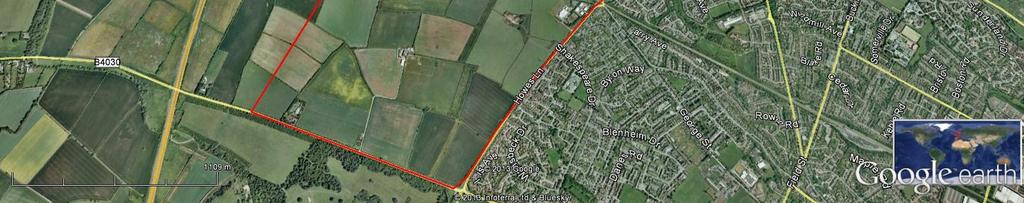
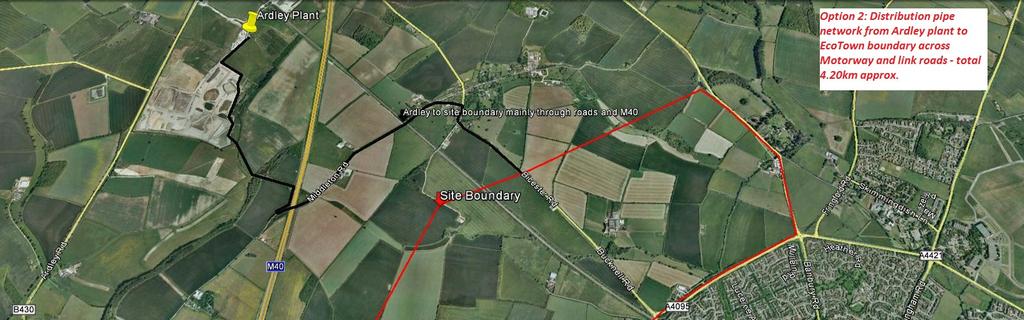
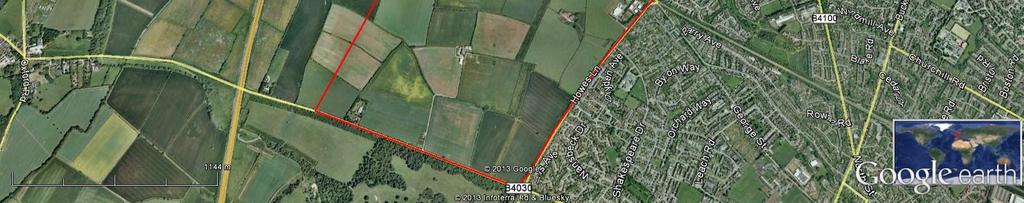
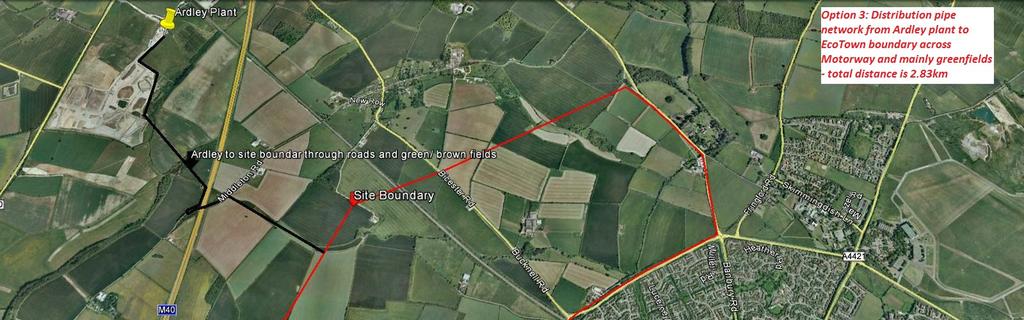
25 9 CONCLUSION This report reviews available Low or Zero Carbon technology options that may be utilised at NW Bicester and also investigates their environmental, economic, social and technical impacts of each of the option. This has been undertaken on the basis of energy demands of both residential and commercial units. The energy demands for the residential units are taken from the SAP 2009 calculations and for commercial units the CIBSE TM46 has been consulted. The details of these calculations and our approach can be found under Energy Demand Technical note (presented in Appendix A) and the copies of SAP worksheets can also be found within the report. Following are the energy demands in terms of fossil fuel and electricity for NW Bicester site. Table 9 1 Energy Demands Summary Development Type Residential 5607 Units Energy Demands Regulated/Unregulated (Electrical Cooking, Electrical Appliances) Electricity Demands (kwh) PA Fossil Fuel Demands (kwh) PA 20,759,351 27,398,887 Commercial Units Energy Demands 10,379,975 16,931,235 Total 31,139,326 44,330,122 Notes: The above table is based upon electrical cooking within residential properties. If an gas cooking option is chosen then the total electrical demand will change (from 31,139,326kWh) to 28,802,859kWh and the total thermal demand will increase (from 44,330, kwh) to 48,418,258 kwh. The above demands are based on adopting an improved building fabric efficiency level (CSH level 5). Therefore to meet the above demands we would require a technology/ mix of technology options which can fulfils the electricity demands of 28,803MWh/yr. and the thermal demands of 48,418MWh/yr. According to the recent discussions with Ardley EfW developer, we have established that the Ardley EfW plant will produce enough waste heat to meet the site space heating and hot water demands, without the need of any additional technology but will require a considerable connecting pipe (alongside a site wide additional district heating network). However this option would require further investigations with regards to the connection from Ardley plant to the Bicester EcoTown, the typical possible routes have been provided within Appedix C of this report. The appraisal has demonstrated that whilst certain technologies may go a considerable way to meeting demands and creating carbon savings; no one technology can fulfil the site s total energy demand and carbon reduction target. A combined technology solution will be inevitable. Hyder Consulting (UK) Limited Page 52
26 Appendix A Baseline Energy Demand Technical Note UA ESD-R-1 Hyder Consulting (UK) Limited Page 53
27 Appendix B Ardley Road Routes options Hyder Consulting (UK) Limited Page 54
28
29

30