IUKWC Workshop: Enhancing Freshwater Monitoring Through Earth Observation 19 th - 21 st June 2017 at University of Stirling, Scotland.
|
|
|
- Colleen Lambert
- 5 years ago
- Views:
Transcription


1 IUKWC Workshop: Enhancing Freshwater Monitoring Through Earth Observation 19 th - 21 st June 2017 at University of Stirling, Scotland. Dr. (Ms.) Jyothi Prasad Professor, Department of Civil Engineering College of Technology, G. B. Pant University of Agriculture & Technology Pantnagar Uttarakhand State, India jptce@gbpuat-tech.ac.in
2 India at glance India Water Maths India's Per Capita Annual Water Availability Surface water availability River Basin Classification River water Pollution National water quality policy Parameters Criteria for Selection of Monitoring Stations River Water Monitoring by CWC Identification Of Polluted River Stretches Constraints and Limitatons of Monitoring the net work
3 Area 3.28 million sq km (2% of world s total ) Population(2017) Coordinates 1.34 billion (134 crores) 16% of world s total and North latitudes and East longitudes Climate Land Frontier Coastline No.of States/UTs Tropical (Tropic of cancer divides India two halves) 15,200 km 7,500 km 29 States and 7 Union territories including the National Capital Region of Delhi
4
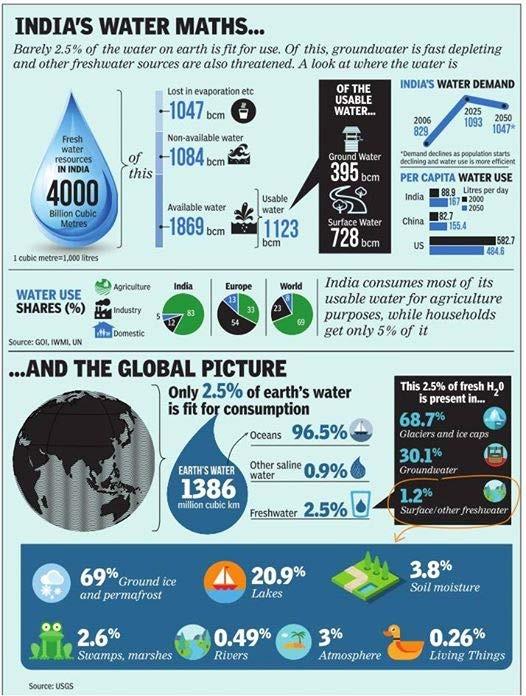
5 Peculiarities of Water Availability in India Highly Uneven in Space and Time Nearly 80% of the annual rainfall takes place in only 3 to 4 months Precipitation in India is not uniformly distributed and varies from less than 100 mm/year in Rajasthan to more than 2,500 mm/year in Assam. On an average, there are only 40 rainy days (100 hours) Brahmaputra - Barak - Ganga System accounts for about 60% of total surface water resources Western and Southern regions experience severe deficit in water availability Drought - Flood - Drought Syndrome is witnessed years after years
6
 The Past 1951-5177 2001-1820 Future Projections")
7 India's Per Capita Annual Water Availability (cu.m/capita/year) The Past Future Projections
8 SL. NO Based on 1 India WRIS (Water Resource Systems of India) Major 25 2 CWC Basin (Central Water 22 Commission) 3 NCIWRDP (National Commission for 24 Integrated Water Resources Development Plan) 4 AISLUS (All India and Land use survey 35 organization of the departments of agriculture and co-operation 5 CGWB (Central Ground Water Board) 34
9 River Basin Catchment Area Sq.km (%) No. of Basins Major More than 20, Medium Between , Minor Less than 2,000 52

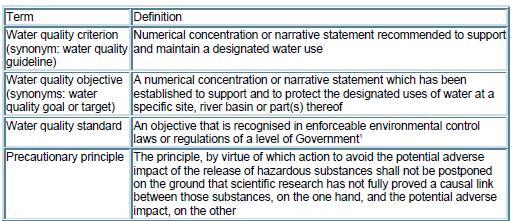
10 Water quality criteria are developed by scientists and provide basic scientific information about the effects of water pollutants on a specific water use. They also describe water quality equirements for protecting and maintaining an individual use. Water quality criteria are based on variables that characterise the quality of water and/or the quality of the suspended particulate matter, the bottom sediment and the biota.
11

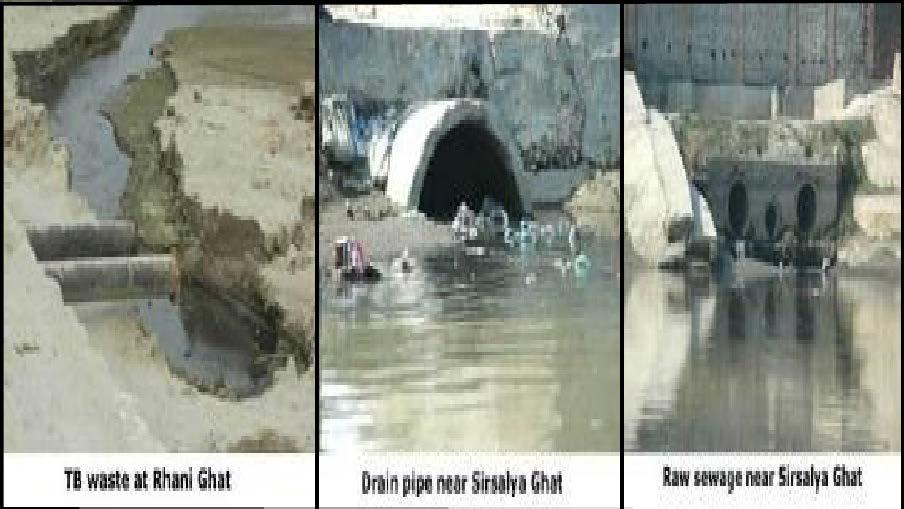
12 Increase in population, urbanization and industrialization is causing an everincreasing threat to the quality of waters in rivers, lakes and ponds in India. Each time water is used for some activity, its quality is degraded. Unfortunately, the sacred(holy) attached to rivers in the country does not ensure that the rivers are clean.
13 A river is defined as a large natural stream of water emptying into an ocean, lake, or other body of water and usually fed along its course by converging tributaries. Rivers and streams drain water that falls in upland areas. Moving water dilutes and decomposes pollutants more rapidly than standing water, but many rivers and streams are significantly polluted all around the India.
14 A primary reason for this is that all three major sources of pollution (industry, agriculture and domestic) are concentrated along the rivers. Industries and cities have historically been located along rivers because the rivers provide transportation and have traditionally been a convenient place to discharge waste. Agricultural activities have tended to be concentrated near rivers, because river floodplains are exceptionally fertile due to the many nutrients that are deposited in the soil when the river overflows.
15 Chemical waste products from industrial processes are sometimes accidentally discharged into rivers. Examples of such pollutants include cyanide, zinc, lead, copper, cadmium and mercury. These substances may enter the water in such high concentrations that fish and other animals are killed immediately.
16
17 Total riverine length under different levels of pollution in India Severely polluted Moderatly polluted Relatively clean Severely polluted 15% Moderatly polluted 19% Relatively clean 66%
18 14000 River basin-wise riverine length under different level of pollution BOD <3 mg/l BOD 3-6 mg/l BOD >6 mg/l Riverine length, Km Indus Ganga Bramaputra Sabarmati Mahi Narmada Tapi Subernrekha Brahmini Mahanadi River basin Godavari Krishna Pennar Cauvery Ghaggar Medium Minor
19 Designated best use Class Criteria Drinking water source without conventional treatment but after disinfections A *Total coliform organisms MPN/100ml shall be 50 or less. *ph between 6.5 and 8.5. *Dissolved oxygen 6 mg/l or more *Biochemical oxygen demand 2 mg/l or Less Outdoor bathing (organised) B *Total coliform organisms MPN/100ml shall be 500 or less Drinking water source with conventional treatment followed by disinfection C *ph between 6.5 and 8.5 *Dissolved oxygen 5 mg/l or more *Biochemical oxygen demand 3 mg/l or Less *Total coliform organisms MPN/ 100ml shall be 5000 or less *ph between 6 and 9 *Dissolved oxygen 4 mg/l or more *Biochemical oxygen demand 3 mg/l or less Propagation of wild life, fisheries D *ph between 6.5 and 8.5 Irrigation, industrial cooling, controlled waste disposal Water Quality Criteria *Dissolved oxygen 4 mg/l or more *Free ammonia (as N) 1.2 mg/l or less E *ph between 6.0 and 8.5 *Electrical conductivity less than 2250 micro mhos/cm *Sodium absorption ratio less than 26 *Boron less than 2mg/l
20 river Polluted stretch Desired class Chambal Damodar Godavari Gomti Hindon Kali Downstream of Nagda and downstream of Kota Downstream of Dhanbad Downstream of Nasik and Nanded Lucknow to confluence with Ganga Saharanpur to confluence with Yamuna Downstream of Modinagar to confluence with Ganga Existing class Critical parameters Possible source of pollution C D/E BOD, DO Domestic and industrial waste from Nagda and Kota C D/E BOD, Toxicity Industrial wastes from Dhanbad, Durgapur, Asansol, Haldia and Burnpur C D/E BOD Wastes from sugar industries, distilleries and food processing industries C D/E DO, BOD, Coliform C D DO, BOD, Toxicity C D/E BOD, Coliform Industrial wastes from distilleries and domestic wastes from Lucknow Industrial and domestic wastes from Saharanpur and Ghaziabad Industrial and domestic wastes from Modinagar
21 river Polluted stretch Desired class Existing class Critical parameters Possible source of pollution Krishna Karad to Sangli C D/E BOD Wastes from sugar industries and distilleries Sabarmati Immediate upstream of Ahmedabad up to Sabarmati Ashram B E DO, BOD, Coliform Domestic and industrial waste from Ahmedabad Sabarmati Ashram to Vautha D E DO, BOD, Coliform Domestic and industrial waste from Ahmedabad Satluj Downstream of Ludhiana to Harike C D/E DO, BOD Industrial wastes from hosieries, tanneries, electroplating and engineering industries and domestic waste from Ludhiana and Jalandhar Downstream of Nangal C D/E Ammonia Wastes from fertilizer and chloralkali mills from Nangal Subarnarekha Hatia dam to Bharagora Yamuna Delhi to confluence with Chambal C D/E -do- Domestic and industrial waste from Ranchi and Jamshedpur C D/E DO, BOD, Coliform Domestic and industrial wastes from Delhi, Mathura and Agra In the city limits of Delhi, Mathura and Agra B D/E DO, BOD, Coliform Domestic and industrial wastes from Delhi, Mathura and Agra

22 Objective of Water Quality Monitoring
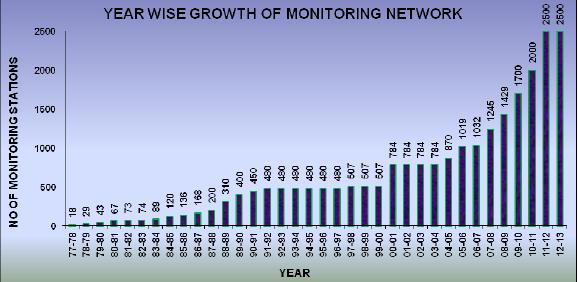
23 NATIONAL WATER QUALITY MONITORING PROGRAMME Water quality monitoring in India started in 1978 under Global Environmental Monitoring System (GEMS) Programme. National programme of Monitoring of Indian National Aquatic Resources started in 1984 with a total of 120 stations in 10 River Basins. During the year 2000 moitoring network comprising of 870 stations extended to 26 states & 5 Union Territories. The monitoring is done on monthly or quarterly basis in surface waters and on half yearly basis in case of ground water. The monitoring network covers 445 Rivers, 154 Lakes, 12 Tanks, 78 Ponds, 41 Creeks/Seawater, 25 Canals, 45 Drains, 10 Water Treatment Plant (Raw Water) and 807 Wells.

24 Water quality & waste water management vision (CPCB)
25
26 RIVER BASIN WISE DISTRIBUTION OF WATER QUALITY MONITORING STATIONS Baitarni (5) 5 Brahmani (11) Tributaries-Karo (1), Koel (2), Sankh (2) Brahmaputra (6) Tributaries-Burhidihing (1), Dhansiri (6), Disang (1), Jhanji (1), Subansiri (1), Bhogdoi (1), Bharalu (1), Borak (1), Deepar Bill (1), Digboi (1), Mora Bharali (1), Teesta (4), Dickhu (1), Maney (2), Ranchu (2) Cauvery (20) Tributaries-Arkavati (1), Amravati (1), Bhawani (5), Kabini (4), Laxmantirtha (1), Shimsa (2), Hemavati (1), Yagichi (1) Ganga (39) Tributaries-Barakar (1), Betwa (3), Chambal (7), Damodar (5), Gandak (1), Saryu-Ghaghra (3), Gomti (5), Hindon (3), Kali (West) (2), Kali Nadi (2), Khan (1), Kshipra (3), Mandakini (Madhya Pradesh) (1), Parvati (2), Ramganga (1), Rapti (1), Rihand (2), Rupanarayan (1), Sai (1), Sone (5), Tons (Madhya Pradesh) (2), Yamuna (23),Sind (1), Johila (1),Sankh(1), Gohad (1), Kolar (1), Sai(1), Churni (1), Tons (Himachal Pradesh) (1),Sikrana (1),Daha (1), Sirsa (1), Dhous (1), Farmer (1) Godavari (11) Tributaries- Manjira (2), Maner (2), Nira (I), Wainganga (4), Wardha (1), Kolar (1), Kanhan (1), Purna (1), Karanja (1), Indravati (2), Shankhani (1) Indus Tributaries-Beas (18), Chenab (1), Jhelum (3), Larji (1), Parvati (1), Ravi (3), Sutlej (21), Tawi (1), Gawkadal (1), Chuntkol (1), Sirsa (3), Swan (1) Krishna (19) Tributaries- Bhadra (3), Bhima (10), (Ghataprabha (2), Malprabha (3), Muneru (1), Musi (2), Nira (1), Paleru (1), Tunga (1), Tungabhadra (6), Panchganga (3), Chandrabhaga (2) Mahi (9) Tributaries-Anas (1), Panam (1) Mahanadi (18) Tributaries-Ib (4), Hasdeo (2), Kathajodi (1), Kharoon (4), Kuakhai (2), Sheonath (3), Birupa (1), Arpa (1), Kelo (2) Narmada (14) Tributaries-Chhota Tawa (1) Contd. On Next Page
27 Contd. From Pre-Page Pennar (5) 5 Sabarmati (6) Tributaries- Shedhi (1), Khari (1) Subarnerekha (6) 6 8 Tapi (11) Tributaries-Girna (2), Rangawali (1) Medium rivers Ambika (1), Ulhas (2), Ulhas-Bhatsa (1), Ulhas-Kalu (1), Imphal (4), Mandovi (2), Palar (1), Pamba (3), Pariyar (3), Rushikulya (2), Tambiraparani (7), Achankoil (2), Chalakudy (1), Damanganga (6), Ghaggar (21), Kallada (1), Kali-Karnataka (1), Manimala (2), Mindhola (1), Nagavalli (3), Amlakhadi (1), Chaliyar (2), Iril (2), Kharkhala (1), Karmana (1), Kolak(2), Kundalika(1), Meenachil(1), Muvattupuza(1), Patalganga(2), Umtrew(1), Vamanpuram(1), Zuari(2), Gumti(2), Kalna(1), Valvant(1), Madai(1), Khandepar(1), Asanora(1), Neyyar(1), Ithikkara(1), Kadalundy(1), Kuttiyady(1), Mahe(1), Kuppum(1), Neelsvaram(1), Karingoda(1), Chandergiri(1), Chitrapuzha(1), Nambul(2), Ganol(1), Simsang(1), Myntdu(1), Arasalar(1), Kodra(1), Haora(1), Markanda (2), Sukhna (1), Baleshwar Khadi (1), Netravati (1), Kumardhara (1), Purna (1), Kaveri (1), Dhadar (1) Lakes (55) Hussainsagar (1), Saroornagar (1), Himayatsagar (1), Pulicate (1), Salaulim (1), Kankoria (1), Ajwah (1), Sursagar (1), Brahamsarovar (1), Govindsagar (1), Pongdam (1), Renuka (1), Wuller (1), Dal (1), Ulsoor (1), Hebbala Valley (1) Oruvathikotta(1), Sasthamcotta(1), Ashthamudi(1), Paravur(1), Vembanad(1), Periyar(1), Kodumgallor(1), Kayamkula(1), Punnamadakayal(1), Pookotekayal(1), UpperLake(1), LowerLake(1), MultaiLake(1), Loktak(4), Umiam(1), Ward(1), Thadlaskena(1), Osteri(1), Bahour(1), Harike(2), Pichola(1), Udaisagar(1), RamgarhJaipur(1), Pushkar(1), Fatehsagar(1), Kalyana(1), Nakki(1), Udhagamadalam(1), Kodaikanal(1), Yercaud(1), LakshminarayanBaridigh(1), Rudrasagar(1), Ramgarh-UttarPradesh (1), Naini(1), Rabindrasarovar (1) Tanks (4) Dharamsagar (1), Bibinagar (1), Kistrapetrareddy (1), Goysagar(1) Ponds (2) Elangabeel System (1), Lakshadweep (1) Creeks, Canals, Tanks, Ponds, Drains, Creeks (3), Agra Canal (1), Agartala Canal (1), Gurgaon Canal (1), Western Yamuna Canal (9), Drains (10) 25 Groundwater 218 Total 870
28 CRITERIA FOR SELECTION OF MONITORING STATIONS River/Stream Water intake point - community water supply. Large/medium polluting industries or cluster of SSI. Religious bathing. Source of river pristine quality. Filling up long distance between existing stations. D/S of large irrigated areas. Low flow stretches. D/S of big cities. U/S and D/S of confluence of rivers. Inter-state boundaries.
29 Lake/Reservior/Pond/Tank Water abstraction point. Organised bathing. Vicinity of significant outfall. Recreational purpose. Canal Irrigation offtake. D/S of wastewater outfall. Intake point drinking water.
30 Groundwater Drinking water source located in insanitary condition sewage cesspool, septic tank, garbage dump, shallow aquifer. Tube-wells, hand-pumps or dugwells in industrial area.
31 Central Water Commission (CWC) is monitoring water quality at 371 key locations covering all the major river basins of India. CWC is maintaining a three tier laboratory system for analysis of the parameters. The level I laboratories are located at 258 field water quality monitoring stations on various rivers of India Physical parameters such as temperature, colour, odour, specific conductivity, total dissolved solids, ph and dissolved oxygen of river water are observed.
32 There are 23 level II laboratories located at selected division offices to analyze 25 nos. physico chemical characteristics and bacteriological parameters of river water Quality Assessment. 4 level III / II+ laboratories are functioning at Varanasi, Delhi, Hyderabad and Coimbatore where 41 parameters including heavy metals / toxic parameters and pesticides are analysed. The following procedure is followed in CWC for classification of stations, sampling frequency, identification of parameters and their analysis, which is based on
33 Stations are classified as Base, Trend and Flux Stations. CWC has 164 Base stations, 179 Trend stations 28 Flux stations.
34 Base Station: One sample is collected every two months and totals six samples in a year. Trend Stations: Sample is collected once in every month. Flux Stations: Samples are collected thrice in a month, however toxic and trace metal are analyzed once in a month.
35 Water body-wise & Frequency-wise Distribution of Water Quality Monitoring Stations STATE RIVER WELL LAKE OTHER TOTAL MONTHLY HALF YEARLY QUARTERLY YEARLY TOTAL ANDHRA PRADESH ASSAM BIHAR CHHATISSGARH DADRA & NAGAR HAVELI DAMAN DELHI GOA GUJARAT HARYANA HIMACHAL PRADESH JAMMU & KASHMIR JHARKHAND KARNATAKA KERALA LAKSHDWEEP Continued on Next Page..
36 .. Continued from Previous Page STATE RIVER WELL LAKE OTHER TOTAL MONTHLY HALF YEARLY QUARTERLY YEARLY TOTAL MADHYA PRADESH MAHARASHTRA MANIPUR MEGHALAYA NAGALAND ORISSA PONDICHERRY PUNJAB RAJASTHAN SIKKIM TAMIL NADU TRIPURA UTTAR PRADESH UTTRANCHAL WEST BENGAL TOTAL :
37 .. Continued from Previous Page STATE RIVER WELL LAKE OTHER TOTAL MONTHLY HALF YEARLY QUARTERLY YEARLY TOTAL MADHYA PRADESH MAHARASHTRA MANIPUR MEGHALAYA NAGALAND ORISSA PONDICHERRY PUNJAB RAJASTHAN SIKKIM TAMIL NADU TRIPURA UTTAR PRADESH UTTRANCHAL WEST BENGAL TOTAL :
38 Level I Laboratory: Temperature Colour Odour Electrical Conductivity/ Total Dissolved Solids ph Dissolved Oxygen
39 SL NO TESTS SL NO TESTS 1 Temperature 14 Carbonate 2 Electrical 15 Bi Carbonate 3 Conductivity 16 Fluoride 4 ph 17 Chloride 5 Dissolved Oxygen 18 Sulphate 6 Biochemical Oxygen Demand (BOD) 7 Chemical Oxygen Demand (COD) 19 Nitrate 20 Silicate 8 Sodium 21 Phosphate 9 Calcium 22.Total Plate count 10 Magnesium 23 Total Coliform 11 Potassium 24 F. coliform 12 Iron 25. E. Coliform
40 In addition to the parameters as indicated for level II laboratory, the following additional parameters are analyzed. Total Kjeldhal Nitrogen Cyanide Ammonia Nitrogen Pesticides (6 nos.) Total Organic Carbon Toxic Elements(Arsenic, Cadmium, Mercury, Chromium, Lead, Zinc)(total 41 parameters analyzed)
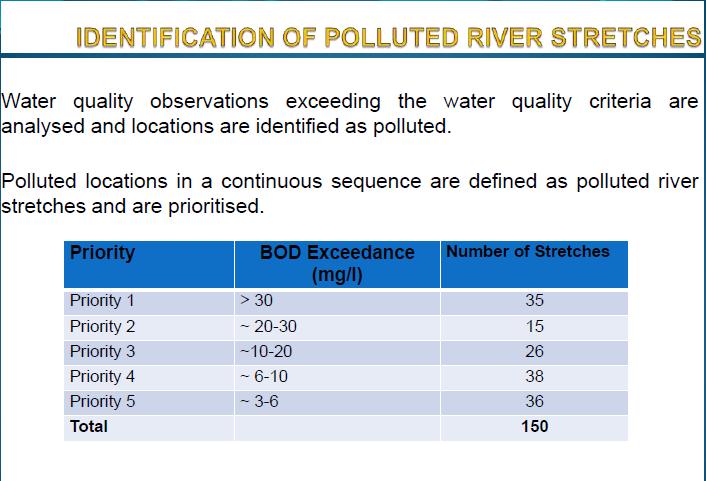
41 Monitoring locations exceeding BOD concentration 30 mg/l has been considered as it is the standard of sewage treatment plant and in river it appears without dilution.(river locations having water quality exceeding discharge standards for BOD to fresh water sources) All monitoring locations exceeding BOD concentration 6 mg/l on all occasions. Monitoring locations exceeding 3 mg/l BOD are not meeting desired water quality criteria but does not affect to Dissolved Oxygen level in water bodies. If BOD exceeds 6mg/l in water body, the Dissolved Oxygen is reduced below desired levels. The raw water having BOD levels upto 5 mg/l are does not form complex chemicals on chlorination for municipal water supplies. Hence the water bodies having BOD more than 6 mg/l are considered as polluted and identified for remedial action.
42 Criteria for Priority 2 Monitoring locations having BOD between mg/l. All monitoring locations exceeding BOD concentration 6 mg/l on all occasions. Criteria for Priority 3 Monitoring locations having BOD between mg/l. All monitoring locations exceeding BOD concentration 6 mg/l on all occasions
43 . Criteria for Priority 4 Monitoring locations having BOD between 6-10 mg/l. Criteria for Priority 5 Monitoring locations having BOD between 3-6 mg/l. The locations exceeding desired water quality of 3mg/l BOD.
44
45 Constraints in Maintaining the Network Sustainability of infrastructure and maintenance of instruments and equipments. Financial as well as Manpower resources are inadequate and reducing due to policy shift. Travel to long distances for monitoring and preservation of samples in warm weather conditions adversely affect the results. Analysis results needs in-depth validation and repeated interaction with laboratories. Improper reporting of units, variation in analysis methods and quality control of chemicals are cause of concern. Lack of training for laboratory and field staff. Lack of software to analyse the data for trend analyses and data validation.
46 Limitations of Monitoring Programme Problems in data validation due to fluctuation in water quality. Flow in many rivers dwindles due to short period of monsoon. Environmental flows are not maintained, hence only urban wastewater flows in the rivers after major abstraction points. Removal of outliers during validation of data may devoid valuable information related to flushing of Industrial effluents responsible for episodal pollution and fish kill. Need of software for processing, validation/trend analyses and format data storage. Priorities for water quality management varies widely from developed countries to developing countries.

47
48

49 :27 th State Republic of India. :Geographical area of 53,483 km 2 :No District:13 :Population: (1.01 Crores) (2011 census) :0.84% population & 1.69% of land of India Uttarakhand State is well endowed with 86%: Mountainous area :65% Forest area :8 major rivers & More than 12,000 glaciers act as the lifeline for the entire hydrological system of Indo- Gangetic plain.
50 The state possesses a very assorted hydrogeological set-up and can be divided in two hydrogeological regimes as Gangatic Alluvial Plain and Himalayan Mountain Belt. Gangatic Alluvial Plain This zone is further divided into 3 parts as: (i) Axial Belt (Alluvial Plains): The aquifers of this zone are of unconfined to confined nature and in general ground water potential in this zone is good. (ii) Tarai: Several potential aquifers with good quality of ground water occur in this zone due to the presence of highly porous and permeable nature of the sedimentary derived constituting material. (iii) Bhabar: It has a potential hydrogeological unit but the ground water occurs at much deeper levels (> 100 m below ground level).
51 Himalayan Mountain Belt This regime constitutes a major part of whole geographical area of the state and can be studied in to following units: (i) Outer Himalaya (Siwalik Mountain Range): This part has potential ground water holding units with highly fractured or jointed rocks. (ii) Lesser Himalaya: Springs as a major source of groundwater occurs in this part. Many hand pumps have been installed satisfactorily and some tube wells in river valleys also. (iii) Central Himalaya: There are cold water and hot water springs (i.e. thermal springs) in this zone. (iv) Tethys Himalaya: Usually this is an appropriate zone for ground water development because of the presence of porous and permeable nature of the litho structures present in the zone.
52 A heavy rain fall occurs in monsoon season and snowfall during January to March. Approximately, 1606 mm annual rainfall in state is enough to accomplish the water demand of the state but unfortunately, 95% of the total precipitation flows as runoff due to high slopes of hills. However, the seventy years data from 1901 to 1970 of nine districts of the state for normal monthly and annual describes that maximum rainfall occurs in July and August and the annual precipitation varies from 1256 mm to 2426 mm in Haridwar and Pithoragarh district of state, respectively Presently, there is 23% less annual precipitation in Almora in comparison to its 53 years record while Manora peak of Nainital is receiving 16% less rainfall than last 39 years ( ).

53 In the beginning, peoples of hilly areas of the state utilized the water from the local sources fed by water from hilly slopes. Later on, they have developed the art that how to tap the water in hilly parts. Traditionally in hilly areas of the state naula, gul, dhara, lake, kund, khal, water mill (Gharat) are the main water harvesting structures and are also in trend in rural parts to fulfill the water needs of the local people
54 Uttarakhand is a hilly state, therefore there are several natural as well as manmade water sources. Rivers, lakes, springs or gadheras, tube wells, dug wells, Uttaranchal Koops, River Bank Filtration units etc. are the major drinking and irrigation water sources. Moreover, chal and khal are also supplying water for rural areas. Uttarakhand Jal Sansthan (UJS) which is a key water supply department of the state has rejuvenated 1804 khals from 2000 to Out of these, Pauri district has a maximum number of khals [27]. After, the study of year-wise discharge data of gadheras and springs of the state for the year 2005, 2006 and 2008, UJS has reported that Almora district of Kumaun region has maximum number of this type of water sources [28].
55 Uttarakhand is an origin place of several Indian rivers including glacial fed rivers, non-glacial fed rivers and rainfed rivers. Ganga, Yamuna, Ramganga, Kali, Koshi rivers and their tributries constitute surface water bodies. The National Commission for Integrated Water Resources Development (NCIWRD, 1999) [29] has estimated the basinwise average annual flow in Indian river systems as 1953 km 3 and the utilizable annual surface water of the country as 690 km 3. However, an attempt has been made to capture and present the best possible data available. The total catchment area of 12 major river basins of India is more than km 2. The total catchment area of these rivers is about 25.3 lakh km 2. Uttarakhand possess three main river basins as Bhagirathi (Alaknanda basin and Ganga basin), Yamuna (Tons basin) and Kali system.
56 In addition of these rivers, glaciers, lakes, numerous streams, springs etc. also contribute as a major part of surface water resources. A total 968 Himalayan glaciers are also important which have km 3 total ice volume and cover km 2 basin area and km 2 (i.e. 9.17%) glaciered area including Chorbani, Gangotri, Khatling, Nandadevi glaciers etc
57 The tals such as Bhimtal, Sat tal, etc. of Nainital district of Kumaun region are important sources for drinking and irrigation purposes. Besides this, Hemkund, Rupkund and Vasukital are some of the glacial lakes whereas Nachiketatal, Nainital, Dodital, Bhimtal and Naukuchiatal are the renowned lakes of middle Himalaya. The total high altitude wetlands area in the state is ha including 231 ha of high altitudinal lakes i.e. 0.22% of total wetland area for 118 lakes which covers <1% of total wetland area of the state [31]. The lakes and tals in upper parts and middle Himalaya form an important part of total drainage system.
58 The Ganga River has been declared as the "National River" of India in November, 2008 by Govt. of India. The Ganga basin is the biggest river basin in India which covers the whole of the state, and is bound in the north by the Himalayas and in the south by the Vindhyas. Yamuna River, which is also a major and holy river, is the largest tributaries of river Ganga. This river originates from Yamunotri Glacier of Uttarkashi district and merges with Ganga at Triveni Sangam in Allahabad of Uttar Pradesh
59
60

61 Deploying of framework for integrated river monitoring for simulating river water quality for estimation of Waste Load for major discharges in Upper Reaches (U/S of Haridwar) Developing the available mobile/gps/sensor based monitoring systems on test beds. Piloting rapid monitoring technology for appropriate pathogen indicator Assessment on identified river stretches Monitoring for assessment of Arsenic pathways in a selected basin stretch. River water quality assessment using Bio-monitoring and Toxicological Studies in selected stretches of River basin.