IWA_Pres_ PPT 1
|
|
|
- Ellen O’Brien’
- 5 years ago
- Views:
Transcription


 Ltd, South")


1 Pressure variation during peak demand periods A Miya Group Company SCOPE FOR PRESSURE MANAGEMENT IN SOUTH AFRICA R S Mckenzie and W Wegelin Presented by Ronnie McKenzie WRP (Pty) Ltd, South Africa Pressure variation during low demand periods Low Pressure Photo: Courtesy Ken Brothers Conventional Fixed Outlet PRV Pressure at Critical Point PRV Inlet Pressure reducing valve PRV Outlet Supply area Extremity/ Critical Point High Pressure Photo: Courtesy Ken Brothers IWA_Pres_ PPT 1


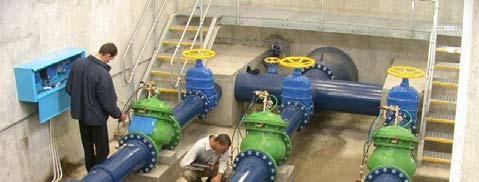
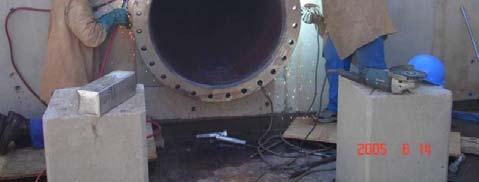
2 Time Modulated Pressure Control Pressure at C ritical Point Flow Modulated Pressure Control Pressure at Critical Point Time Modulated Controller Flow Modulated Controller PRV Inlet Pressure reducing valve PRV Outlet Supply area Extremity/ Critical Point PRV Inlet Water meter Pressure reducing valve PRV Outlet Supply area Extremity/ Critical Point Case Study 1 Khayelitsha Pressure Management Project Photo Courtesy Tertius de Jager: City of Cape Town Chamber details of 1065mm diameter installation Air High Pressure from Strainer Meter PRV Cape Town Bulk Water ± 6.5 m 1065 O Main 1065 O Main Low Pressure to Khayelitsha Fire Hydrant ± 13 m Dimensions Length = ± 13 m Width = ± 6.5 m Depth below ground = ± 3 m Height above ground = ± 4 m Total Volume of Excavation = 800 m 3 Equipment Pressure Reducing s: 3 x 350 mm diameter diaphragm actuated, hydraulically operated control valve Isolating s: 6 x 300mm Resilient Seal gate s Meters: 3 x 300 mm diameter Mechanical Turbine Flow Meters Strainers: 3 x 300 mm Cast Iron Y strainers IWA_Pres_ PPT 2
")


3 WRP WRP (Pty) (Pty) Ltd, Ltd, WRP (Pty) Ltd, 2003 RSW = 3.0 WRP (Pty) Ltd, 2003 Fixed Outlet Pressure Control Time Modulated Pressure Control IWA_Pres_ PPT 3


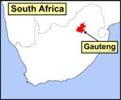


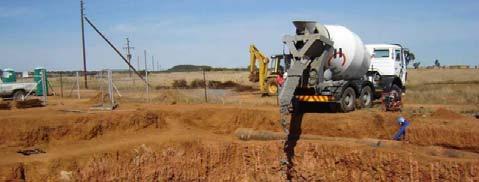
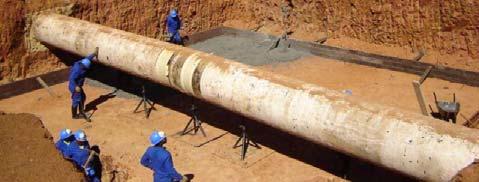

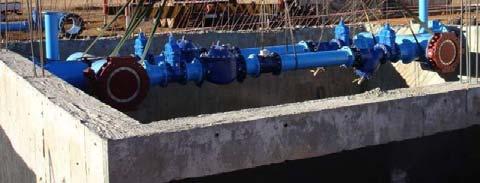
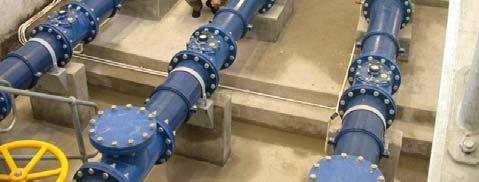
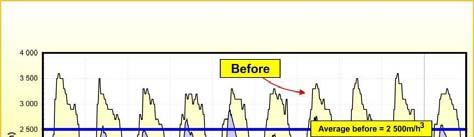
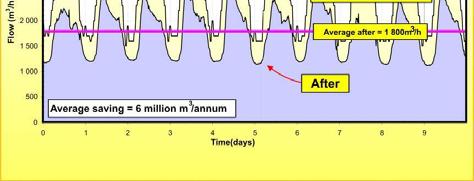
4 675 Ø ± 10 m B utterfly Flange Adaptor PRV Meter Abanded Flange Adaptor Strainer 675 Ø IWA Water Loss : 9 June 2010 Case Study 2 Sebokeng/Evaton Pressure Management Project Project Area Critical Point Characteristics ± residents EVATON ± connections Water of ±30m to ± 60m Installation Inlet Point Key Problems Taps and toilets leak due to high s Minimum night flow of m 3 /hr. Minimum sewer flow of 2 500m 3 /hr SEBOKENG Langerand ± 10m To Evaton From Rand Water From Rand Water Air 1000 Ø Main 1000 Ø Main Lower Pressure to Sebokeng & Evaton High Pressure from Rand Water During off-peak periods To Sebokeng Air Air From Rand Water 600 Ø 600 Ø From Rand Water IWA_Pres_ PPT 4


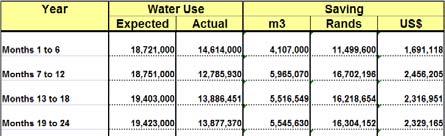
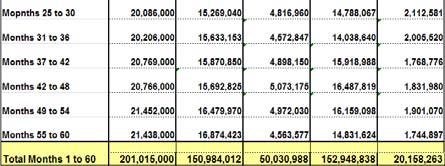
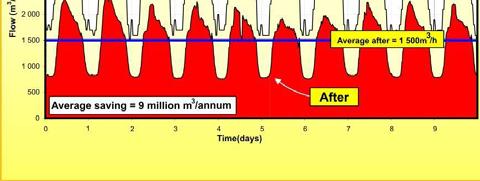
5 Consumption History for 5 Year Period Consumption History for 5 Year Period Savings Achieved for 5 Years Savings IWA_Pres_ PPT 5


")

 700")


6 ± 6..5 m ± 8.5 m IWA Water Loss : 9 June 2010 Hourly: Savings = 1000 m 3 /hr = 24 Ml/day Sebokeng Savings Installation is saving ± 10 million m3 per annum Saving is ± 27 Ml/day Sewer inflows reduced by ± 17 Ml/day Savings of ± R30 million per annum Olympic swimming pool every 2 hours Installation cost ± R5 million to construct Case Study 3 Mitchells Plain Pressure Management Project The Project Area Information and photographs courtesy Niel Meyer and City of Cape Town Chamber details for 1220 mm Ø by-pass chamber and PRV Chamber 1000 Mitchells Plain Pressure Management Project Flow Logging Results (January 2008 vs April 2009) High Pressure from Cape Town Bulk Water Low Pressure to Mandalay 900 ± 10.5 m 800 Air Strainer Meter 900 Ø Butterfly Butterfly 1220 Ø 1220 Ø Ø Flow (l/s) Average Flow Before = 631 l/s Average Flow After = 454 l/s Difference 177 l/s PRV Butterfly MNF Before =250 l/s Difference 110 l/s Air 900 Ø Low Pressure to Mitchell s Plain 100 MNF After = 140 l/s ± 21.5 m 0 Fri Sat Sun Mon Tue Flow Pattern - January 2008 Flow Pattern - April 2009 ( Savings ± 2.5 million m3/annum conservative estimate) IWA_Pres_ PPT 6


 Considerations when Implementing")

 R 1.")

 R 4.8 million/yr 2.")


7 Pipework in Main PRV chamber Cut-in on 1220mm Ø pipe Photo: Courtesy Niel Meyer Photo: Courtesy Niel Meyer Installed pipework for PRV chamber Photo: Courtesy Niel Meyer Summary of Savings from 4 Cape Town Installations Area Water Savings (million m 3 /yr) Cost to Construct (Rand) Value of m 3 (R/ year) Considerations when Implementing Pressure Management in SA Can significantly extend life of reticulation system Khayelitsha Mfuleni 9 million m 3 /yr 2.7 mill (2001) R 27 million/yr 0.4 million m 3 /yr 1.5 mill (2007) R 1.2 million/yr Large areas can be covered by single installation if topography is relatively flat. Hilly areas more difficult Gugulethu Mitchells Plain Total 1.6 million m 3 /yr 1.5 mill (2008) R 4.8 million/yr 2.4 million m 3 /yr 7.7 mill (2009) R 7.2 million/yr 13.4 mill m 3 /year 13.4 mill ± R40 million/yr ± $5 million/yr Areas with poor plumbing fittings often have high internal household leakage which can be reduced. Areas with old asbestos cement pipes can benefit significantly from lower peak s IWA_Pres_ PPT 7

 Water consumption in affluent areas can be lowered Pressure management is often one of the most important and cost effective WDM interventions that")


 R 5 mil (± $700 000) Unit capital cost Operating & Maintenance cost R 28 mil/ml (± $4 mil) (100%) R 20 / m3 (± $3/m3) (100%) R 180 000 mil/ml (±")
8 Considerations when Implementing Pressure Management in SA Areas with significant inefficient use can benefit Considerations when Implementing Pressure Management in SA Areas with 1 or 2 supply points ideal candidates Areas with excessive off-peak s can benefit Can often be used to eliminate intermittent supply Areas with plastic or asbestos pipes will be more sensitive to changes. (FAVAD) Water consumption in affluent areas can be lowered Pressure management is often one of the most important and cost effective WDM interventions that can be considered Sasol Synfuels, Secunda, South Africa barrels/day coal-to-fuels & chemicals facility Evaporation & losses 240 Ml/d Water intake 260 Ml/d Treatment & re-use 200 Ml/d Slide Courtesy Andries Meyer : Presented Turkey World Water Forum March 2009 Effluent discharge 20 Ml/d Cooling tower blow-down recovery plant: Softening, ultra-filtration membranes, reverseosmosis membranes, ion-exchange Capital cost: R 500 mil O&M cost: R 20 / m 3 Saving: 18 Ml/d Slide Courtesy Andries Meyer : Presented Turkey World Water Forum March 2009 Pressure management system on main Sebokeng water header No leaks fixed, only reduced during off-peak periods (same leaks - but lower volume) Comparison of Pressure Management with another WDM initiative in same supply area (Equivalent Water?) Direct operations saving (Sasol initiative) Catchment saving (Private initiative) Water savings from Vaal River 18 Ml/d 28 Ml/d Capital cost R 500 mil (± $70 mil) R 5 mil (± $ ) Unit capital cost Operating & Maintenance cost R 28 mil/ml (± $4 mil) (100%) R 20 / m3 (± $3/m3) (100%) R mil/ml (± $30 000) (0.6%) R 0.14 / m3 ($0.02/m3) (0.7%) Slide Courtesy Andries Meyer : Presented Turkey World Water Forum March 2009 Slide Courtesy Andries Meyer : Presented Turkey World Water Forum March 2009 IWA_Pres_ PPT 8


9 The End 72 There s no life without water! IWA_Pres_ PPT 9