Environmental Modelling for Air Pollution
|
|
|
- Brook Brooks
- 5 years ago
- Views:
Transcription

1 18 UNCONVENTIONAL ANNIVERSARY Environmental Modelling for Air Pollution Giuseppe Brusasca - ARIANET S.r.l. Milano 1
2 Numerical MODELS allow to represent on the screen the fate of pollutants released into the atmosphere by human activities (transport, heating, industry) and natural phenomena (volcanoes, fires, sand storms). Pollutants are transported by wind and dispersed by turbulence, chemically transformed, deposited by surface contact or removed by rainfall: the aim of the models is to reproduce this complex phenomenology to assess air quality levels that may be harmful to human health and ecosystems. 2
3 Local-scale simulations: Fundamental the description of orography and land-use. The peculiarities of Italian territory have led to the development of Lagrangian modeling that can simulate the dispersion under complex orography, calm condition, breeze, wind shear. 3

4 Air Quality around the Cement Factory in FUSHE KRUJE Impact study under difficult conditions... no meteorological data 4


5 Summarizing Rams Grid 1 Rams Grid 3 Rams Grid 2 Spray grid 5

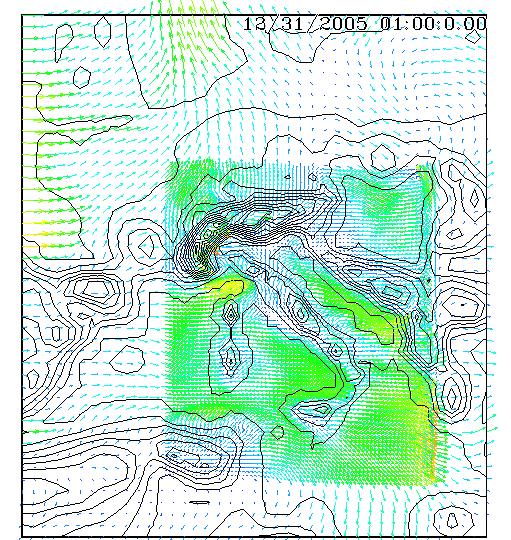
6 Spray example: Fushe Krushe 31/12/2005 wind particles concentrations 6

 baseline 163 47 93 400 future 375 102 208")
7 Results: max hourly concentrations, NO x, mg/m 3 baseline future max=158 mg/m 3 max=478 mg/m 3 Fushe Krushe Krushe Burizane Limit (NO 2 ) baseline future


8 Micropollutants: IPA - Benzo (a) pyrene Heavy metals Dioxins Impact assessment on health Benzo[a]pyrene Cromo Diossine 8
9 Regional scale simulations: Eulerian Grid Model (Chemical Transport Model) The description of atmospheric chemistry is fundamental. The simulation is made possible by the knowledge of the synoptic meteorology, the availability of complete emission inventories (anthropic and natural) and the conditions at the boundaries of the calculation domain. 9

10 Emission input NO daily ciyle 10
 6 Oct 1999 11")
11 Meteorological model Wind at 2000 m a.s.l. & cloud water (0.01 g/kg isosurface) 6 Oct
 5 ppb")
12 Nesting into EMEP European model EMEP boundary conditions & FARM model output Example: SO 2 (21-22 Dec 1999) 5 ppb isosurface 12


13 NO 2 concentrations computed by FARM CTM Ground 1 and 10 ppb isosurfaces 13

14 SO 2 concentrations computed by FARM CTM 1 and 10 ppb isosurfaces 14

15 PM 10 concentrations computed by FARM CTM Daily cycle Isosurfaces at 5,10,20 ug/m3 15

16 Trisaia campaign: Saharan contribution to PM10 Contour conditions - hour by hour 16
17 Trisaia campaign: Saharan contribution to PM10 Contour conditions and concentrations within the calculation domain - Hour by hour (isosurface at 120 mg/m 3 ) 17

18 Trisaia campaign: Saharan contribution to PM10 Concentrations at ground - Hour by hour 18


19 Emission input NO daily cycle Dominio regionale (4 km) Napoli & Caserta (1 km) 19
20 NO 2 Ground concentretion daily cycle Regional scale, 4 km resolution... 20
21 NO 2 Ground concentretion daily cycle zoom at 1 km 21

22 NO 2 Ground concentretion daily cycle zoom at 1 km 22


23 NO 2 μg m -3 Road traffic and the port of Naples dominate Heating emissions, other industries follow The incinerator has very small impact Total 23


 https://atmosphere.copernicus.")


24 Air quality forecasting systems Global Scale: Copernicus provides information on the transport of pollutants worldwide (eg Saharan sands, ozone, etc.) European scale: import-export models between nations and countries Nazional scale : QualeAria and ENEA Regional Scale: More than half of the ARPA have Forecasting Systems based on Regional Inventories Microscala : Elise, Torino 24
25 Microscale Simulations: The presence of obstacles is fundamental. Using lagrangian microscale modeling for pollution estimation with great detail Very complex issues: Accidental releases of toxic or odorous substances in industrial or urban environments 25


26 What happens, if individual buildings are not explicitly resolved in micro-scale dispersion modeling? without with individual buildings wind field hazmat dispersion 26


27 Milan area of 2400 x 2400 m2 Hourly forecasts NO2 horizontal resolution 3m PMSS Modeling System 27
28 Test Emissione di Cloro Jack Rabbit II - microscala 28
29 Test Emissione di Cloro Jack Rabbit II multi-scala 29
 Images every 1 ground level concentrations")
30 Industrial accidental emission neutral gas meteorology F1 (stable 1 m/s close to the ground) Images every 1 ground level concentrations 30
")
31 Industrial accidental emission dense gas meteorology F1 Images every 1 ground level concentrations Dense gas (ex: Chlorine gas + aerosol) 31

32 Ground level concentrations due to accidental emissions in an industrial area MicroSpray model: 1-min averages, from 7:51 to 8:45 local time 32

33 3D isoconcentrations due to emissions in an industrial area 33


34 Open issues: 'instantaneous' concentrations Simulation in the wind tunnel of 'identical' releases 34

35 Simulation by LES Action COST ES1006 FMI courtesy 35

36 Thank you for your attention 36