SWAT Modeling of Critical Source Area for Runoff and Phosphorus Losses. Lake Champlain Basin, VT
|
|
|
- Willis Wilcox
- 5 years ago
- Views:
Transcription
1 SWAT Modeling of Critical Source Area for Runoff and Phosphorus Losses Lake Champlain Basin, VT Lula Ghebremichael Mary Watzin Tamie Veith th International SWAT Conference August 5-7, Boulder, Colorado.


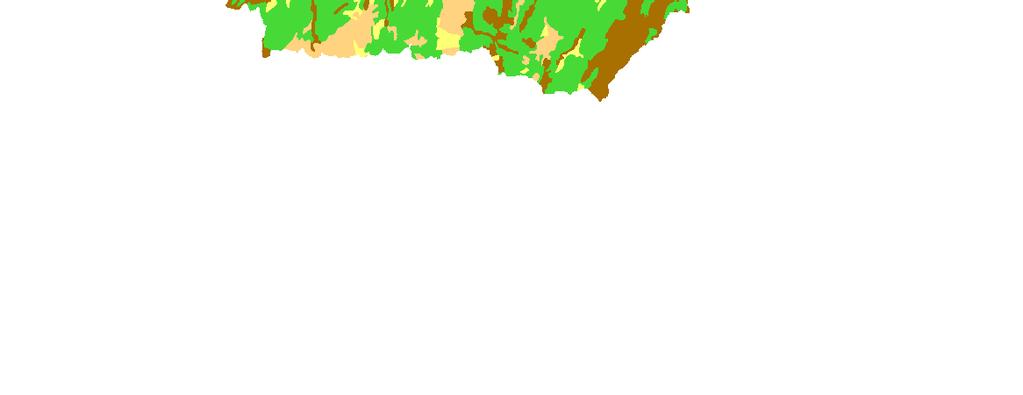
2 Lake Champlain USA Lake area = 1,130 km 2 Basin area = 19 X Lake surface area 60% Forest, 28% Agriculture, 5% Urban, 7% Water


3 Copyright WebLinks, Inc. dba LinkVermont WebLinks, Inc. dba LinkVermont
 inputs lake s ecology recreational/enjoyment")
4 Lake Water Quality Concerns Eutrophication caused by excess Phosphorus (P) inputs lake s ecology recreational/enjoyment economy


5 2008 State of the Lake: Phosphorus Trend Mississquoi Bay P concentrations status and trends Source: LCBP 2008 State Of the Lake Mississquoi Bay after rain
6 Actions Taken, Progress, Challenges Huge investments and collaborations (VT, NY, Quebec) Millions in state & federal funds since 2001 Monitoring stations established TMDL-based P reduction agreement Corrective measures taken to reduce P loadings P from point sources easily targeted (upgrading/new WWT) P loads successfully reduced P from nonpoint sources: challenging Measures taken so far are based on landowner voluntary participation P reduction goals from these not achieved
7 Vermont Legislators Passed Act 130 (2008) Systematic- and scientific-based method to identify non-point source P Act 130 requires the Agency of Natural Resources to develop a method of Accounting for Phosphorus Reductions and Identifying Critical Source Areas for nonpoint source pollution in each subwatershed of the Lake Champlain Basin Future implementation of corrective measures to be based on their potential to improve water quality (not on applicant-driven)

")


8 Part of Our Project... Model-Based Approach ~ Soil and Water Assessment Tool (SWAT) Identification of Critical Source Area for P loss Quantitative estimation of P losses from different source areas Assessment of benefits of management strategies
 High P loss per unit")
9 Study Watershed Mississquoi Bay Lake Champlain Quebec, Canada New York State Vermont State Rock River Watershed Rock River Watershed ~ 71 km 2 area (54% Agriculture, 36% Forest, 4% urban) High P loss per unit area


10 SWAT Application in Rock River Watershed Model Calibration and Validation: using data at the outlet of the watershed for stream flow, sediment, and P

11 SWAT Simulation ---Stream flow Stream flow m 3 /s /1/2001 2/1/2002 6/1/2002 Obs Sim NS= 0.6 NS= 0.6 Calibration Validation 10/1/2002 2/1/2003 6/1/ /1/2003 2/1/2004 6/1/ /1/2004 2/1/2005 6/1/ /1/2005 2/1/2006 6/1/ /1/2006 2/1/2007 6/1/ /1/2007 Model predicted tile drainage flow mainly during March and April. Timing Observation? Magnitudes of tile drainage flow not verified (no data)

12 SWAT Simulation ---Sediment Sediment concentration, mg/l NS= 0.7 Obs Sim NS= 0.6 Calibration Validation Oct_01 Jan_02 Apr_02 Jul_02 Oct_02 Jan_03 Mar_03 Jul_03 Oct_03 Jan_04 Apr_04 Jul_04 Oct-04 Jan-05 Apr-05 Jul-05 Oct-05 Jan-06 Apr-06 Jul-06 Oct-06 Jan-07 Apr-07 Jul-07
 Sediment capture")
13 Sediment Calibration PRF & ADJ_PKR Peak flow rate adjustment factor for sediment routing (main channel & tributary channels) Sediment capture system

14 SWAT Simulation ---Phosphorus Oct_01 Jan_02 Apr_02 Jul_02 Oct_02 Jan_03 Mar_03 Jul_03 Oct_03 Jan_04 Apr_04 Jul_04 Oct-04 Jan-05 Apr-05 Jul-05 Oct-05 Jan-06 Apr-06 Jul-06 Oct-06 Jan-07 Apr-07 Jul-07 Oct-07 Total Phosphorus, Kg NS= 0.7 NS= 0.6 Sim Obs Calibration Validation

15 Runoff Sources Areas
 soil, slope, landcover, mang t, soil-p, location")
16 Phosphorus Loss Source Areas Characteristics of CSA Climate Transport factors (runoff, sediment) soil, slope, landcover, mang t, soil-p, location Field-based
17 For Decision Making T. Phosphorus loss rate kg/ha 0% 20% 40% 60% 80% 100% % of TP Loss 100% 80% 60% 40% 20% 0% 0% 20% 40% 60% 80% 100% % of Watershed Area Threshold for targeting

18 For Planning Characteristics of 24% of land use area in the Rock River Watershed identified as having high sediment and total P loss rates. Land use Soil hydrologic group Slope Group, % % Area % of Sediment load Corn D >15, 8-15, 3-8, C >15, 8-15, B >15, 8-15, A >15, 8-15, Developed D >15, 8-15, C >15, B 8-15, A Barnyard D >15, 8-15, C >15, 8-15, A Total % of total P load
 In the study watershed (insights to other similar watersheds) Next steps: Assessment of corrective management practices efficiencies Uncertainty to")
19 Conclusions Model-based tool, SWAT, provides scientific-based, defensible predictions Identification of high risk landscape areas for targeting (with limited resources) In the study watershed (insights to other similar watersheds) Next steps: Assessment of corrective management practices efficiencies Uncertainty to predictions
20 Thank You Questions?