LONG-TERM Animas River GROUNDWATER LEVEL MONITORING after the Gold King Mine 2015 mine-water release
|
|
|
- Tamsin Wade
- 5 years ago
- Views:
Transcription
1 LONG-TERM Animas River GROUNDWATER LEVEL MONITORING after the Gold King Mine 2015 mine-water release Ethan Mamer Talon Newton Stacy Timmons Cathryn Pokorny NM Bureau of Geology and Mineral Resources A Division of NM Tech With funding from NM Environment Department
2 Animas River: Long term monitoring groundwater Element 6 of the NMEDs Long-term monitoring plan Funded by U.S. EPA Clean Water Act, Section 106 through NMED Goals: Data collection / interpretation to evaluate groundwatersurface water interaction Describe annual and seasonal fluctuations Determine any at risk locations where river may be losing water to aquifer


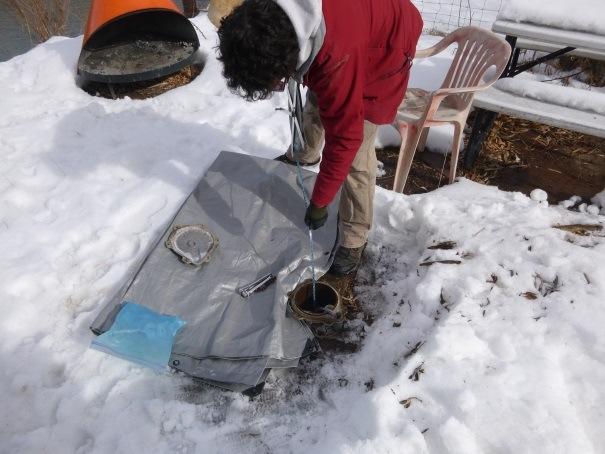
3 August 17th -20th, 2015 We initiate groundwater monitoring network with ~120 wells NMBGMR, USGS, NMOSE collaboration Two wells instrumented with pressure transducers Initial response to GKM Spill
 Prior to irrigation season (late March) Between 59 and 74 wells measured during each seasonal transition.")
4 Groundwater Monitoring Network: Manual measurements Network measured 4 times a year Measurement timing intended to capture hydraulically significant periods in the groundwater/ surface water system Base flow in river (late January) Prior to irrigation season (late March) Between 59 and 74 wells measured during each seasonal transition. USGS WL steel tape protocol 8 measurement periods August 15 June 17 ~ 640 WL measurements Peak river flow (early June) End of irrigation season (October)

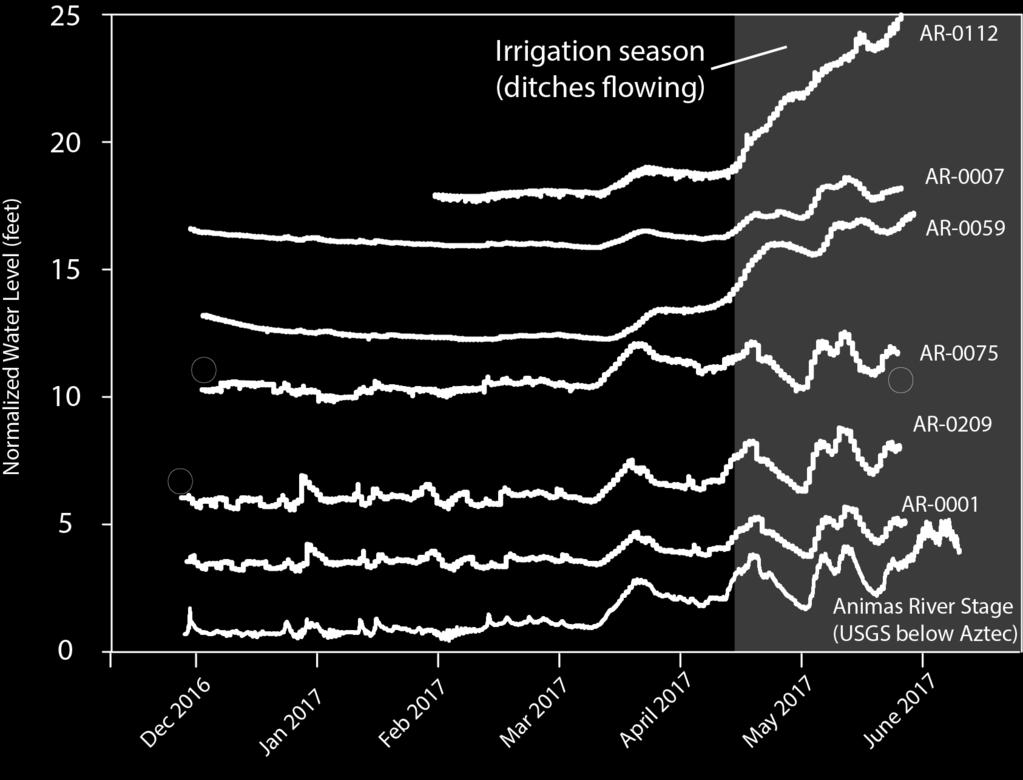
5 Animas River stage: Manual measurement periods Baseflow Beginning of Irrigation Peak river flow End of irrigation


6


7 Gaining stream Water table is HIGHER than the river, and water flows into the river from the surrounding aquifer. Losing stream Water table is LOWER than the river, and water infiltrates into the aquifer from the river.

8 Reaches where water table gradient has been found to be flat or slightly losing.
9 Water table compared to river stage March wells with water level below river stage Average of 1.8 ft below river Average of 405 ft from river October wells slightly below modeled river stage 0.46 below river stage, 101 ft from river 0.15 below river stage, 387 ft from river


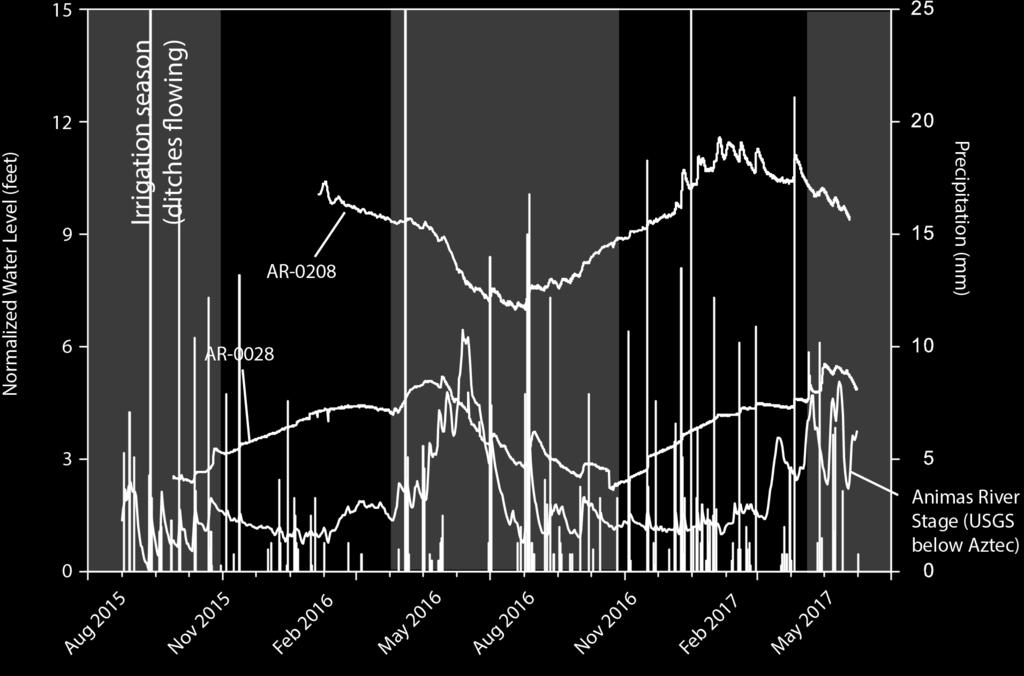
10 Surveying River Stage Measured the elevation of the river surface from 9 of the wells that had WL with low or negative gradients River elevations similar to those modeled with gauging stations and LiDAR. Still need to dig into this data and better model river stage through time.


11 Groundwater Monitoring Network: Continuous data loggers 24 wells instrumented with pressure transducers 2 installed September 15 2 installed January 16 1 installed in June installed late 16/ early 17 Monitor water levels and temperature every hour 13 also monitor the specific conductance 5 barometer loggers installed along Animas reach for barometric corrections

12 Pressure Transducer Records

13 Baseflow and River Connection

14 Baseflow and River Connection On average only 215 ft from river On average water table is ~12 ft bgs Small seasonal fluctuation: avg ~3.8 ft
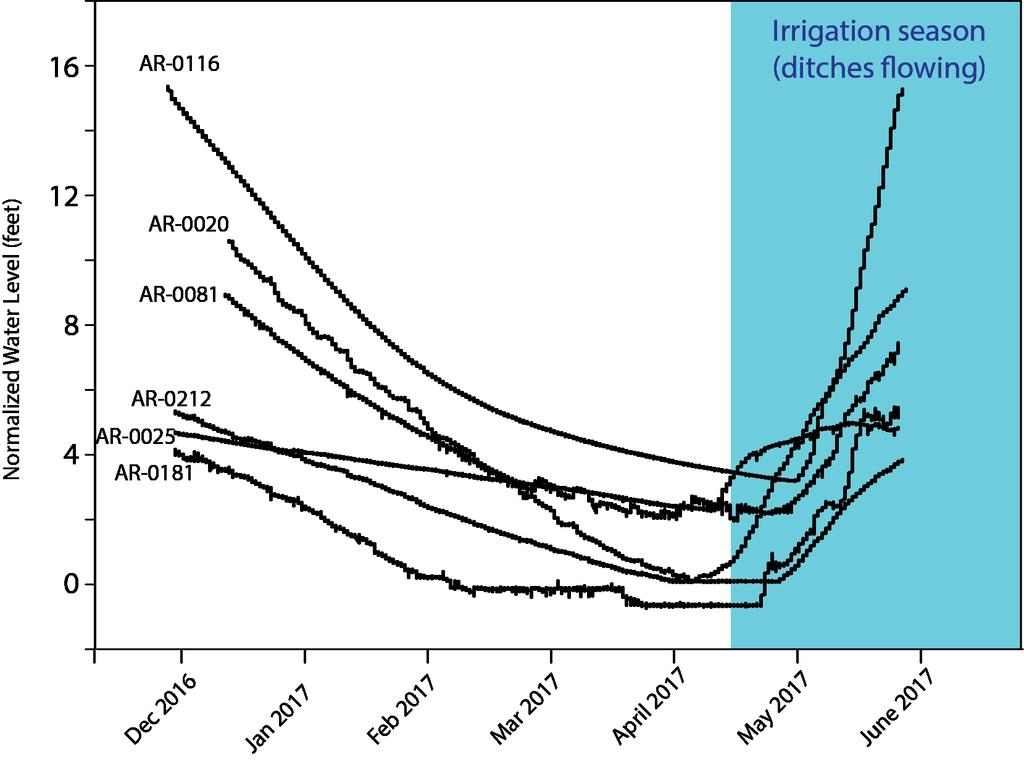

15 Irrigation controlled

16 Irrigation controlled Much farther from river: avg 2,050 ft Deeper water table Large seasonal fluctuation: avg 11.3 ft

17 Winter Recovery

18 Winter Recovery Farther from river: avg 1,530 ft Small seasonal fluctuation: avg 2.4 ft Some summer decline is related to pumping; in and/or near the well.


19 Summer Trends: 53 wells Winter Trend: 7 wells Summer Low June High Winter High June or October peak largely impacted by distance from river. October High Wells closer to river more closely follow the river stage (avg: ~680 ft) Wells farther from river show considerable lag, and may be more heavily impacted by flow in the irrigation network (avg: 1,930 ft)


20 Summer Trends: 53 wells Winter Trend: 7 wells Summer Low June High Winter High Matches well with baseflow and river Matches well with winter recovery June or October peak largely impacted by distance from river. October High Matches well with Irrigation Controlled Wells closer to river more closely follow the river stage (avg: ~680 ft) Wells farther from river show considerable lag, and may be more heavily impacted by flow in the irrigation network (avg: 1,930 ft)

21 River Connection Irrigation Controlled Cedar Hill Winter Recovery Inca Aztec
22 Most of Animas shows gaining conditions. The irrigation ditch water is feeding the shallow water table, recharging groundwater levels during the irrigation season. Seasonal fluctuations in river stage and water levels are enough to reverse groundwater/ surface water flow direction. The river and the groundwater in the valley are hydrologically connected.


23 Acknowledgments NM ENVIRONMENT DEPARTMENT: Dennis McQuillan and Diane Agnew NMBGMR: Trevor Kludt, Scott Christenson, Brigitte Felix, and Geoff Rawling USGS NM WATER SCIENCE CENTER: Jesse Driscoll, Nicole Thomas, Lauren Sherson, and Amy Gallanter NMOSE: Doug Rappuhn and Rob Pine