Long-term water level changes in closed-basin lakes of the Canadian prairies and the role of groundwater
|
|
|
- Griselda Benson
- 5 years ago
- Views:
Transcription

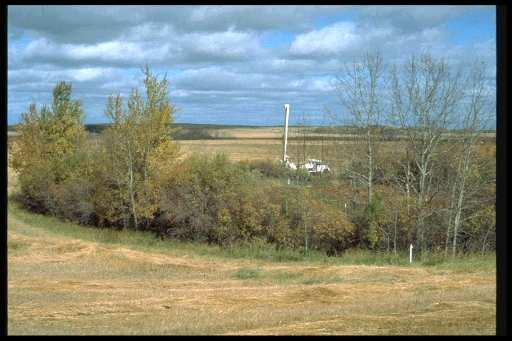
1 Long-term water level changes in closed-basin lakes of the Canadian prairies and the role of groundwater Garth van der Kamp, Environment Canada, Saskatoon Masaki Hayashi, Dwayne Keir, Alan Barr, Little Fish Lake, AB, May 2005

2 Prairie lakes : The water levels in Canadian prairie lakes have been falling while nearby Devil s Lake (ND) is rising since 1940: 4 me te rs Re d b e r r y L a k e L e v e l C h a n g e De v ils Big Q u ill Ke n o se e Ye ars
3 Five lakes in eastern SK Summer 2007 levels (provisional)


4 Flooding at Fishing Lake SK, summer 2007


5 Long-term fluctuations of prairie climate based on tree-rings (Sauchyn et al)
 St Denis NWA North Dakota [USGS] 561.00 560.00 559.00 558.00 557.00 DRY Wetland P1 The USGS Cottonwood County wetland research site, near Devils Lake.")
6 Wetlands, land-use change and climate variability Water Depths St Denis # Pond # 90 St Denis NWA, Oct Depth (cm) St Denis NWA North Dakota [USGS] DRY Wetland P1 The USGS Cottonwood County wetland research site, near Devils Lake. There has been no landuse change at this site. Change to wet conditions in Jan-79 Jan-80 Jan-81 Jan-82 Jan-83 Jan-84 Jan-85 Jan-86 Jan-87 Jan-88 Jan-89 Jan-90 Jan-91 Jan-92 Jan-93 Jan-94 Jan-95 Jan-96 Jan-97 Jan-98 Jan-99 Jan-00 Jan-01 Jan-02 Jan-03 Jan-04 Jan-05 Jan-06
7 Shallow observation wells in SK water level changes Water-table drawdown during the drought averaged about 0.5 m, corresponding to ~ 150 mm groundwater storage depletion Watere level change (m) ATTON 's L k C ON Q 5 01 D U C K LAKE 1 FOR GET MEL FOR T SIMPSON 1 3 STEN EN SW AN SON VER LO Ave ra g e Jan- 60 Jan- 65 Jan- 70 Jan- 75 Jan- 80 Jan- 85 Jan- 90 Jan- 95 Jan- 00 Jan- 05 Jan- 10 Years

8

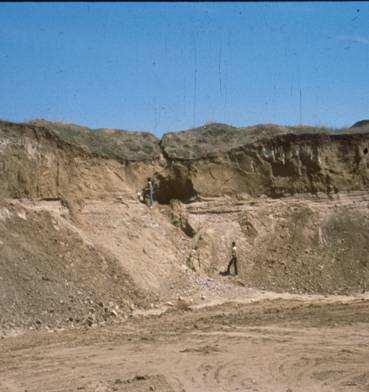
9 Clay-rich glacial till plus sand/gravel aquifers
10 Hydraulic Conductivity (K) of Glacial Till St. Denis National Wildlife Area, Saskatchewan (m/yr) 5 weathered till sand depth (m) piezometer unweathered till 20 soil core 25 Original data: J. Hydrol. 207:42; Hydrol. Process. 18:2011
11 Lissey, 1971 Toth, 1963 Lissey, 1971
12 Revised Model of Wetland Complex (van der Kamp & Hayashi, Hydrogeology Journal. 17: ) recharge flow through discharge aquifer regional recharge salinity Shallow groundwater exchange with riparian zone. Deeper flow in low-permeability till is very small. Inter-till aquifer may provide connection. Salts accumulate under discharge wetland.
13 Water Depth in St. Denis Wetlands S109, 2400 m 2 pond depth (cm) S50, m No change over winter
 compared with Alberta")
 And Wet Year 2005 [Zhan")
14 Saskatchewan BERMS Forest flux sites (Old Aspen OA, Old Black Spruce - OBS and Old Jack Pine OJP) compared with Alberta Grassland site (ABG): Comparison of Monthly E,α and G s Between Dry year (2003 for SK Sites, 2001 for ABG) And Wet Year 2005 [Zhan et al. in prep]
15 Overview of the Weighing Lysimeter Instrumentation Fundamentals Change of mechanical surface loading is instantaneously transmitted to deep saturated formations resulting in change of pore water pressure; Piezometers in saturated formations can therefore detect pore pressure changes due to hydrological processes such as: Snow accumulation; Conceptual Sketch of Piezometric Weighing Lysimeter Installation Rainfall; Evapotranspiration tens of meters p Aquitard - high compressibility - lowpermeability Pressure Transducer Van der Kamp et al, 2003 t
16 Regional water storage changes in southern Saskatchewan: - Average of 4 Geological Weighing Lysimeter wells, - Average of 9 water table wells, multiplied by 0.3 for specific yield A verage - Geological weighing lysim eter wells (m ) A verage - shallow water table wells (m) Water storage change (m) Years
17 0.300 Regional water storage changes in southern Saskatchewan: - GRACE for southern Saskatchewan [provided by Yirdaw and Snelgrove] - Average of Geological Weighing Lysimeter wells - Average of water table wells A verage - Geological weighing lysim eter wells (m ) GRA C E (m) A verage - shallow water table wells (m) Water storage change (m) Years
 ADA")
18 Assiniboine Delta Aquifer (ADA) ADA


19 ADA Data Measured Head Dec/06 Example of Interpolated Groundwater Head Assinboine River - observation wells o - rain gauges Souris River Area 4000 km 2

20 ParFlow-CLM Modelling Precipitation Moisture/heat flux Evapotranspiration Infiltration/ Seepage

21 Modelling Results ADA Spatial Average Simulation
22 Infiltration Capacity of the Top Soil Measured by single-ring infiltrometers Average, standard deviation, and # of samples Grassed Cultivated Avg. SD # Avg SD # Unfrozen Frozen unit : mm/hour