Regenerative Energy Conversion in Germany
|
|
|
- Maria Garrett
- 5 years ago
- Views:
Transcription
1 Regenerative Energy Conversion in Germany Regenerative Energy Conversion in Germany Andreas Binder Elektrische TU Darmstadt 0


2 Overview Motivation Electrical energy situation in Germany Regenerative energy conversion Integration of large wind power plants Summary 1

3 Protect our earth it is our home - Impact of the use of energy on climatic change: - Here the impact of electric energy conversion is considered. - A reduction of carbon dioxide production is necessary. - Germany can contribute. - The influence of regenerative energy conversion is discussed. Our climate Use of energy 2
4 Increase of electrical energy in the world Asia and America will determine mainly the world energy growth in the next years! Electrical Energy Generation (TWh) W-Europe E-Europe N-America C-/S-America Near East Asia Africa

5 Long term vision of primary energy World wide trend: Increase of regenerative energy contribution to power supply, especially solar, bio mass, but also wind and hydro. Source: WEC 4
6 Overview Motivation Electrical energy situation in Germany Regenerative energy conversion Integration of large wind power plants Summary 5
7 Situation in Germany Electric energy conversion in Germany: - Per year need for electric energy of ca. 510 TWh, with a 1 2% annual increase. - For these 510 TWh (100%) we need 175 % of primary energy (coal, nuclear power, natural gas) in order to compensate the losses in the power plants and transmission. - About 75% of primary energy is imported. - The primary energy for electrical energy conversion is 38 % of total primary energy in Germany (which is PJ). - Electric energy conversion in power plants causes ca. 30 % of the total German CO 2 -emission. 6

 A Natural")


8 Electrical energy conversion Energy mix (Germany 2006) A Natural gas 10% Wind 5% Regenerativ 11,9 % Black coal 27% Hydro 3,5% Bio mass 3,1% PV 0,3% Nuclear 24,1% Brown coal 27% 7
9 CO 2 -Emissions due to electrical power generation CO 2 Emissions in different types of power plants kg CO 2 per kwh 0,5 1 0,75 0,25 0 0,96 Lignite Fossil energy Regenerative energy Nuclear energy 0,78 Black coal 0,76 Oil 0,35 Gas Emissions in kg CO 2 /kwh Operation Fuel supply Construction 0,2 Solar Wind (Photovoltaic) 0,020 0,004 0,025 Hydro Uranium Source: Siemens 8
10 Electrical power generation (D) -Trend Electrical power generation from natural gas and renewables (wind, bio mass) will increase. Nuclear power will be stopped (political will) Electrical Expected Power Trend Generation (TWh) - Germany Others Renewables Hydro Nuclear Gas Oil Coal 9
11 Overview Motivation Electrical energy situation in Germany Regenerative energy conversion Integration of large wind power plants Summary 10
12 Alternative energy conversion for reduction of CO 2 - Wind energy off-shore : Efficiency ca. 45%, ca full load hours - Hydro power: Efficiency ca. 80%, ca full load hours - Upgrading, refurbishment - Additional pump storage plants in neighbor countries - Bio mass: Efficiency 30%, Organic fuel burning is neutral in CO 2 - Photo voltaic: Efficiency 10%, ca. 800 full load hours - Geothermal energy: Aim: 3 5 km deep bore holes - Still mainly research: - Fuel cell power plants: Gas turbine combined with fuel cell - Aimed efficiency: 70% (Prototype ca. 300 kw) - Solid oxide fuel cell (SOFC) uses hydrogen from reformed natural gas, waste gas is afterwards burnt in gas turbine - Fusion energy: Heavy water protons (Deuterium) are fusioned to Helium, thus producing fast neutrons (= kinetic energy) - Test facility 500 MW ITER under construction in Cadarache/France - 10 Billion Euros budget: Germany contributes! A 11

13 Regenerative electrical power generation (Germany 2006) Wind 30.5 TWh 5.0% Hydro 21.6 TWh 3.5% without pump storage Bio mass 19.1 TWh 3.1% incl. waste gases Solar power 2.0 TWh 0.3% 73.2 TWh 11.9% Brutto-Consumption of electrical power 2006: TWh 100% = Consumption + Power station supply + pump storage operation 92% 6.5% 1.5% Electrical power generation 2006: = Utilities + Private + Industry TWh TWh 12
14 Regenerative Energy Conversion in Germany Wind power in Germany 30.5 TWh 5.0% 13
15 Wind turbines - ratings A - Rotor blades are pitched to adjust wind power - Variable speed operation to extract maximum wind power at variable wind velocity - Pitch 90 at storm P = 1,5 MW D = 77 m P = 2,0 MW D = 80 m Rated power P P = 2,7 MW D = 84 m Rotor diameter D P = 3,0 MW D = 90 m P = 3,6 MW P = 4,5 MW D = 104 m P = 5,0 MW D = 125 m 14
16 Modern wind turbine data - Three-blade rotors, pitching for optimum power operation at variable wind speed, full load operation h/y, % efficiency -5 MW ratingis developed as standard size for the next years! P / MW D R / m n R / min -1 Generator v Rmax /km/h v, v N /m/s Gear i DS-ASM , DS-ASM , 15 ca DS-ASM , PM-Syn Gearless DS-ASM , 14 ca ca Syn-G SL ca Gearless DS-ASM , DS-ASM: Doubly fed induction generator: Rotor fed via slip ring set from inverter (inverter rating 30%) PM-Syn / Syn-G SL: Synchronous generators: Permanent magnet & electrical excitation, gearless or low transfer ratio < 10, 100% inverter rating 15

17 Geared wind turbines - Example: 5 MW Wind rotor: 110 t Rotor blade Rotor spider Turbine shaft Generator-Cable to the grid, threephase 690 V Transformer for increase of voltage 690V/20 kv Nacelle: 240 t Three-stage gear 1:100 Generator shaft + Coupling Doubly-fed induction generator, needs slip rings Rotor feeding inverter, 1/3 of generator rating Mast Source: Winergy, Germany 16
18 Regenerative Energy Conversion in Germany Hydro power in Germany 21.6 TWh 3.5% 17
19 Large Hydro Power - Equivalent full load hours typically h/y, efficiency ~ 80% -In Germany: Limited potential for new plants - Focus on: - Refurbishment Increase of efficiency - Increase of power rating in existing pump storage plants in neighboring countries Needed a) to equalize wind power, b) grid stabilization in a liberal market Examples: - Kopswerk (Austria): MW (= + 100%), co-financed by EnBW - Vianden/Luxembourg (additional 10th generator) Pump storage Geesthacht near Hamburg Francis-Turbines 18

20 Pump storage power plant Goldisthal/Thuringia (D) Slip-rings for inverter feeding Doubly-fed induction generator pump-turbine Innovation: Speed variable pump storage operation: Two of 4 turbines operate at variable speed with data: 2 x 340 MVA, /min, 18 poles, 50 Hz Asynchronous doubly-fed generators, rotor fed via cyclo-converter - Improved efficiency - Enhanced operation Source: VA Tech Hydro 19
21 Regenerative Energy Conversion in Germany Bio mass in Germany 19.1 TWh 3.1% 20
22 Bio mass power plants - Bio mass: Burning of organic material - wood, - gas from garbage deposits Produced CO 2 equals consumed CO 2 during growth of the plants - CO 2 -neutral - Problems: Deposits and corrosion in the burning chamber Examples: Landesbergen (D) (2003): 20 MW el. power, 31% efficiency, wood Düsseldorf (D): (08/2007): 25 GWh/a el. Power, 78 GWh/a heating - Research: Wood gasification, burnt in combined cycle power plants: expected efficiency: 40% mixed with natural gas: 60% 21
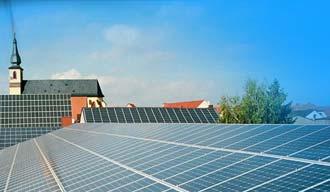
23 Regenerative Energy Conversion in Germany Solar power in Germany (Photo voltaic) 2.0 TWh 0.3% 22

: totally 32 MW installed power!")
24 Solar power - Photovoltaic Basic principle of photo diode as electric DC voltage source Vision of future large array photo-voltaic power plant in southern regions Germany: 2006: MW new installed photovoltaic power (private & utilities) - Totally installed power: 2.6 GW; delivered energy to the grid: 2 TWh - Island-use (e.g. traffic systems): totally 32 MW installed power! 23
: 12 MW peak power - Solar park Pocking (Bavaria): 10 MW peak - Solar park Leipziger Land (Saxonia): 5 MW peak - BGZ Solarpark Passauer Land")
25 Photovoltaic power plants (D) Germany: 2006: Over 30% thin layer solar cells in use in new solar parks! Examples: - Solar park Gut Erlasee: (Arnstein/Bavaria): 12 MW peak power - Solar park Pocking (Bavaria): 10 MW peak - Solar park Leipziger Land (Saxonia): 5 MW peak - BGZ Solarpark Passauer Land (Bavaria): 3.3 MW - Bürgersolarpark Fünfstetten: 1.7 MW peak - Under construction: till 2009 Solar park Waldpolenz (Leipzig): 40 MW pk solar modules covered area: 220 hektar 40 Million kwh/a tons CO 2 saved per year 24

26 Photovoltaic power generation (D) Solar park Leipziger Land (Saxonia): 5 MW peak Source: GEOSOL Germany: Since 2006: Largest installed photovoltaic peak power in the world (2.6 GW) Second: Japan - Installed photovoltaic power per capita: 150% of Japan 25
27 Regenerative Energy Conversion in Germany Geothermal power in Germany First projects 26


28 Geothermal potential in Germany Per 100 m depth plus 3 C rock temperature 120 C 1000 m depth 3000 m depth 22 C 174 C 54 C 27
: high steam")
29 Electrical energy conversion with geothermal power plants - 3 km deep bore hole: ca. 120 C hot water evaporates at the surface: but steam pressure too low for turbine operation - Kalina-cycle: Heat exchanger: Water-Ammoniac-mixture (low boiling point: ammoniac: -33 C): high steam pressure sufficient for turbine - Closed cycle between heat exchanger and cooling tower - Project Munich-Unterhaching (2007): 3300 m, 122 C, 150 l/s, 3,3 MW electrical power - In addition: Cogeneration of heat - central heating for persons, 25 l/s tons CO 2 are avoided per year Source: Siemens 28
 cavities are produced in the rock bed. Here the water can circulate. 4 6 km deep holes are needed.")
30 STILL IN RESEARCH: Hot Dry Rock - Cycle When no hydrothermal rock bed is found: Hot Dry Rock-Cycle: Injection of surface water to produce steam Between injection hole and extraction hole an artificial hydro circulation is installed Via hydraulic stimulation (= high pressure water injection) cavities are produced in the rock bed. Here the water can circulate. 4 6 km deep holes are needed. Test drillings have been done (e.g. near Speyer in the Rhine valley) Deep drilling is expensive! Source: TU Darmstadt, Prof. Katzenbach 29
31 Overview Motivation Electrical energy situation in Germany Regenerative energy conversion Integration of large wind power plants Summary 30
32 German high voltage grid 3-phase, AC: 380 kv 220 kv Single phase, HV DC Connection sub-sea to the Baltic 31


33 Regenerative and small power energy sources decentralized grid Partially dual directed energy flow! Integration of -Wind farms -Fuel cell plants - Photo-voltaic - Small bio mass 32

34 Integration of big wind power flow Installed wind power, Europe, 2004: 34.2 GW DK 9,1% Übrige GB NL I 3,2% E 24,3% In Germany: D 48,5% 8.3 GW 3.1 GW 16.6 GW 1.1 GW installed wind power: 16.6 GW (22% of peak load) produced wind energy: 26 TWh (5% of consumed energy) 33
35 Wind power: Daily availability Energy of 5400 wind turbines at MW Megawatts Load curve of the grid 0:00 2:00 4:00 6:00 8:00 10:00 12:00 14:00 16:00 18:00 20:00 22:00 0:00 100% 50% Basic load Source: ISET 34
36 Wind power: Monthly availability Wind Genberation [MW] Energy of 5400 wind turbines during October Days 35

37 Wind power availability Additional storage necessary - Additional storage: pump storage magnetic storage - Better wind prediction Source: Komarek, FSZ Karlsruhe 5000 MWh 36
38 Future: Large magnetic storage device? Superconducting ring coils C (Liquid Helium) 360 coils! 5000 MWh Energy storage in the magnetic field 26 m Coil current Magnetic flux density 150 ka 9 T 520 m Source: Max Planck Gesellschaft 37
39 Wind energy Flow across the country Northern Germany: many wind farms, but low consumer density Consumer centers, where the power is needed Main power flow directions - Liberalized market and - Increased size of wind farms The high voltage grid needs a) to be enlarged b) thermal monitoring c) FACTS to avoid reactive power. 38
40 Overview Motivation Electrical energy situation in Germany Regenerative energy conversion Integration of large wind power plants Summary 39
41 Summary Germany is world leader in installed wind power and photo voltaic Regenerative energy shall increase from 11% to about 25% in electric energy production in Germany Electrical power generation: NOT revolution, BUT Evolution Find the right Energy-Mix with a co-existence of conventional and with increasing part of regenerative energy sources Increased need of new storage devices and new power transmission lines 40
42 Electrical Energy Conversion - Trends, Developments Thank you for your attention! abinder@ew.tu-darmstadt.de 41