Sustainability Modeling
|
|
|
- Ami Bennett
- 5 years ago
- Views:
Transcription
 A model is a")
1 I. SOME BASICS OF SYSTEMS MODELING Sustainability Modeling 1. WHAT IS A MODEL? An abstraction or simplification of reality A description of the essential elements of a problem and their relationships A reconstruction of nature for the purpose of study (Levins 1968) A model is a caricature of nature... the simplest version of nature can be perturbed numerically with its responses being indications of the directions nature may take (Scavia, Lang and Kitchell 1988). 2. WHAT IS A SYSTEM? An organized collection of interrelated physical components characterized by a boundary and functional unity A collection of communicating materials and processes that together perform some set of functions An interlocking complex of processes characterized by many reciprocal cause- effect pathways Any collection of interacting objects or processes 3. TYPES OF MODELS 1) Physical vs. Symbolic (or abstract) Models o Physical: a scaled- down (or, less frequently, scaled- up) physical replicas of a real system o Symbolic: verbal, written language, or mathematical 2) Dynamic vs. Static Models o Dynamic: with time varying variables o Static: time invariant 3) Empirical (Correlative) vs. Mechanistic (Explanatory) Models o Empirical: without internal dynamics; descriptive; prediction o Mechanistic: with internal dynamics; explanatory; understanding/prediction o Whether a model is empirical or mechanistic is often relative, depending on the level of detail or the scale of observation. 4) Deterministic vs. Stochastic Models o Deterministic: with no random variables; point estimation of parameters o Stochastic: with one or more random variables; estimation of parameter variations (e.g., mean, variance, distribution) 1
2 5) Simulation vs. Analytical Models o Analytic models: pencil and paper; solvable in closed form analytically; relatively complicated mathematics; greater mathematical power and usually higher generality o Simulation models: use of computers; relatively simpler mathematics; usually less generality and more realism 4. ORGANIZED VS. UNORGANIZED COMPLEXITIES AND MODELING APPROACHES: 1) Small- number system: o Relatively few components, highly interrelated o Organized simplicity o Newtonian approach 2) Medium- number o Intermediate number of components, closely interrelated o Organized complexity o Systems approach 3) Large- number systems o Large number of components, loosely interrelated o Unorganized complexity o Statistical approach Rules of thumb for choosing methods of problem solving based on data availability and the level of understanding on the system: Amount of Data Level of Understanding Appropriate Method Many Little Statistics Many Good Physics Few Little System Analysis & Simulation Few Good System Analysis & Simulation 5. WHY MODELS? Models can be and have been used for several purposes other than prediction: Prediction Understanding Generate and test hypotheses Synthesis Identify areas of ignorance Serve as management tools 2
3 6. Four Basic Phases in Systems Analysis (or Systems Modeling) Phase 1: Conceptual model formulation o Define the problem o Specify model objectives o Delineate system boundaries o Construct causal diagrams o Understand feedback loop structure Phase 2: Quantitative model specification o Select general quantitative structure for the model o Choose basic time step for simulations o Identify functional forms of model equations o Estimate parameters of model equations o Code model equations for the computer o Execute baseline simulation o Present model equations Phase 3: Model evaluation o Components of model evaluation o Model verification o Model validation Phase 4: Model application o Develop and execute experimental design for simulations o Analyze and interpret simulation results o Examine additional types of management policies or environmental situations o Communicate simulation results * The 4 phases are interactive, meaning that one often has to go back and forth among the four phases during model development. 3
. He claimed that one can maximize only two (not all three) simultaneously, but all three can be improved at the same time to a certain level.")
4 Richard Levins trichotomy of model development: Generality, Realism, and Precision Levins (1966) recognized the existence of trade- offs among generality, realism and precision in model- building (Levins trichotomy). He claimed that one can maximize only two (not all three) simultaneously, but all three can be improved at the same time to a certain level. Generality: the number of systems or situations to which the model applies. Realism: the degree to which model structure (including variables, assumptions, relationships) resembles the real system. Precision: the degree to which model behavior numerically matches that of the real system, i.e., the accuracy of the model predictions (output). 4
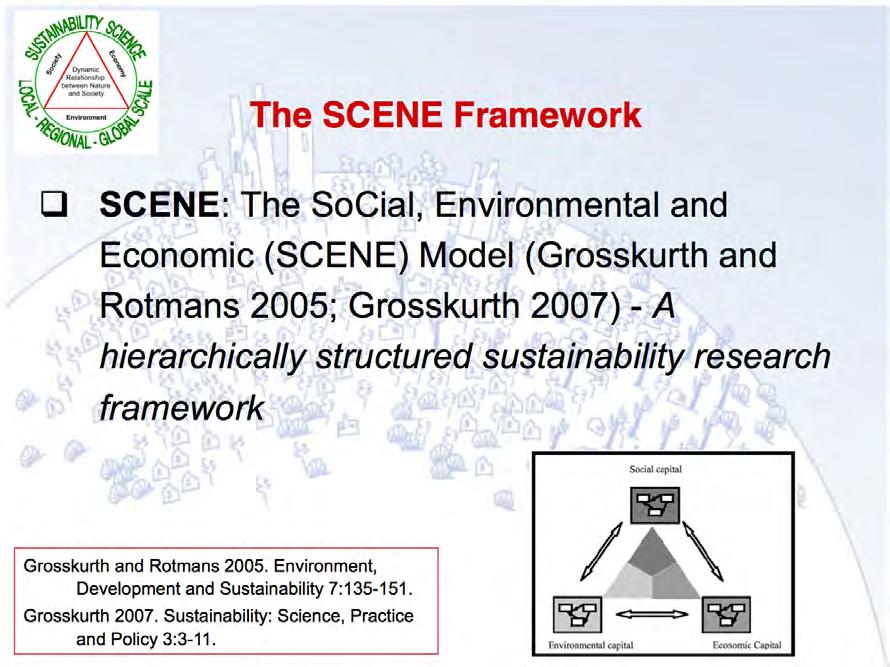
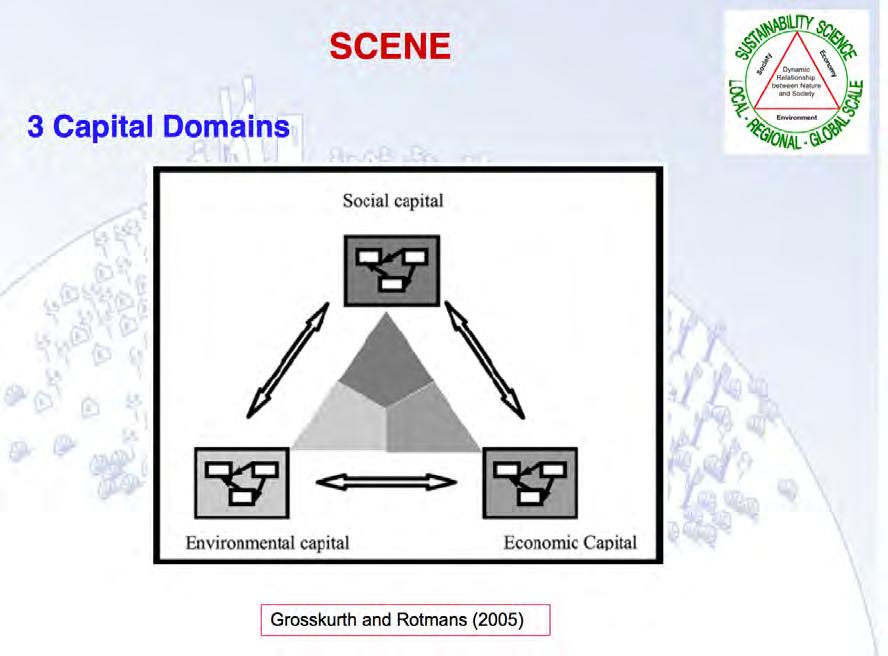
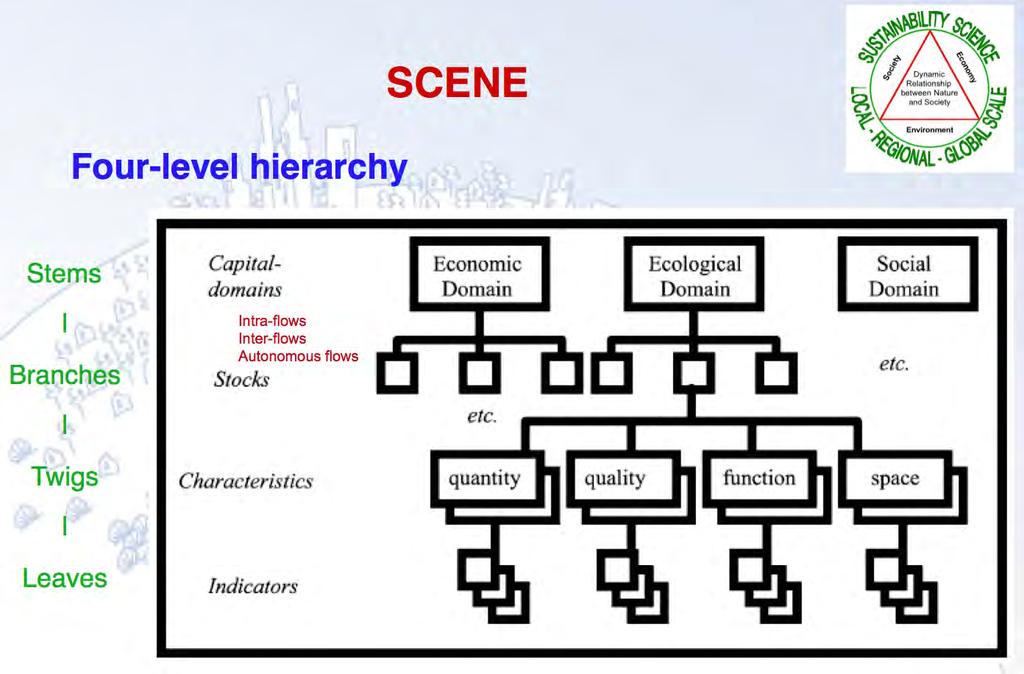
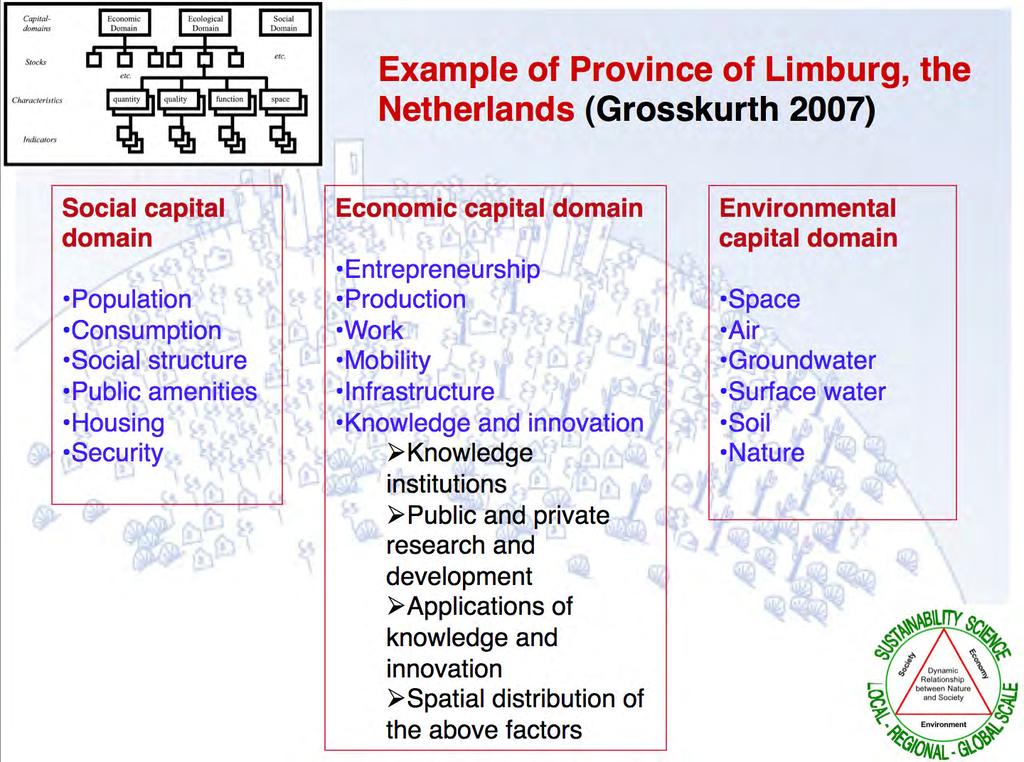
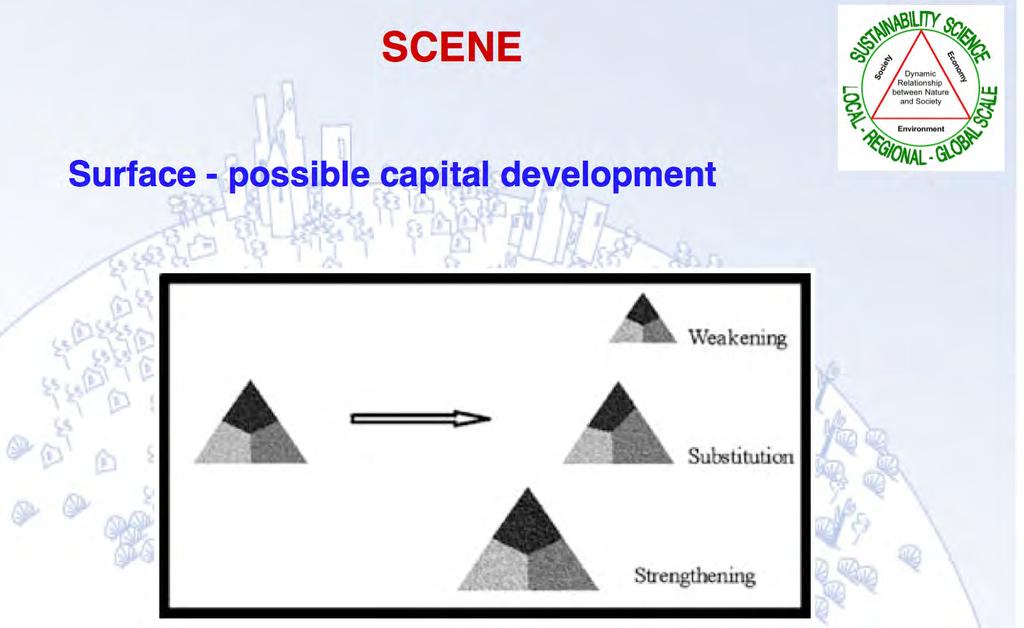
5 II. EXAMPLES OF SUSTAINABILITY MODELS o SCENE: See reading materials at the class web site. o Threshold 21: See reading materials at the class web site. Model Objectives Some examples of sustainability models: GAPSIM, Panta Rhei, SCENE, and Threshold 21. GAPSIM Panta Rhei SCENE Threshold 21 GAPSIM was an attempt An assessment of the Better understanding of a tool for exploring to integrate various social costs and the underlying dynamics consequences of components of GAP benefits resulting from of stainable development policy intervention socio- environmental the phase- out of and related issues through resource system for policy analysis environmentally allocation on the long- at macro level. harmful subsidies term development goals of a nation. Key Sustainability Issues that can be addressed by the model model structure and key components (or sectors) the level of hydropower production, extend of irrigation, crop selection, environmental indicators, agricultural production and demography, in a long- term dynamic context Arable land sectors, Water resource sectors, Irrigation and salinization sector, Erosion sector, Fertilizers sector, Pesticides sector, Urban sector, Population sector Indicating the linkage of economic development and environmental impacts/inclusion of a key social concern in the evaluation of sustainability policies 29 energy carriers and their inputs in 58 production sectors and households as well as 8 air pollutants and their relations to 29 energy carriers Structural representation of economic, ecological and social stocks and the interaction between them/ Mutual dependence of stock characteristics Capital domains (Social, environmental, and economic capital) and their stocks/ Characteristics such as quantity, quality, function, and space and their indicators Climate change impacts/ Future prospects of public transportation/ Waste reuse for energy production Integration of economic, environmental and social elements General mathematical modeling approach or framework Simulation techniques used 2000 variables and 14 sectors, representing different environmental and economic components, were constructed using STELLA. Understanding how the physical processes, information flows and managerial policies interact so as to create the dynamics of the variables of interest System dynamics modeling and simulation, specifically designed for modeling and analysis of large- scale socio- economic systems using STELLA focused on disaggregated, econometric simulation model/ System of National Account/ Input- Output table with 59 The energetic air pollutant emissions are derived using constant (CO2) and variable (NOx and SO2) emission coefficients for the demand of private households and 58 poduction sectors, disaggregated for 29 energy carriers. Based on the INFORUM philosophy of building econometric input- output models bottom up and fully integrated A suitable qualitative modeling- framework for quantitative modeling Using expert insight Addressing ambiguity Participatory methods The structure of the SCENE model, including the derived set of indicators is a transparent framework for the development of quantitative models in the tradition of system dynamics. Economic sectors, social sectors and resource and environment sectors are dynamically linked to each other to form hundreds of feed- back loops Using the concept of the World Bank s environment related indicators, the sectors in T21can be classified into three types of capital around the production activity through a system dynamics approach 5
6 industry sectors Status of validation Main strengths and weaknesses The model was validated by using structure- oriented behavior tests, extreme- condition, behavior sensitivity and phase relationship tests. Strengths: The model can serve as a useful generic structure to be adapted to similar regional development projects. It can be sued as an experimental laboratory for the policy makers of GAP in the future. Although the article does not mention about validation, the model is considered a highly sophisticated econometric model for the German economy and is assumed to be validate. Strengths: The model uses real and nominal variables and therefore also prices. It forecasts these sectoral and macroeconomic variables in nominal and in real terms. All parameters were estimated by econometric methods. It has been used for quantitative modeling in their ongoing consultancy activities for the city of Maastricht but the full quantification of the model for a given region is currently in progress. Strength: Expert based process Well- structured overview of economic, ecological and social stocks and characteristics provides a framework for an integrated and balanced evaluation Weakness: the uncertainty related to the relationships between different indicators Independent reviews confirm that T21 possesses sound economic foundations and performs better than the other integrated models currently available. Experts at the World Bank, UNDP, and The Carter Center examined T21 closely and determined it is very well suited for MDG analysis and PRS and other planning exercises. However, it is still a work in progress. Strength: Quantifying linkages in the model is very effective. 6
7 7
8 8

9 9