COEGA DEVELOPMENT CORPORATION OUR APPROACH TO AIR QUALITY MANAGEMENT IN THE COEGA SEZ 1 OCTOBER 2018
|
|
|
- Amberlynn McKinney
- 5 years ago
- Views:
Transcription

1 COEGA DEVELOPMENT CORPORATION OUR APPROACH TO AIR QUALITY MANAGEMENT IN THE COEGA SEZ OCTOBER 0
2 AIR QUALITY MANAGEMENT IN THE COEGA SEZ An overview of air quality monitoring in the Coega Special Economic Zone (SEZ) and how air quality management facilitates investment planning of the SEZ

3 STRATEGIC GEOGRAPHIC LOCATION

4 CLUSTERING FOR SYNERGY: ZONES your own BU, you will be required to direct ECM to the location
5 AIR QUALITY MANAGEMENT IN THE SEZ SEA & REZONING EIAs: HIGH ENVIRONMENTAL IMPACT: CHANGE IN AIR QUALITY ENVIRONMENTAL PRINCIPLES & GUIDELINES initially no industry may use a disproportionate amount of the total maximum capacity of the atmosphere; visible plumes are to be disallowed; a 000m buffer zone must be created around heavy industry in which no residential development occurs; all material stores must be fully enclosed or surrounded by a minimum of three retaining walls opening away from prevailing winds; industries must initiate monitoring programmes for their specific concerns before commissioning MITIGATION MEASURES Air quality monitoring (CDC SHEQ): real-time monitoring Environmental targets (CDC & Tenant): monitoring adherence to air quality standards Land use planning (CDC BD & SPATIAL PLANNING & SHEQ) Cumulative impacts air dispersion modeling (CDC SHEQ) Environmental Questionnaire Air Quality Specialist studies
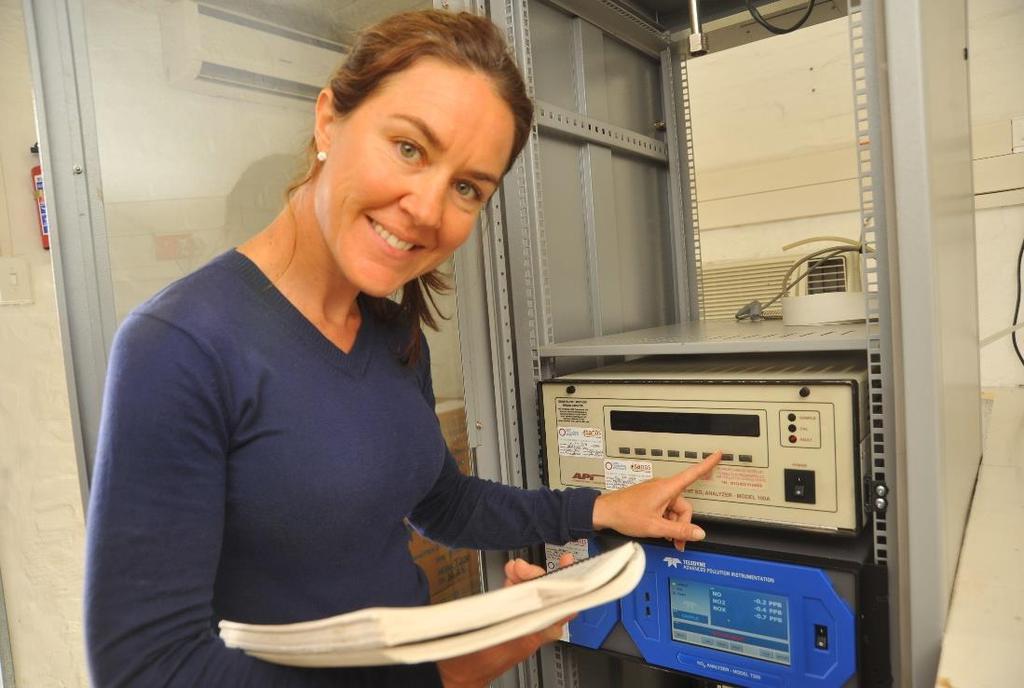
6 AIR QUALITY MONITORING
7 AIR QUALITY MONITORING Commenced in 000 AQM stations ambient AQM Saltworks primary MET station Variables monitored: PM0; PM.5; SO; NO; NO; NOx; O; Wind speed; wind direction; T; Humidity; ambient air pressure; solar radiation, precipitation Data logger stores date in -min averaged values Regular maintenance (biweekly) Quarterly analyser calibrations; annual met calibration Daily, Monthly, Quarterly & Annual Reports Monthly reporting to SAAQIS
8 PARAMETERS CURRENTLY MONITORED SALTWORKS AMSTERDAMPLEIN MOTHERWELL SO SO SO NO NO NO NOx NOx NOx NO NO NO PM.5 PM0 PM0 PM0 Wind Speed Wind Speed Wind Speed Wind Direction Wind Direction Wind Direction Temperature Temperature Temperature Relative Humidity Relative Humidity Relative Humidity Ambient Pressure Solar Radiation Rainfall O
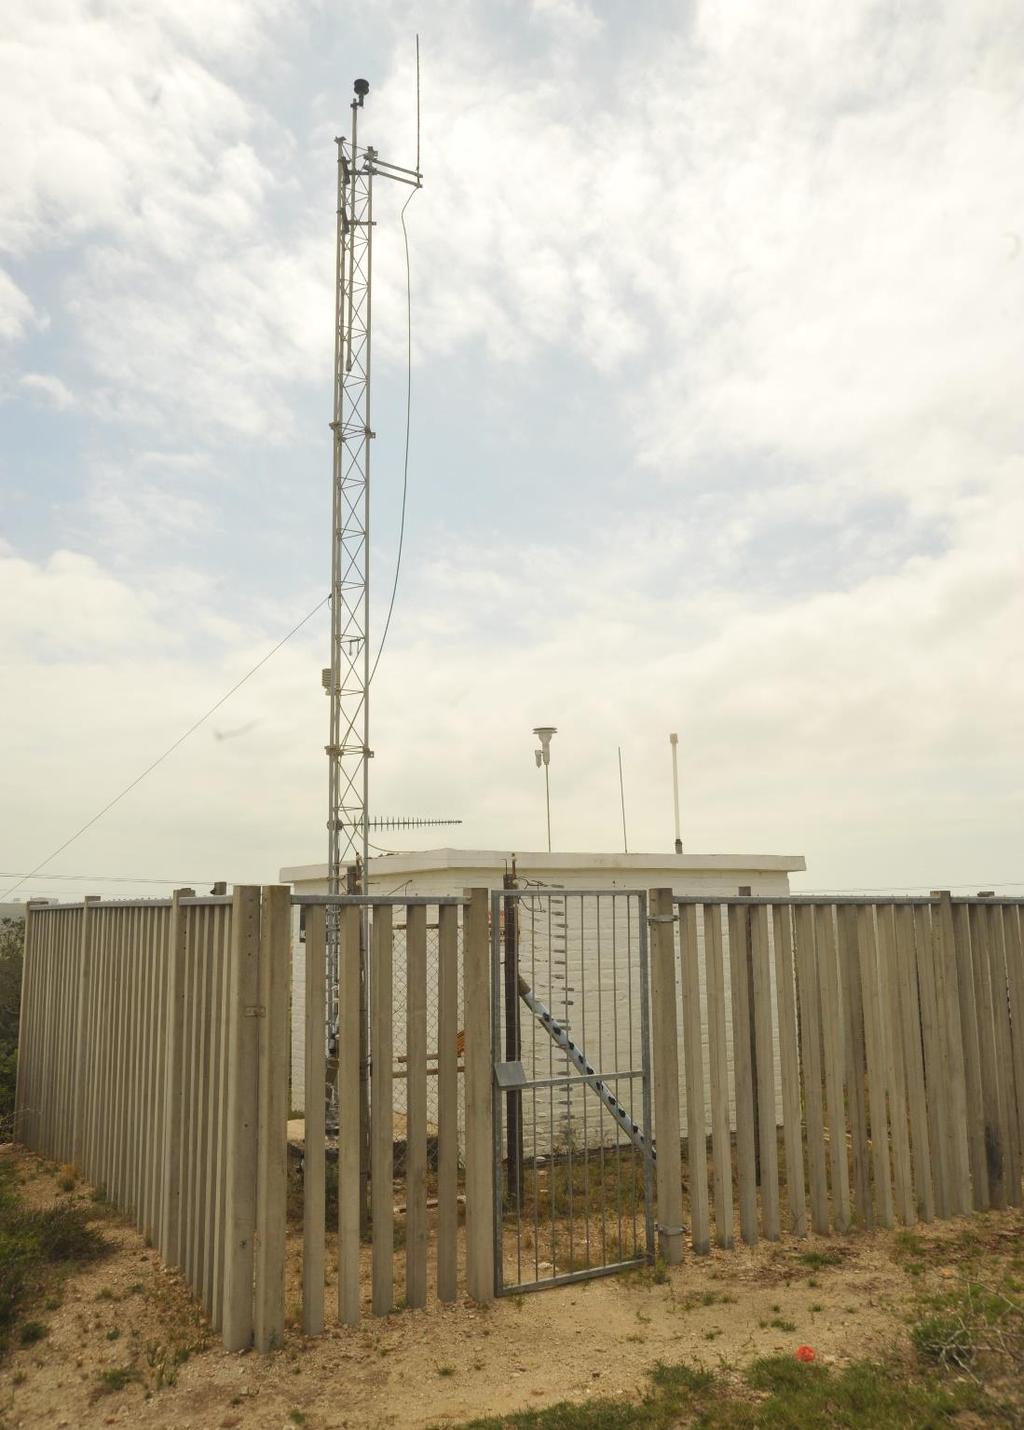

9 AMSTERDAMPLEIN AIR QUALITY STATION
10 AIR QUALITY MONITORING: FINDINGS The total data recovery (validated data) rate based on hourly averaged data for the three AQMS: 05: 5% 06: 6% 0: 69% below required levels (technical problems, vandalism & power failures)
11 AIR QUALITY MONITORING: FINDINGS Exceedances of the SA National Ambient Air Quality Standards: April June 0: Motherwell AQMS - daily PM0 limit of 5 µg/m exceeded when an ave of 5 µg/m was recorded on June Cause extensive veld fires burning around the SEZ July Sept 0: Motherwell AQMS - daily PM0 limit of 5 µg/m exceeded when an ave of 60 µg/m was recorded on July Cause domestic fuel burning residential area
12 AIR QUALITY MONITORING: CHALLENGES Data availability affected by: Frequent & lengthy power outages Vandalism affected data availability No spare / stand-by equipment Faulty / old equipment now replaced
13 NAQI PROGRAMME The DEA has identified the Saltworks AQMS to be included as a National Air Quality Indicator, to assist in managing and reporting the state of air quality. In July 0, a new PM.5 analyser was installed in the Saltworks AQMS, as part of the NAQI Programme.
14 RAINFALL IN THE COEGA SEZ mm 06 60mm 0 mm 0 (Jan Aug) 9mm
15 SO SUMMARY - MOTHERWELL SO data for 0 is distributed evenly with no definitive spike originating from one location:
16 SO SUMMARY - MOTHERWELL The graph below shows that 0 had lower amounts of SO compared to 06:
17 NO SUMMARY - MOTHERWELL Although NO data for 0 is spread out, a higher amount originates from a NW & southerly direction (Motherwell residential area):

18 NO SUMMARY - MOTHERWELL NO data for 0 on average has not changed much from 05 or 06; but 0 has a few higher spikes:

19 PM0 SUMMARY - MOTHERWELL PM0 data in 0 is spread throughout but higher amounts from WSW & WNW directions Motherwell residential area:

20 PM0 SUMMARY - MOTHERWELL PM0 data in 0 is on average the same as for 05 & 06, but with lower spikes:
21 AIR DISPERSION MODELLING

22 ADM MAP: IDZ + 0KM RADIUS 5 & 0km radius Red dots: receptor points at which ground level concentrations measured
23 ADM METHODOLOGY Baseline Assessment on-site sources & off-site sources (0km) Line (traffic), grid (residential), point sources (industrial) Add each new industry to baseline Approach: model dispersion of pollutants; compare findings with ambient air quality standards Requirements: ) emissions inventory; ) meteorological data set; ) approved ADM (aermod)
24 TOTAL EMISSIONS PM0 particulates: 95 tpa Points: 6. %; Area:. %; Grid:.0 %; Line:. % SO : 0 00 tpa Points: 9.5 %; Area:. %; Grid: 0. %; Line:.0 % NO : 06 tpa Points:. %; Area:. %; Grid: 0.6 %; Line:.0 % CO: 9 0 tpa Points: 99.5 %; Area: 0. %; Grid: 0.0 %; Line: 0. % CO : tpa Points:. %; Area:. %; Grid:. %; Line:.5 %

25 ADM RESULTS: 0 annual average PM0
26 INVESTMENT ATTRACTION TOOL Well-managed SEZ attractive for investment Clean air health Minimise air space consumption by lowering emission limits, means more investment = economy & jobs
27 THANK YOU