Appendix-A1 IRRADIANCE DATA
|
|
|
- Stewart Dixon
- 5 years ago
- Views:
Transcription
1 Appendix-A1 IRRADIANCE DATA The following Tables A1.1 and A1.2 respectively presents the irradiance data for Bangalore region (year-2001) supplied by IMD, Pune. These irradiance data set enables computation of offline horizontal and vertical; global as well as diffuse exterior illuminance respectively using suitable analytical models such as Perez model. Table A1.1 Global irradiance (W/m 2 ) for Bangalore region (year-2001) supplied by IMD, Pune. Time Month 6:00 7:00 8:00 9:00 10:00 11:00 12:00 13:00 14:00 15:00 16:00 17:00 18:00 Jan Feb Mar Apr May Jun Jul Aug Sep Oct Nov Dec Table A1.2 Diffuse irradiance (W/m 2 ) for Bangalore region (year-2001) supplied by IMD, Pune. Time Month 6:00 7:00 8:00 9:00 10:00 11:00 12:00 13:00 14:00 15:00 16:00 17:00 18:00 Jan Feb Mar Apr May Jun Jul Aug Sep Oct Nov Dec


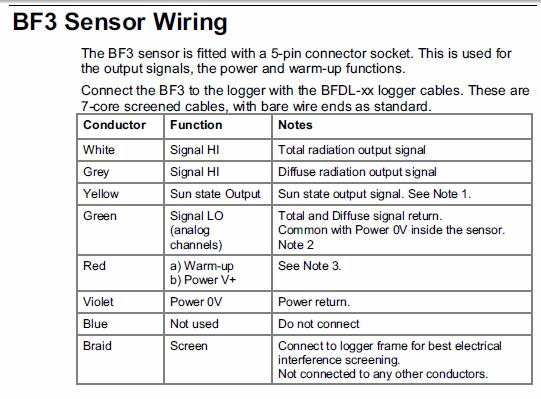
2 Appendix-A2 BF3 SUNSHINE SENSOR DATASHEET 118
3 119
4 120


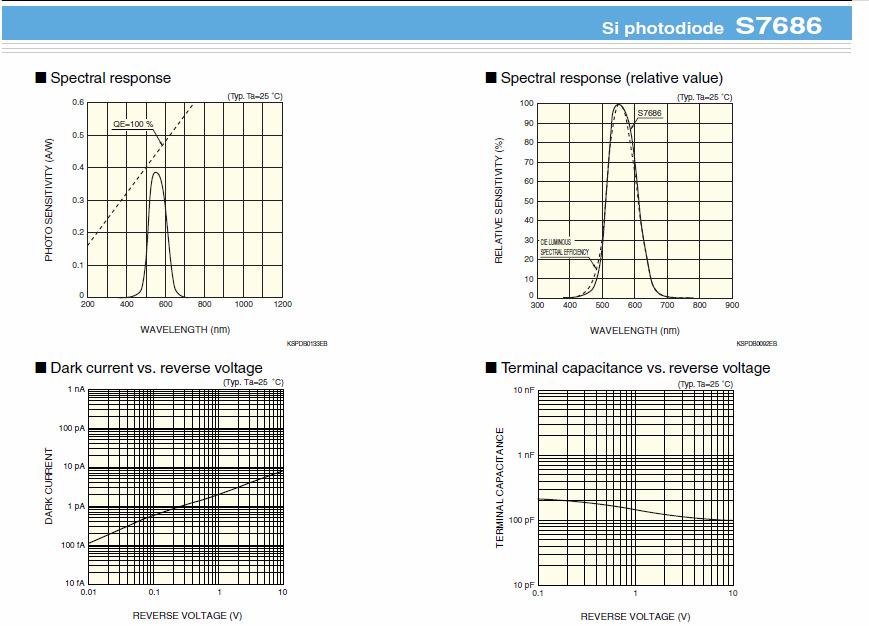
5 Appendix-A3 SI PHOTODIODE S7686 DATASHEET 121
6 122
7 Appendix-A4 Experiment to Calibrate S Fig. A1. Circuit diagram to calibrate S7686 Si photodiode 1. The circuit of Fig. A1 can be used to measure a maximum of 5000 lx with a voltmeter having a 5V range 2. A standard incandescent lamp of 100W is used for calibrations 3. To make calibrations, first select the 1mV/lx range as shown in the circuit diagram of Fig. A1 and short the wiper terminal of the 500 ohm variable resistor VR and the output terminal of the OPAMP. 4. Adjust the distance between the photodiode and the incandescent lamp so that the voltmeter reads 0.38 V. At this point, illuminance on the S7686 photodiode surface is about 100lx. 5. Finally, open the shorted terminals and adjust VR so that the voltmeter reads 1.0V. This completes the calibration. The illuminance values read outs by S7686 are compared with standard Konica Minolta Chroma meter CL-200 as depicted in Table 5. Table A4.1 Percentage read out error of S7686 photodiode in comparison with Konica Minolta Lux meter Particulars Avergage Illuminance (lx) % Error Standard Incandescent Lamp S7686 photodiode (Mean of 5 readings) Konica Minolta Luxmeter % % % Overcast Sky % Clear Sky % The admissible total error for illuminance detector class B type is <10% as per DIN photometry standards.. Application circuit examples of Si Photodiode available at 123
8 Appendix-A5 OCCUPANCY SENSOR K4015 DATASHEET 124
9 Appendix-A6 ENERGY METER MFM383 DATASHEET 125


10 Appendix-A7 TRANSMITTANCE OF WINDOW VENETIAN BLINDS For measuring window Venetian blind transmittance, interior illuminance measurements are taken at a distance of 0.5 m from the blind plane with a Konica Minolta Light Meter, model CL-200. For a given sky condition, blind transmittance is estimated as the measured ratio of interior illuminance with window blinds to interior illuminance without blinds. An average of 10 readings is presented in the Table A7.1 Table A7.1 Experiment to find window blind Transmittance Blind Position Sky condition Image Average Transmittance ~45 0 Clear sky. However, direct sun does ~0.65 not fall on the test set up. Measurements taken on 10 th, November 2009, 1:15 p.m. ~90 o Clear Sky. However, direct sun does not fall on the test set up. Measurements taken on 10 th, November 2009, 1:00 p.m. ~0.4 ~45 0 Overcast sky. Measurements taken on 14 th, August 2009, 10:00 a.m. ~0.57 ~90 o Overcast sky. Measurements taken on 14 th, August 2009, 10:30 a.m. ~
11 APPENDIX-A8 Cost Benefit Analysis The large building of New Lecture Hall (NLH) Complex of Manipal Institute of Technology, Manipal has twenty classrooms each of dimension 15m 10m 2.75m. The class room area under consideration has a glass wall along the length with fabric curtains on one side and light colored wall on the other. A total of 12 fixtures comprising 2 36 watts CFL mirror optic recess mounted luminaires (with non dimmable ballasts) are arranged in each classroom. The probable theoretical cost benefit analysis calculations in this context are based on a total of 300 working days with 8 hours working period (from 8a.m to 5p.m with one hour off for lunch break) in a day. To start with, following are a few observations made related to classroom illuminance and energy consumption: The quality and the quantity criteria of lighting conform to the prescribed illuminance standards [98] with an average task illuminance of approximately 400 lx. Daylighting is not efficiently utilized. Lighting system is always switched on during the class working hours. Without lighting controls the calculated annual energy consumption of 20 rooms in the building is approximately 46,080 KWh. Table A7.1 The total energy consumption without lighting controls in New Lecture Hall building of Manipal Institute of Technology, Manipal.. Number of luminaires in each class room =12 Number of lamps per luminaire =2 Power consumed per lamp =36 W Power consumed by each luminaire including the =2 36+8=80 W ballast in each class room Total power consumed by the luminaires per class =80 12=960 W room Total power consumed in 20 class rooms =960 20=19.2 KW Number of working hours per day =8 hrs Total energy consumption per day =19.2 8=153.6 KWh Total number of working days =300 Annual energy consumption for 20 class rooms = =46,080 KWh Cost per unit =Rs Total electricity cost for 20 class rooms without =46,080 6=Rs.2,76, lighting controls 127
12 It is anticipated that the following few suggestions if incorporated in the aforementioned NLH building would enable effective harnessing of daylight with the current developed adaptive predictive lighting control scheme: Two lighting zones along the length are to be prepared with 6 2 fixtures with EDB in each fixtures. Two ambient light sensors at the center of each lighting zone and single occupancy sensor should be incorporated. A single exterior sensor should be mounted on the roof top for measurement of global and diffuse illuminance. A centralized PC is essential for data acquisition, training, computation and control. Table A7.2 Initial cost of equipments to facilitate lighting control in New Lecture Hall building of Manipal Institute of Technology, Manipal. Item list Qty Cost/item (Rs.) Total cost (Rs.) Occupancy sensor , Light sensor , Dimming ballast ,40, Exterior Light sensor 1 1,00, ,00, PC, DAQ and other accessories 1 40, , Total Initial cost 4,24, Table A7.3 Probable economic cost benefit with developed lighting control scheme if applied to New Lecture Hall building of Manipal Institute of Technology, Manipal. As depicted in section 5.4, assume a minimum energy saving of = =13824 KWh 30% in annual energy consumption. Total reduction in annual energy consumption for 20 class rooms Total electricity cost for 20 class rooms with lighting controls = =Rs.82, Savings in electricity bill =2,76,480 82,944=Rs.1,93, Initial cost of the system =Rs.4,24, Simple payback time =Cost of the system annual energy savings = = ~2.2 years It could be inferred from the calculations that the present developed scheme if implemented in illustrated NLH building, the energy consumption could be reduced to approximately KWh. Nevertheless in larger commercial installations, there is a greater likelihood that with an extra effort of careful planning savings would be attributed to the incorporation of occupancy sensors and dimming of artificial lights in response to daylight variations. 128