EMD SERONO RESEARCH CENTER EXISTING
|
|
|
- Emmeline Holmes
- 5 years ago
- Views:
Transcription
 CHEN MECHANICAL AE SENIOR")
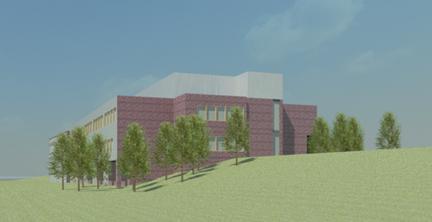
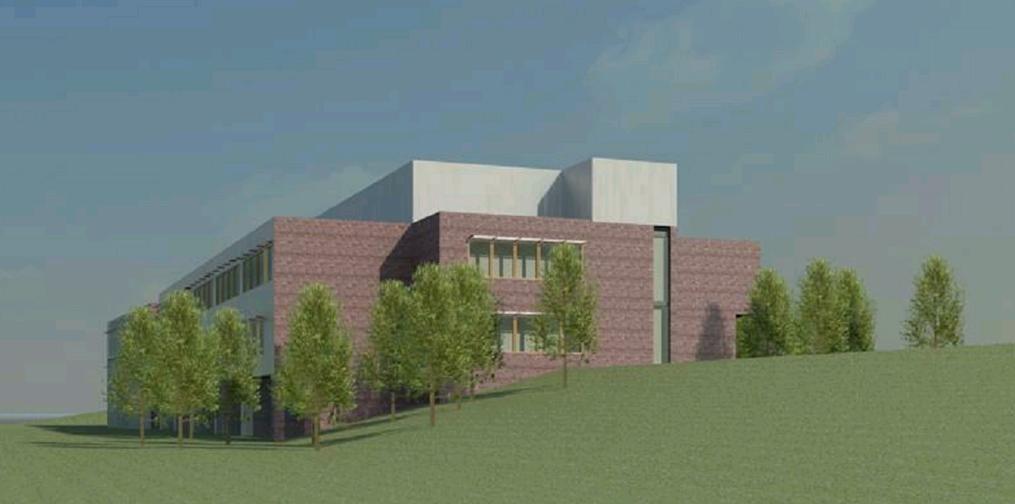
1 EMD SERONO RESEARCH CENTER EXISTING BILLERICA, MA SHIYUN (SHARON) CHEN MECHANICAL AE SENIOR THESIS
2 Building System Dedicated Outdoor Air System/ Systems Breadth


3 Building Design Team Building: EMD Serono Research Center existing Building Location: Billerica, MA Building Size: 56,700 SF Number of Story: Basement + 2 Stories + Penthouse Occupancy/ Function Type: Pharmaceutical Lab Date of Construction: Nov,1999 Marc,2002 Project Delivery Method: Fast - Track Owner: EMD Serono, Inc. Architect: Ellenzweig Associate, Inc. MEP Engineer: Bar, Rao + Athanas Consulting Engineers, LLC Structural Engineer: LeMessurier Consulting Engineers Landscape Architect: John G. Crowe Associates, Inc. Contractor: Linbeck/Kennedy & Rossi
 350 Ton Centrifugal Chiller (1) 60 Ton Air Cooled Chiller (2) Low")

4 System (2) 100% OA Air Handling Units (1) OA + RA Air Handling Unit (1) 350 Ton Centrifugal Chiller (1) 60 Ton Air Cooled Chiller (2) Low Pressure Steam Boilers (2) Heat Exchangers Mechanical Room Office Penthouse 2nd Floor 1st Floor Lab Vivarium Basement Mechanical Building Division


5 Redesign Goals Solution ENERGY CONSUMPTION SYSTEM EFFICIENCY INDOOR AIR QUALITY THERMAL COMFORT Dedicated Outdoor Air System System System Solar Shading System
 350 Ton Screw Chiller - AHUs (1) 150 Ton Screw Chiller -")
6 DOAS + Chilled Beam Selection Advantages 17CFM/LF 665 BTU/LF Minimize Outdoor Air Conditioning Eliminate Reheat Energy More Efficient Chilled Water System Better Mixed Air Distribution More Uniform Temperature Distribution TROX Technic 4 Pipe Chilled Beam, Model DID602, type C nozzle NC25 Improve Indoor Air Quality Lower Maintenance (1) 350 Ton Screw Chiller - AHUs (1) 150 Ton Screw Chiller - ACBs


7 CFD Simulation Existing VAV Fume Hood Sash Exhaust Grills Supply Air = Outside Air = 6000cfm Square VAV Diffusers SA Temperature: 13C = 55.4F DOAS+ACB Supply Air = Outside Air + Recirculate Air VAV 20,092cfm = 3,324cfm + 16,769cfm SA Temperature: 19.64C = 67.4F Grid Size General Information Turbulence Model Numerical Scheme Number of Iterations Mass Residual Existing System 108x218x61 KE model Upwind % ACB Active Chilled Beam System 52x459x35 KE model Hybrid %


8 Air Flow Comparison The System provides a better mix air distribution than VAV system VAV : supply air is closely concentrated beneath the square diffuser VAV VAV VAV ACB : air flow along chilled beam to spread air around Closer View ACB ACB Side View ACB
 difference from ankles to head ACB 0-2F (0-1C) difference from ankles to head ACB Side View")
9 The System provides a more uniform temperature distribution than VAV system Temperature Distribution Comparison The System has a smaller temperature gradient than VAV system ASHRAE <5F (2C) difference from ankles to head To maintain thermal comfort and avoid draft VAV VAV VAV 3F (2C) difference from ankles to head ACB 0-2F (0-1C) difference from ankles to head ACB Side View ACB


10 The System provides greater ability to remove airborne contaminant from the space than VAV system Contaminant Concentration Comparison VAV ACB The ACB System achieves 75% concentration reduction while VAV system has only 25% reduction Source Edge of Bench Walkway VAV VAV 200 ppm 200 ppm 150 ppm ACB 200 ppm ppm 50 ppm ACB


11 Gas ( Therm) Electric(kwh) Outline The DOAS + ACB system cost $621,276 more in first cost than the CAV/VAV sys. The DOAS + system Saves 12.5% (313,789Kwh) electricity consumption in the summer & 24.5% (32.098Therm) gas consumption in the winter when compared to the existing CAV/VAV system Electricity Consumption (Kwh) The DOAS + ACB system has a simple payback period of 9 years 5 months Existing System DOAS + Active Chilled Beam System s Chiller Cooling Tower Chilled Water Pump AHU Ductwork Pipe Cost Boiler First Cost 300, , , ,000 10,000 0 Jan Feb Mar Apr May June July Aug Sept Oct Nov Dec Existing Sys. DOAS/ACB Gas Consumption ( Therm) Jan Feb Mar Apr May June July Aug Sept Oct Nov Dec Existing Sys. DOAS/ACB Initial Cost Difference: $621,276 Annual Energy Saving: $66,078 Simple Payback: 9 years 5 months
 Heat Pipe Fixed Plate Enthalpy Wheel Run Around Coil Simple Payback 5 months 0 0 0 Fixed")
12 Cost Utility ($) Outline System Analyzed Utility Cost Comparison All heat recovery systems are very cost effective with payback period of 0 to 5 months Annual Utility Cost ($) Heat Pipe 355, , , , ,000 Simple Payback Calculation Comparison DOAS + ACB Total Cooling Load (Ton) Heat Pipe Fixed Plate Enthalpy Wheel Run Around Coil Simple Payback 5 months Fixed Plate Enthalpy Wheel 330, ,000 DOAS/ACB Heat Pipe Fixed Plate Enthalpy Wheel RunaroundCoil Series1 350, , , , ,804 Runaround Coil Loop

13 The Runaround Coil is chosen to be the best suited heat recovery system Runaround Loop Schematic Runaround Coil system are chosen to implement on all air handling units Systems Decision Matrix Heat Pipe Fixed Plate Enthalpy Runaround Coil Wheel Efficiency Energy Recovered Sensible Sensible S+L Sensible Run Around Coil Loop System Simply Payback Calculation Comparison AHU1 AHU2 AHU3 AHU1,3 AHU1,2,3 Additional Cost($) 3,287 2,056 4,211-48,702-46,646 Operating Saving($) 3,743 9,320 4,143 6,188 12,524 Simply Payback 11 months 3 months 1 year 0 0 Cross Contamination No No Yes No Duct Adjacencies Needed Needed Needed Not Needed Maintenance (1:lowest 4:highest)
14 Breadth East Solar Shading Systems North South Latitude: 42 33' 29" N Longitude:71 16' 9" W West 2ft 3ft 4ft 5ft


15 Electricity Saving (Kwh) Gas Saving (Therm) Outline Solar shading system reduces solar load in the summer saves electricity consumption Solar shading system reduces solar parameter heating in the winter penalty in gas consumption East North South 35,000 30,000 25,000 20,000 15,000 10,000 5,000 0 Solar Shade Electricity Saving 3,000 2,000 1, ,000-2,000 Solar Shade Gas Saving 2ft SW 3ft SW 4ft SW 5ft SW 2ft ALL 3ft ALL 4ft ALL 5ft ALL West 2ft SW 3ft SW 4ft SW 5ft SW 2ft ALL 3ft ALL 4ft ALL 5ft ALL Existing Sys. ACB ACB+RC -3,000 Existing Sys. ACB ACB+RC
16 First costs of solar shading system range from $17,066 to $165,568 Payback Periods of solar shading system range from 19 years to 43 years 4ft overhang is selected as the optimal system 200, , ,000 50, ft SW 3ft SW 4ft SW 5ft SW 2ft ALL 3ft ALL 4ft ALL 5ft ALL Solar Shade System Simply Payback Period Solar Shade on South & West Walls Solar Shade on All Walls 2ft 3ft 4ft 5ft 2ft 3ft 4ft 5ft Existing System ACB ACB + RC ft Overhang First Cost


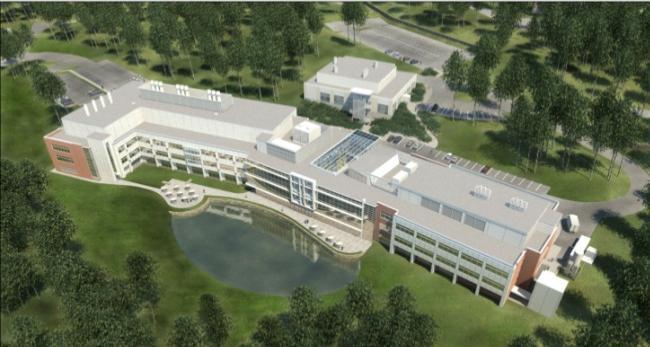
17 Breadth Existing Existing Existing Solar Shade Solar Shade North West Views West Views South Views Solar Shade
18 Overall Simply Payback Calculation 4ft Overhang Existing System DOAS/ACB DOAS/ACB + Runaround Coil DOAS/ACB + Runaround Coil + Solar Shade Total 1,135,702 1,756,978 1,710,333 1,768,132 Cost Difference 621, , ,430 Operating Saving 66,078 78,602 81,023 Simple Payback 9 years 5months 7 years 4 months 7 years 10 months DOAS/ACB + Runaround Loop + Solar Shade 30-Year Life Cycle Cost Analysis Existing System DOAS/ACB DOAS/ACB + Runaround Coil DOAS/ACB + Runaround Coil + Solar Shade First cost ($) 1,135,702 1,756,978 1,710,333 1,768,132 Maintenance Cost($) 4,044,980 56,235 57,935 57,935 Annual Natural Gas Cost($) 6,905,005 5,887,111 5,878,692 5,837,532 Annual Electricity Cost($) 2,449,416 2,098,641 1,932,969 1,919,440 DOAS + Minimize Outdoor Air Conditioning Downsize Ducting and AHUs Eliminate Reheat Energy Downsize Hot Water System More Efficient Chilled Water System Better Air Mixing and Temperature Distribution Greater Ability to Remove Airborne Contaminant Better Indoor Air Quality Runaround Loop System No Cross-Contaminant Issue 3.5% Reduction in Energy Usage Low Maintenance Solar Shading System Energy and Cost Saving Consistent and sustainable appearance to the Building Total 14,535,103 9,798,965 9,579,929 9,583,039
19 Acknowledgements Special Thanks To: AE Faculty EMD Serono BR+A Consulting Engineers Ellenzweig Associate Family & Friends
20 Questions


 Secondary Cooling (Btuh)")
21 VAV Diffuser Cross Section Top View Cross Section Top View Grid Size General Information Turbulence Model Numerical Scheme Number of Iterations Mass Residual Existing System 108x218x61 KE model Upwind % Active Chilled Beam System 52x459x35 KE model Hybrid % 30ft W x 98ft L x 10ft H Selection Calculation Primary Airflow (cfm) Secondary Cooling (Btuh) Available Length (ft) CFM/LF BTUH/LF 3, ,


22 DOE2 polynomial model 150 PLR 100 EIRa 50 Qa COPa 0 Pchill System Decision Matrix Item Existing VAV/CAV System DOAS/ACB System Net for DOAS/ACB System AHU Large Small + Ductwork Large Small + Riser Large Small + Ceiling Space Large Small + Pipework Small Large - Fan Energy High Low + Pump Energy Low High - Occupant Satisfaction Low High + Air Side System Cost Low High + Water Side System Cost Low High - Individual Control Low High + Thermal Comfort Low High + Noise Level High Low + Maintenance High Low + Risk of Condensation Low High - System Complexity Low High + Control System Complexity High Low + Overall +
23 Gas ( Therm) Electric(kwh) Outline 300, ,000 Electricity Consumption (Kwh) 200,000 The DOAS + system Saves 12.5% (313,789Kwh) electricity consumption in the summer 24.5% (32.098Therm) gas consumption in the winter when compared to the existing CAV/VAV system 150, ,000 50,000 0 Jan Feb Mar Apr May June July Aug Sept Oct Nov Dec Existing Sys. 176, , , , , , , , , , , ,716 DOAS/ACB 174, , , , , , , , , , , ,035 20,000 15,000 10,000 5,000 0 Gas Consumption ( Therm) Jan Feb Mar Apr May June July Aug Sept Oct Nov Dec Existing Sys. 17,862 17,233 15,005 11,014 6,381 5,767 5,225 6,000 5,630 10,067 11,746 18,874 DOAS/ACB 13,421 12,811 11,439 8,685 5,095 4,719 4,309 4,933 4,527 8,495 8,953 11,318 Air Flow Comparison Existing System System Primary Airflow (cfm) Primary Airflow (cfm) Secondary Airflow (cfm) AHU1 29,760 24, ,975 AHU2 34,876 12,679 70,411 AHU3 7,374 7,312 36,869 Total 72,010 44, ,255 38% (27883cfm) Outside Air Conditioning Reduction
24 Electricity (Kwh) Gas (Therm) Outline 2,210,000 2,200,000 2,190,000 2,180,000 2,170,000 2,160,000 Annual Electricity Consumption (Kwh) ACB Heat Pipe Fixed Plate Enthalpy Wheel Runaround Coil Series1 2,205,940 2,199,486 2,202,439 2,177, DOAS/ACB + Systems Cooling Load Comparison DOAS + ACB Total Cooling Load (Ton) No Heat Recovery Heat Pipe Fixed Plate Enthalpy Wheel Runaround Coil AHU1+ACB AHU2+ACB AHU3+ACB Total Difference Difference % - 9.9% 10.5% 35.0% 10.1% 100,000 95,000 90,000 85,000 80,000 75,000 ACB Heat Pipe Fixed Plate DOAS/ACB + Systems Heating Load Comparison DOAS + ACB Total Heating Load (Mbh) No Heat Recovery Annual Gas Consumption (Therm) Enthalpy Wheel RunaroundC oil Series1 98,705 86,548 84,770 84,228 86,844 Heat Pipe Fixed Plate Enthalpy Wheel Runaround Coil AHU1+ACB AHU2+ACB AHU3+ACB Total Difference ,122 1, Difference % % 31.4% 39.7% 25.4%
 No With Run Around Coil Loop AHU1 AHU2 AHU3 AHU1,2 AHU1,2,3")
 No With Run Around Coil Loop AHU1 AHU2")
25 Electricity (Kwh) Gas (Therm) Outline 2,220,000 2,200,000 2,180,000 2,160,000 2,140,000 2,120,000 2,100,000 Annual Electricity Consumption (Kwh) DOAS/AC B RC AHU1 RC AHU2 RC AHU3 RC AHU1,3 RC AHU1,2,3 Series1 2,205,940 2,199,546 2,195,600 2,197,695 2,198,515 2,195,617 DOAS/ACB + Runaround Coil System Cooling Load Comparison (Ton) No With Run Around Coil Loop AHU1 AHU2 AHU3 AHU1,2 AHU1,2,3 AHU1+ACBs AHU2+ACBs AHU3+ACBs Total ,000 95,000 90,000 85,000 80,000 Annual Gas Consumption (Therm) DOAS/ACB RC AHU1 RC AHU2 RC AHU3 RC AHU1,3 RC AHU1,2,3 Series1 98,705 89,411 95,583 93,067 86,844 86,794 DOAS /ACB + Runaround Coil System Heating Load Comparison (Mbh) No With Run Around Coil Loop AHU1 AHU2 AHU3 AHU1,2 AHU1,2,3 AHU1+ACBs 2,221 1,603 2,221 2,221 1,603 1,603 AHU2+ACBs AHU3+ACBs Total 3,576 2,957 3,502 3,288 2,669 2,597
26 621 Mbh of energy can be recovered by the runaround loop system Recoverable Energy (Mbh) AHU1 AHU2 AHU3 Total Overall Simply Payback Calculation Existing System Active Chilled Beam System ACB with Run Around Coil ACB + Run Around Coil + Solar Shade Chiller 238, , , ,000 Cooling Tower 53,750 57,650 57,650 57,650 Chilled Water Pump 987 1,139 1,139 1,139 Ductwork 225, , , ,745 (4$/sf for VAV, 2.5$/sf for ACB) s - (260 beams for ACB system, 260, , ,000 $1000 each) Runaround Loop Equipment ,196 11,196 Solar Shading System ,799 (35$/sf + 15% labor cost) AHU 143,450 93,650 91,650 91,650 Pipe Cost (49.5$/lf) 425, , , ,053 Boiler 48,100 43,900 36,900 36,900 Total 1,135,702 1,756,978 1,710,333 1,768,132 Cost Difference 621, , ,430 Operating Saving 66,078 78,602 81,023 Simple Payback 9 years 5 months 7years 4 months 7 years 10 months Annual System Cost Analysis Existing System 30-Year Life Cycle Cost Analysis Existing System DOAS/ACB DOAS/ACB + Runaround Coil DOAS/ACB DOAS/ACB + Runaround Coil DOAS/ACB + Runaround Coil + Solar Shade First cost ($) 1,135,702 1,756,978 1,710,333 1,768,132 Maintenance Cost ($/yr. for existing system; $/5years for redesign systems) 198,450 14,560 15,000 15,000 Annual Natural Gas Cost($) 296, , , ,323 Annual Electricity Cost($) 119, ,074 94,016 93,358 DOAS/ACB + Runaround Coil + Solar Shade First cost ($) 1,135,702 1,756,978 1,710,333 1,768,132 Maintenance Cost($) 4,044,980 56,235 57,935 57,935 Annual Natural Gas Cost($) 6,905,005 5,887,111 5,878,692 5,837,532 Annual Electricity Cost($) 2,449,416 2,098,641 1,932,969 1,919,440 Total 14,535,103 9,798,965 9,579,929 9,583,039 Uniform Present Value(UPV) discount factors adjusted for fuel price escalation for Massachusetts State OMB discount rate 1.9% from year 1 to 10, 2.7% discount rate from year 11 to 30.


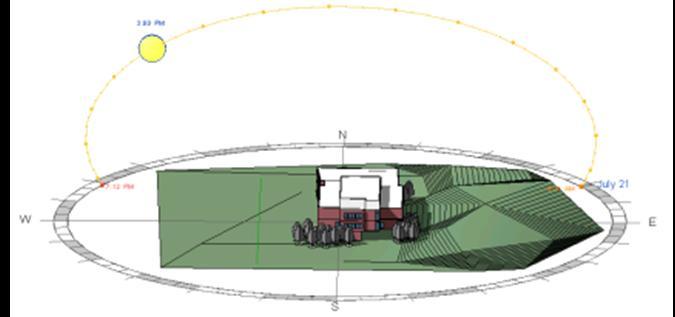
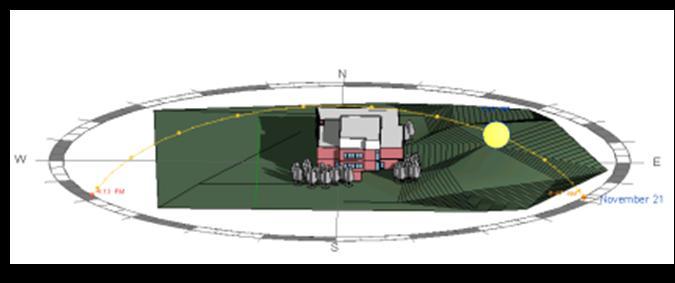
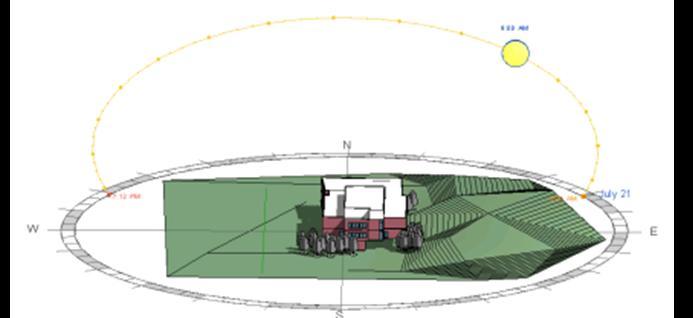
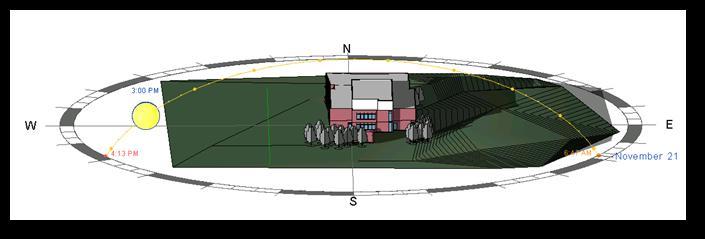
27 Sun Path in Summer Sun Path in Winter


 17,066 37,433 57,799 78,166 46,449 86,155")
28 Solar Shade System Cost Analysis South & West Solar Shade All Sides Solar Shade 2ft 3ft 4ft 5ft 2ft 3ft 4ft 5ft Total Length (ft) 1,012 1,518 2,024 2,530 1,973 2,960 3,946 4,933 Solar Shade Cost 14,840 32,550 50,260 67,970 40,390 74, , ,973 Installation Cost 2,226 4,883 7,539 10,196 6,059 11,238 16,417 21,596 Total Cost ($) 17,066 37,433 57,799 78,166 46,449 86, , ,568
29 LEED Credits Optimize Energy Performance Controllability of Systems Thermal Comfort Possible Credits Enhanced Commissioning Measurement and Verification Outdoor Air Delivery Monitoring Thermal Comfort - Verification