Irrigation Scheduling
|
|
|
- Todd Fisher
- 5 years ago
- Views:
Transcription

1 Irrigation Scheduling Determining Run Times Loren Oki Dept. of Plant Sciences and Dept. Human Ecology UC Davis Doing More With Less Stockton, CA December 2, 2016
2 Learning Objectives How to calculate a schedule Irrigation system factors Why is soil important in scheduling? Climate Landscape factors 2

3 Irrigation Objectives Provide water to plants only when it is needed only the amount that will be used only where it can be used 3
4 Developing An Irrigation Schedule Things you need to know Distribution uniformity Precipitation rate Soil texture Landscape and plant coefficients Climate (Water Use Rates) 4
5 Developing An Irrigation Schedule Things you need to know Distribution uniformity Precipitation rate How fast water is applied 5
, minutes Let s set this at 4 minutes PR= AAAAAA TT CC xx TT x 3.66 = 24.5 16.6 xx 4 x 3.")
6 Precipitation Rate Calculating PR Average of all (Avg T ), ml Catch can throat area (C), sq.in This is 16.6 sq. in. for the ones used Valve on duration (T), minutes Let s set this at 4 minutes PR= AAAAAA TT CC xx TT x 3.66 = xx 4 x 3.66 = 1.35 in/hr 6
7 Developing An Irrigation Schedule Things you need to know Distribution uniformity Precipitation rate Soil texture Plant available water SoilWeb app 7
8 Soil Texture Soil Texture Infiltration Rate (in/hr) Plant Avail Water (cm/cm) * Irrig to Wet to Depth (in)** Coarse sand / fine sand loamy sand Moderately Coarse sandy loam Medium loam silty loam silt Moderately Fine sandy clay loam clay loam silty clay loam Fine sandy clay silty clay clay *Irrigation Association Landscape Irrigation Auditor Manual page 177 **assume 50% dry down (managed allowable depletion) and 12 inch wetted depth 8
9 Soil Texture Soil Texture Infiltration Rate (in/hr) Plant Avail Water (cm/cm) * Irrig to Wet to Depth (in)** Coarse sand / fine sand loamy sand Moderately Coarse sandy loam Medium loam silty loam silt Moderately Fine sandy clay loam clay loam silty clay loam Fine sandy clay silty clay clay Irrig to wet to depth Desired depth to wet = 12 Plant avail water = 0.2 Assume 50% dry down = 12 x 0.2 x 50% = 1.2 *Irrigation Association Landscape Irrigation Auditor Manual page 177 **assume 50% dry down (managed allowable depletion) and 12 inch wetted depth 9
10 Run-time, Part 1 Soil Texture Infiltration Rate (in/hr) Plant Avail Water (cm/cm) * Irrig to Wet to Depth (in)** Medium silty loam Calculating Run-time Lower Boundary (LB) PR = 1.35 in/hr Irrigation to wet to depth = 1.2 LB = IIIIIIIIII tttt WWWWWW tttt DDDDDDDDD PPPP x 60 = x 60 = 53 min 10
11 Run-time, Part 2 Calculating Run-time with DU Upper Boundary (UB) Scheduling multiplier (SM) DU = 0.65 Lower boundary (LB) = 53 min. SM = (0.6 DDDD) = ( ) = 1.26 UB = LB x SM = 53 x 1.26 = 67 min 11
12 Developing An Irrigation Schedule Things you know Distribution uniformity = 0.65 Precipitation rate = 1.35 in/hr Soil texture Lower boundary = 53 min Upper boundary = 67 min This is how much to water Now we need to know when to irrigate 12
13 Developing An Irrigation Schedule Things you need to know Distribution uniformity Precipitation rate Soil texture Landscape and plant coefficients (K L ) 13


14 Landscape Coefficients Information on plant water use WUCOLS 14
15 Developing An Irrigation Schedule Things you need to know Distribution uniformity Precipitation rate Soil texture Landscape and plant coefficients (K L ) Climate (ET 0 ) 15

16 Climate CIMIS C alifornia I rrigation M anagement I nformation S ystem Collects weather info Estimates plant water use More than 120 stations Water use reports are used with a crop or landscape coefficient to estimate site water use 16
17 Climate Water use models Based on weather data Requires previous research Crop specific Easy to use 17
18 Climate Water use models Reference ET (ET 0 ) is reported (CIMIS) Crop coefficient (K c ) is necessary Determine ET crop (ET c ) to estimate crop water use so, ET c =ET 0 x K c Example: citrus orchard K c = 0.65 If ET 0 = 0.5, then crop water use is (0.325=0.5 x 0.65) 18
19 Irrigation Systems ETo Zones Map 19

20 Irrigation Systems ETo Zones Map 20
21 So, Developing An Irrigation Schedule We know how much to apply (1.2 in) Replaces ½ of field capacity Then, We need to estimate when that amount of water is used We know our plants We have info about the climate 21
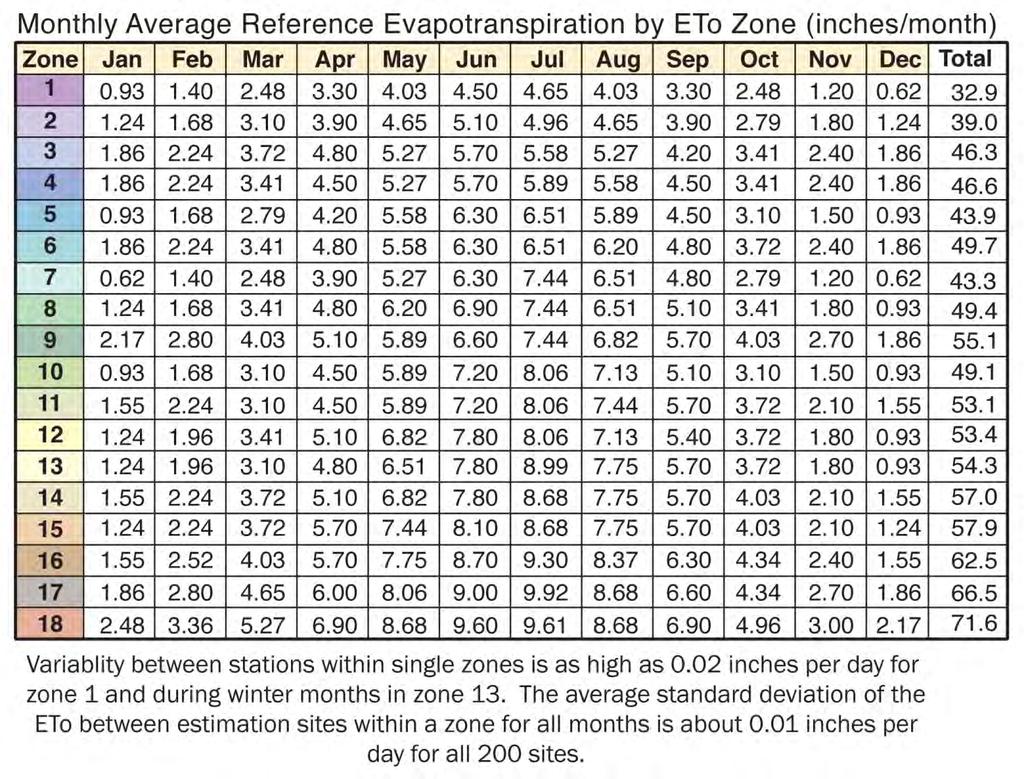
22 Developing An Irrigation Schedule Landscape and plant coefficients (K L ) For this example, 0.4 Climate (Water Use Rates) Monthly Average Reference Evapotranspiration by ETo Zone (inches/month) Zone Jan Feb Mar Apr May Jun Jul Aug Sep Oct Nov Dec Total For this example, we ll use October = 4.03 in/month ET day = 4.03 in 31 days = 0.13 in/day 22
23 Developing An Irrigation Schedule How fast is our landscape using water? ET L = ET day x K L ET day = 0.13 in/day K L = 0.4 ET L = 0.13 x 0.4 = 0.07 in/day 23
24 Developing An Irrigation Schedule Determine when to irrigate Irrigation application = 1.2 in ET L = 0.07 in/day Accumulate ET L daily When accumulated total reaches 1.2 in Irrigate! 24
25 ET day = 0.13 K L = 0.4 ET L = 0.07 Irrig = 1.2 Developing An Irrigation Schedule October Day Total ET L Day Total ET L = = 0.06 (ET L ) (Irrig) 25
26 ET day = 0.13 K L = 0.4 ET L = 0.07 Irrig = 1.2 Developing An Irrigation Schedule October Day Total ET L Day Total ET L Day Total ET L
27 Developing An ET day = 0.13 K L = 0.4 ET L = 0.07 Irrig = 1.2 Irrigation Schedule October Total Day ET L For more accuracy Use actual daily ET Obtain from CIMIS Calculate & accumulate actual rather than historical ET L 27
28 Developing An Irrigation Schedule Things you need to know Distribution uniformity Precipitation rate Soil texture Landscape and plant coefficients (K L ) Climate (ET 0 ) 28
29 More Things to Consider Adjust controllers monthly Program for monthly changes in ET day Interval vs. duration Increase interval between irrigations DO NOT reduce run times Affects wetting depth 29

30 Precipitation Rates Precipitation rate How fast water is applied Infiltration rates How fast water enters soil Photo: D. Franklin, Hunter Precipitation > Infiltration = RUNOFF 30
31 Precipitation Rates Note interval when runoff occurs Example: Duration to runoff is 6 minutes Upper boundary is 30 minutes 6 minute duration, 5 times Cycle-Soak or Pulsing Precipitation > Infiltration = RUNOFF 31

32 Delivery Method Upgrade sprinklers if possible At three study sites upgrades resulted in DU increases of 21%, 24%, and 18% 32 Photo: B. Baker


33 Run time = 4 minutes Run time = 10 minutes Photos: D. Franklin, Hunter

34 Time of Day Why early in the day? Lower temperatures Less wind Photo: L. Oki 34

35 Deep irrigation Deep irrigation Fills a larger volume of soil to provide water to plants Use a soil probe to check wetting depth 35 Photo: B. Baker

36 Drip Irrigation Can it save water? Does it save water? 36

37 Drip Irrigation Precipitation rates approach those of overhead Proper management is key 37


38 Drip Irrigation Precipitation rates approach those of overhead Proper management is key 38

39 Drip Irrigation Precipitation rates approach those of overhead Proper management is key 39
40 Even More Things To Consider Prioritize plants that receive water Know water stress symptoms Precondition to enhance survival Manage salinity 40
41 Managing Irrigation It s a piece of cake There are a lot of ingredients needed to make the cake There are several, distinct steps to put the ingredients together properly Each has to be managed as part of a program Changing one affects another The short version: It s complex 41
42 Managing Irrigation Anyone can do a mediocre (or less) job Doing it well requires diligence We ve gotten away with good enough because water supply wasn t an issue. Now it is. The question that will be asked: Are the rewards worth the effort? 42

43 Thank you Photo: L.Oki