JAP Energy ltd. Presentation for Sensitization & Awareness Forum on Renewable Energy Initiatives. Waste-to-Energy. Dr. Paul Mbu; CEO JAP Energy ltd
|
|
|
- Annabel Horn
- 5 years ago
- Views:
Transcription
1 Clean.Renewable.Energy.Total Waste. Solutions Presentation for Sensitization & Awareness Forum on Renewable Energy Initiatives Waste-to-Energy Dr. Paul Mbu; CEO JAP Energy ltd

2 A New Beginning
3 President Obama in his speech to the United States Congress in January 2009 called for more investment in Clean Energy
4
5
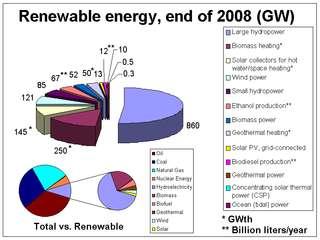
6 What is Renewable Energy Energy derived from natural resources that are replenished constantly; Sunlight Wind Biomass Rain Geothermal heat In 2006 about 18% of final energy consumption came from Renewable energy (13% from Biomass, 3% from Hydroelectricity and 15% global generated electricity)
7
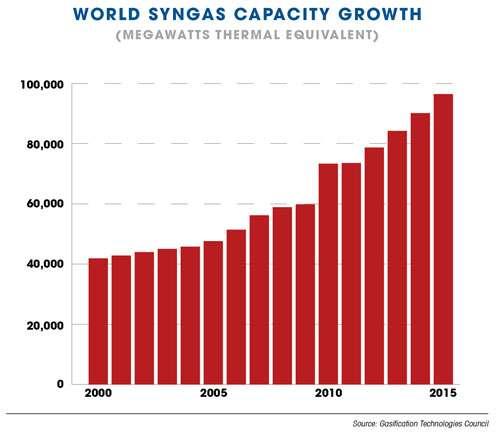
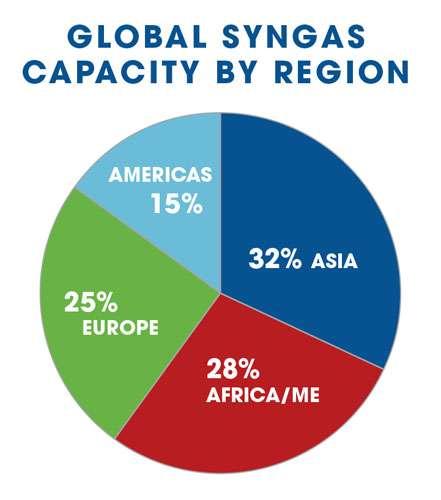
8 Biomass: Biological material derived from living or recently living organisms such as waste, it is a source for renewable energy Syngas (Synthesis gas): is the name given to a gas mixture that contains mainly Carbon Monoxide and Hydrogen and has less than half the energy density of natural gas. Syngas used as fuel for generation of electricity is most often produced by gasification of coal, biomass or municipal waste
9 Syngas as fuel for Electricity Generation Syngas has energy value of Btu/standard cubic foot of gas 1/3 1/6 energy value of natural gas Gasification/Combined Cycle plants achieve 15-30% higher efficiency than natural gas operations
10
11
12 Waste Management Types of waste Components in waste management Available technology Criteria for selection Business models
13 Types of waste Residential waste Municipal Solid Waste Commercial and Industrial waste Special waste Hazardous waste Tyres Petroleum and Oil waste E-Waste, Batteries, etc
14 Waste Treatment Treatment is any process that changes the physical, chemical, or biological character of a waste to make it less of an environmental threat. Treatment can neutralize the waste; recover energy or material resources from a waste; render the waste less hazardous; or make the waste safer to transport, store, or dispose.
15 Treatment technology Waste Material Thermal Biochemical Chemical Recycling Plasma Combustion Gasification Pyrolysis Composting Landfills Arc Anaerobic Digestion
16 Landfills Treatment technology Open or Dump fills Semi-controlled Sanitary landfill Mono-landfill eg MSW landfill
17 Treatment technology Landfill Disadvantages Green gas emissions 55% Methane 45% Carbon Dioxide (CO2) Leachate discharge Organic chemicals eg Benzene, Dioxins, Toluene Heavy metals eg Mercury, Chromium, lead, copper Large land required
18 Treatment technology Waste Incineration Disadvantages High capital cost Skilled operators are required (particularly for boiler operations) Some materials are noncombustible Some material require supplemental fuel Require huge electricity power for operation Public disapproval Risk imposed rather than voluntary Incineration will decrease property value (perceived not necessarily true) Distrust of government/industry ability to regulate
19 Gasification Gasification is a process that converts carbonaceous materials like coal, petroleum and biomass into primarily carbon monoxide and hydrogen in an oxygen starved (controlled) environment Developed in 1800 for production of town gas Used in commercial scale for over 50 years Used in Electricity power industry for over 35 years
20 PLASMA ARC GASIFICATION Plasma arc gasification is a technology that uses electrical energy and high temperature to break down waste into it s elemental atoms. All matter is made up basically of carbon and hydrogen Plasma arc is an electrical arc created between 2 electrodes with: 1. High temperature ( o C) 2. Highly ionized gas created by converting electrical to thermal energy
21 Municipal Solid Waste (MSW) generation is 0.45kg 0.6kg per person per day JAP Energy ltd Waste Composition(MSW) Organic matter 80% Inorganic matter 15% Metal 5% Nigeria Pre-Oil boom (Sachet water) Food/Paper waste More than 55% Post Sachet water Plastics waste 1% More than 55%
22 Waste Management Waste generation rate more than economic growth Less than 50% of generated waste is collected Calabar 80% collection LAWMA figures for 2005 of MSW in tonnage Estimated generation 10,593, Collected 1,107,350 LAWMA Budget analysis 2006 Recurrent Expenditure USD $13,784,615 Capital Expenditure USD $5,000,000
23 Waste-to-Energy (WtE) Term used to describe the conversion of by-products of waste into electricity or steam Source of renewable energy Safe for the environment Reduces greenhouse gas emission Modern facilities meet or exceed EPA s standard Byproduct slag is safe with multiple uses
24 Atonn Plasma Arc Gasification More efficient than older methods of gasification Delivers waste in controlled continuous cranes without air Able to manage 4,000 + metric tons of waste/day Combined Cycle system Heat rate of 7,277 or lower Produce Syngas of higher Btu value BTU/SCF Accepts all waste streams
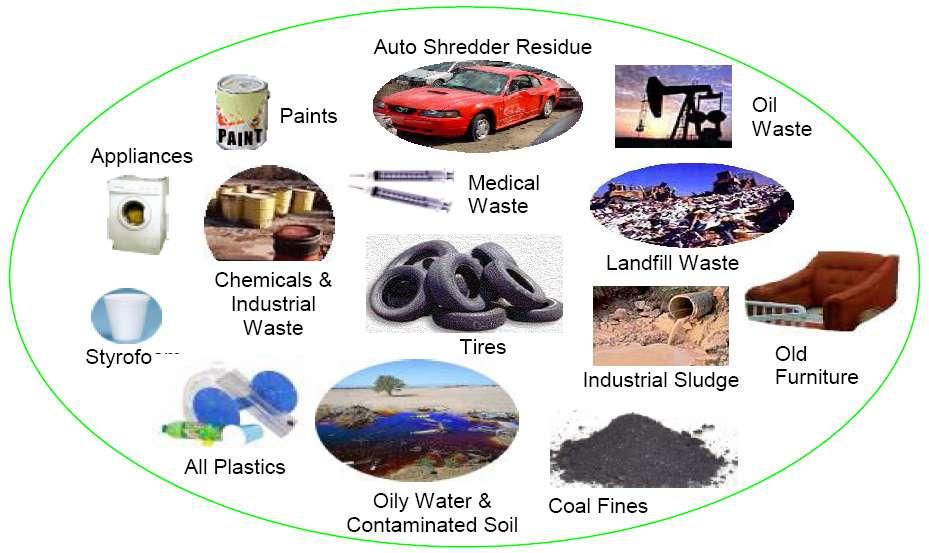
25 Ultimate MSW Disposal System Accepts all solid and liquid wastes No preprocessing Include hazardous/toxic materials, medical wastes, asbestos, tyres, etc. Closed loop system No direct gaseous emissions to the atmosphere No landfill requirements Total waste reclamation Recover total fuel value of wastes Produce salable residues (e.g., metal and aggregates)
26 Plasma Arc Technology Remediation Experience Heavy metals Radioactive wastes Industrial sludges Municipal solid waste Electric arc furnace dust Liquid/solid organic wastes PCB s Asbestos Chemical wastes Medical wastes Plastics Petroleum waste Tyres
27
28
29 SAMPLE DIOXIN/FURAN EMISSION DATA FROM GASIFICATION/HAZ WASTE TREATMENT CONCENTRATION PCDD/PCDF'S (ng/dscm), TEQ CONCENTRATION PCDD/PCDF'S (ng/dscm), TEQ MACT*SITE ASITE B SITE CSITE DSITE E * Maximum Achievable Control Technology (MACT) imposed by US EPA on Hazardous Waste Incinerators
30 Concentration (ug/dscm) SAMPLE EMISSIONS DATA FROM PLASMA TREATMENT PROCESS Air Emissions of Selected Metals Measured Conc US EPA Std 20 0 Berylium Arsenic Cadmium Chromium Copper Iron Lead Mercury Nickel Metals DATA FROM PLASMA TREATMENT OF MEDICAL WASTE
31 CONCEN TRATION (mg/dscm SAMPLE EMISSIONS DATA FROM PLASMA TREATMENT PROCESS TOTAL SUSPENDED PARTICULATE MATTER Plasma System Terminal Treatment System Typical Incinerators SYSTEM US EPA Regulations DATA OBTAINED FROM PLASMA TREATMENT OF MEDICAL WASTE
32 Atonn Plasma Arc Combined system Coal feedstock MSW feedstock Syngas production 180, ,000cc/ton 30,000-33,000cc/ton Syngas Energy value Btu/scf Btu/scf Electricity generation 8,160kWper ton 1,360kW per ton 1000 tons 8,118,000cc/hr SG 1,353,000cc/hr SG Total Btu value 2,435,400,000Btu/hr 405,900,000Btu/hr Gross Electricity amount MWhr x MWhr x 24 Facility usage 104MWhr 26MWhr Available for supply MWhr 29.76MWhr
33 One technology which potentially can use various types of waste, produce electricity and hydrogen without emitting dioxin, furan and mercury, is Plasma arc technology. Municipalities can install a Plasma arc facility which will eliminate land filling U.S. Environmental Protection Agency Producing ultra-clean energy from gasification is the most environmentally attractive alternative to utilize solid fuels, including coal U.S. Department of Energy
34 U.S. House of Representatives passes historic legislative bill favouring Waste-to-Energy June 26, 2009 The American Clean Energy and Security Act of 2009 (H.R.2454)
35 Benefits of Waste-to-Energy 1. Generate reliable steady 24 x 7 electricity 2. Clean up Nigeria today & future 3. Reclamation of existing landfills 4. Provide employment 5. Reduce greenhouse gas emission 6. Carbon capture 7. Improve society health 8. Compliment existing waste management
36 Business Models PPP(Public Private Partnership): Franchise BOT/BOOT/BROT/BLT BOO (Build, Own and Operate) Private Finance Initiative Divestiture
37 PPP Business Models 1. Ownership of capital assets 2. Responsibility for investment 3. Assumption of risks 4. Construction/Build/Supply 5. Operation management 6. Maintenance
38 PPP Business models Common denominator in all PPP: Concessions Land Duty waivers Tax incentives
39 Proposal Advantages BOO PPP Business model : 1. ZERO capital investment by Government 2. ZERO/minimal risk to Government 3. Pay only for Services & Products
40 Requirement from Government 1. MOU, Contractual Agreement & Power Purchase Agreement (PPA) 2. Commitment in form of Bank Guarantee for 3 years Electricity purchase & Tipping fees 3. Land (50 acres) for each facility (Concession) 4. Tax concession for infrastructure development (in accordance with tax laws for infrastructure development)
41 Implementation Within months of reconfirmation of Bank Guarantee Supplement facility within 4 7 months of reconfirmation of Bank Guarantee
42 Thank You Think Clean, Stay Healthy, Stay Safe