Transparency and GHG Reporting: Welcome to the Fishbowl. Georgette Reeves, Trinity Consultants
|
|
|
- Darrell Cobb
- 5 years ago
- Views:
Transcription
1 Transparency and GHG Reporting: Welcome to the Fishbowl Georgette Reeves, Trinity Consultants

2 Transparency and GHG Reporting: Welcome to the Fishbowl
3 Speaker s Contact Information Georgette Reeves Director, Oil and Gas Sector Services Trinity Consultants 9111 Jollyville Rd. Austin, TX (512) greeves@trinityconsultants.com
4 Setting Today s Tone I will be providing details from GHG reportsbut there is no judgement here! Not intended to call out reporters or make any one company feel bad about reporting. We are going to explore the wide range of data available to the general public and discuss its potential implications.
 Reporter Comparison Next Steps Updates to GHG Reporting for Oil and Gas Operators Discussion, Questions &")
5 Agenda Introduction- Who, What, and Why of GHG Reporting Overview of EPA s FLIGHT Tool Overview of Newly Available GHG Data (i.e., deferred data ) Reporter Comparison Next Steps Updates to GHG Reporting for Oil and Gas Operators Discussion, Questions & Answers

6 Introduction The Who, What and Why of GHG Reporting
 Bureau of Land Management EPA Non-Governmental Organizations")
7 Who is Looking? Government Accountability Office (GAO) Bureau of Land Management EPA Non-Governmental Organizations (NGOs) Climate change bloggers State and local agencies Other media Concerned citizens
8 Why Are They Looking? Used to develop policy to reduce GHGs For this industry: Methane reductions Used to develop state-specific or regional regulations Used to determine high-emitting activities Used to highlight major emitters Could be used to demonstrate emissions reductions
9 How Are They Looking? EPA s FLIGHT Tool Facility Level Information on GreenHouse gases Tool Complete data from 2014 and deferred data from was released on October 8, 2015.

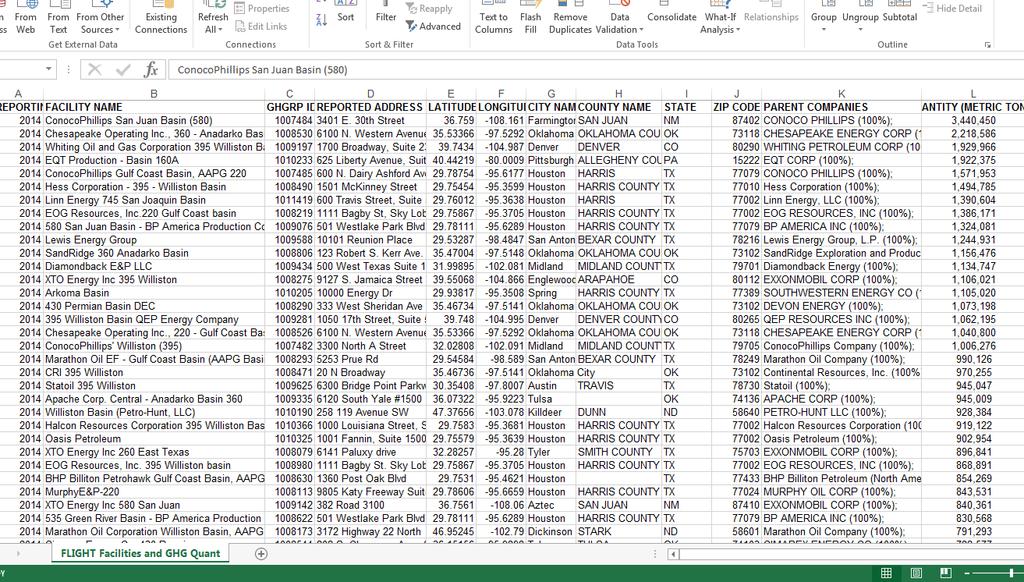
10 EPA s FLIGHT Tool: Transparency in GHG Reporting

11 Search for all operators within a basin; Search for a specific operator Search for a specific facility
12
13 Charting and Graphing Features Overall GHG Emissions, Nation- Wide (CO2e) Methane Emissions, Nation- Wide (CO2e) Many ways to manipulate the data based on basin and pollutant.

14 New Era of Reporting: Detailed Reports and Deferred Data
15 Previously Available ( ) Reporters names, addresses, basins of operation; Emissions rolled up by emission source type; Total emissions of CO2, CH4 and N2O in CO2e; and Trend comparisons.
16 Available Now ( ) This will highlight areas that have been inconsistent between operators This puts raw numbers into certain controversial activities Flaring Associated gas venting Completions/workovers
17 Available Now ( ) Generally, inputs into equations Actual count of high, low and intermittent bleed devices Actual count of pneumatic pumps Cumulative number of well venting for liquids unloading events Total count of gas well completions/workovers
18 Deferred Data Separator volumes to atmospheric storage tanks (by sub-basin) Quantities of CO2 and/or CH4 recovered from atmospheric storage tanks Total count of reciprocating and centrifugal compressors Total counts of wellheads, separators, meters/piping, heaters, dehydrators, headers
19 Why Does This Matter? This will make discrepancies between reporters more obvious. Why is one reporter reporting 18,000 pneumatic devices, and another reporting 24? Data will show when gas was vented rather than flared. Data will show amounts of gas vented or flared that were not captured and sold. What are the impacts on royalties? Does the GHG reported data match other data reported (for other reasons) to other agencies? Could this information reveal potential compliance issues?

20 Sample Study for Comparison A Tale of Nine Reporters
21 Sample Study for Comparison Selected 9 similarly sized operators (based on oil production) in one basin; Compared reported emissions; and Compared reported equipment counts. Not all reports were available online. All analysis is based on information retrieved from FLIGHT- it may not reflect updates provided to EPA after the reporting deadline.
 available, I will not name the individual companies included in this comparison, but remember; The media and blogger")
22 Disclaimer Data was released by EPA on October 9, and reports may not be downloading correctly. Although all data used in this comparison is publically (and easily) available, I will not name the individual companies included in this comparison, but remember; The media and blogger community will not likely understand how to reasonably identify and compare similar operators.
23 Emission Calculations and Equipment Counts Many GHG equations rely on equipment counts multiplied by an emission factor. Releasing the deferred data provides insight as to how those emissions are calculated; and Allows for easier comparison between operators.
24 Several Overarching Thoughts Subpart W only requires Onshore Oil and Natural Gas Production reporters to report emissions from equipment and activities on a single well pad or associated with a single well pad. Be cognizant of how reported emissions data rolls up. Some data is reported on a basin level, and should not be used in a more granular fashion.
25 Overall Reported Emissions vs. Equipment Total reported emissions from Onshore Oil & Gas Production (MT CO2e) Count of Wellheads Count of Separators Count of Meters/Piping Count of Compressors Count of In-line Heaters Count of Heater Treaters Count of Headers 275,449 17, , ,543 11, ,591 11, ,163 4, ,722 4,250 1,259 1, ,259 1,259 1,073,198 2,907 2, ,871 1,430 1, ,940 1, ,

26 Pneumatic Devices Actual count and classification shows large discrepancy among operators on the number of devices. What do operators consider to be pneumatic devices? Two operators reported 0 pneumatic devices.
27 Pneumatic Devices Count: High Bleed Count: Low Bleed Count: Intermittent Bleed , , , ,
28 Well Venting for Liquids Unloading Four (4) of the selected operators reported emissions from well venting from liquids unloading. The cumulative number of unloadings were:

29 Flare Volumes This will likely be a hot topic. Emissions from flaring have always been included, but; Volumes would have been difficult to derive based on previously reported information. Author: David Wogan; December 27, 2012
30 Flare Volumes Flaring can be reported in multiple places: Under Flaring; OR Under Associated Gas Venting or Flaring; OR Under Well Testing Venting or Flaring OR Under the piece of equipment controlled by a flare. Only the volume of gas reported under Flaring is available on the reports.

31 Flare Volumes Could raise questions Why did you flare the gas instead of selling the gas? Why did you flare the gas instead of shutting in the well? Why did you flare so much more than other companies that did not flare at all?
32 Flare Volumes Of the nine selected operators, five (5) reported volumes of gas flared. Volumes are reported in actual cubic feet per year 728,538,540 scf 728,538.5 Mscf 44,123,510 scf 44,123.5 Mscf 3,106,571,094 scf 3,106,571.1 Mscf 654,329,462 scf 654,329.5 Mscf 7,040,585 scf 7,040.6 Mscf

33 Associated Gas Venting and Flaring Number of Wells Venting Associated Gas Number of Wells Flaring Associated Gas Count of Wellheads , , , , , ,015 2, , ,

34 Next steps: Adapting to transparency

35 If The Press Calls Know your company s procedure for talking to/dealing with members of the press. Consider developing a procedure if one is not in place. Review public reports: who will be likely to get the call? Always assume comments are on the record. Don t rush to answer all questions during a conversation- offer to follow up when the answer may not be straightforward.
36 Benchmarking Use this wealth of data to benchmark your own GHG reports. You likely know comparable operators be selective in how you compare data. Is your report too high? Too low? Can you pinpoint the reasons for the difference? Tricky because you can t speak to someone else s report, only your own.
37 Benchmarking There is no penalty for correcting or updating previously submitted reports. Although, there is a timeframe within which you need to correct a report if an error is discovered. These reports tell a story- what story does yours tell?

38 Updates to GHG Reporting: Effective January 1st 40 CFR Part 98, Subpart W
39 Subpart W Updates Data collection begins January 1, 2016, first reports due in 2017 Monitoring Plans should be updated (presumably by April 1) Updates to the Onshore Production segment: Expands GHG reporting requirements for completions and workovers that have a GOR 300 scf/stb; and Adds requirements for reporting well ID numbers for well specific activities. Creates a new segment, Onshore Petroleum and Natural Gas Gathering and Boosting Systems Exempts vacuum and gathering pipelines with a GOR less than 300 scf/stb Creates a new segment, Natural Gas Transmission Pipelines Adds availability to use Best Available Monitoring Methods (BAMM) for 2016
40 Onshore Petroleum and Natural Gas Gathering and Boosting Gathering and boosting system means a single network of pipelines, compressors and process equipment, including equipment to perform natural gas compression, dehydration, and acid gas removal, that has one or more connection points to gas and oil production and a downstream endpoint, typically a gas processing plant, a transmission pipeline, LDC pipeline, or other gathering and boosting system.
41 Onshore Petroleum and Natural Gas Gathering and Boosting Facility must exceed 25,000 MT CO2e. Include emissions from: Natural gas pneumatic devices; Natural gas driven pneumatic pumps; Acid gas removal vents; Dehydrators; Blowdown vents; Storage tanks; Flares; Reciprocating/centrifugal compressor venting; Equipment leaks; Gathering pipeline equipment leaks; Combustion emissions from stationary or portable fuel combustion equipment (including leased, contracted and portable equipment); and Stationary combustion.
42 Onshore Petroleum and Natural Gas Gathering and Boosting Facility with respect to onshore petroleum and natural gas gathering and boosting for purposes of reporting under this subpart and for the corresponding subpart A requirements means all gathering pipelines and other equipment located along those pipelines that are under common ownership or common control by a gathering and boosting system owner or operator and that are located in a single hydrocarbon basin as defined in this section. Where a person owns or operates more than one gathering and boosting system in a basin then all gathering and boosting equipment that the person owns or operates in the basin would be considered one facility. Any gathering and boosting equipment that is associated with a single gathering and boosting system, including leased, rented or contracted activities, is considered to be under common control of the owner or operator of the gathering and boosting system that contains the pipeline. The facility does not include equipment and pipelines that are part of any other industry segment defined in this subpart.
43 Onshore Petroleum and Natural Gas Gathering and Boosting Gathering and boosting system owner or operator means any person that holds a contract in which they agree to transport petroleum or natural gas from one or more onshore petroleum and natural gas production wells to a natural gas processing facility, another gathering and boosting system, a natural gas transmission pipeline, or a distribution pipeline, or any person responsible for the custody of the petroleum or natural gas transported.
44 Natural Gas Transmission Pipeline If the facility emits more than 25,000 MT CO2e, it is subject to reporting. Report pipeline blowdown emissions of CO 2 and CH 4 from blowdown vent stacks.
45 Onshore Natural Gas Transmission Pipeline Facility with respect to the onshore natural gas transmission pipeline segment means the total U.S. mileage of natural gas transmission pipelines, as defined in this section, owned and operated by an onshore natural gas transmission pipeline owner or operator The facility does not include pipelines that are part of any other industry segment as defined in this subpart.

46 Discussion Ms. Georgette Reeves, MPA Director, Oil and Gas Sector Services Trinity Consultants (512)
47 Please remember to fill out the conference survey. This will be sent to you by . Conference participants are eligible for up to 13 contact hours 1.3 CEUs. Forms will be available after lunch on Wednesday at the registration are. Return completed forms at the conclusion of the conference.