SEEA Central Framework
|
|
|
- Audrey Booker
- 5 years ago
- Views:
Transcription
1 Statistical Commission Forty-third session 28 February 2 March 2012 Item 3 (e) of the provisional agenda Environmental-economic accounting Background document Available in English only REVISION OF THE SYSTEM OF ENVIRONMENTAL - ECONOMIC ACCOUNTING (SEEA) SEEA Central Framework Chapter 3 Physical flow accounts Prepared by the Committee of Experts on Environmental Economic Accounting
2 REVISION OF THE SYSTEM OF ENVIRONMENTAL - ECONOMIC ACCOUNTING (SEEA) Committee of Experts on Environmental Economic Accounting Statistics Division / Department of Economic and Social Affairs, United Nations SEEA Central Framework Draft subject to final editing Chapter 3: Physical flow accounts Table of contents 3.1 Introduction The physical flow accounting framework and sub-systems Chapter structure The physical flow accounting framework The physical supply and use table approach Definition and classification of natural inputs Definition and classification of products Definition and classification of residuals Principles of physical flow accounting Introduction Gross and net recording of physical flows Treatment of international flows Treatment of goods for processing Physical flow accounts for energy Introduction Scope and definition of energy flows Physical supply and use table for energy Energy statistics, energy accounts and energy balances Energy aggregates Physical flow accounts for water Introduction Scope of water flows Physical supply and use table for water Water aggregates
3 3.6 Physical flow accounts for materials Introduction Product flow accounting Accounting for air emissions Accounting for emissions to water and associated releases to economic units Solid waste accounts Economy wide Material Flow Accounts (EW-MFA)
4 3.1 Introduction 3.1 An economy cannot function without drawing in natural resources and other inputs from the environment and using the environment to absorb the unwanted by-products of economic production. Measuring the flows of natural inputs into the economy and releases of residuals from the economy can therefore provide instructive information. This measurement is generally carried out using physical units of measure. 3.2 The usefulness of accounting for physical flows is considerably strengthened when they are organised using the same framework as used to assess economic flows in monetary terms. The use of the same framework allows consistent analysis of the relationships between the flows of natural inputs and economic activity, the relationships between economic activity and the releases from the economy, and significantly, the relationships between the flows in physical and monetary terms. The organisation and combined presentation of both physical and monetary flows on specific topics is discussed in Chapter The framework for measuring physical and monetary flows is also aligned with the framework for the measurement of environmental assets as presented in Chapter 5. This is a particularly important connection for natural resource flows and for the assessment of production processes in extracting industries. Relevant flows are recorded both in the asset accounts and in physical supply and use tables. 3.4 The use of the SEEA framework allows robust indicators to be established concerning the consumption of resources relative to economic indicators such as output and value added, since there is a parallel in the underlying accounting principles. Indicators on energy use, water consumption and air emissions by industry are further examples of the potential uses of data organised in a coherent and consistent manner. 3.5 The compilation of data on physical flows requires the use of a range of data sources and classifications. While this chapter provides an overall framework for this compilation work, more detailed guidance on specific topics, for example energy, air emissions and water, can be found in other handbooks, manuals and guidelines. References to relevant publications are presented at the end of this book. 3.6 At one level, measuring physical flows requires large amounts of basic data, consistent classifications and measurement units, and an agreed framework within which data can be structured at different levels of disaggregation. At another level, within the same framework, more aggregate measures of physical flows may be compiled perhaps focusing only on specific types of flows (e.g. the use of energy by households for transport, or the abstraction of water for use in agriculture). 3.7 Therefore, while this chapter provides a comprehensive explanation of the systems of physical flow accounting in common use, it should be recognized that a complete 56
5 implementation of the accounts presented here is ambitious and by no means always necessary since useful analysis can be done with any of the individual components of a full set of physical flow accounts The physical flow accounting framework and sub-systems 3.8 The physical flow accounting framework presented in this chapter provides a set of accounting principles and boundaries within which a consistent recording of all types of physical flows relating to economic activity can be made. Most commonly, the recording of physical flows will focus on particular areas of interest, such as flows of energy or water. In part this is because physical flows may be measured in a variety of units that cannot necessarily be compared or aggregated. It is also due to the breadth and complexity of recording all relevant physical flows in a single account. Therefore, while the chapter presents a complete accounting framework for all physical flows it is expected that compilers will focus on the application of the general principles in specific areas, such as the measurement of physical flows of energy, water, air emissions and solid waste. 3.9 The framework for the measurement of physical flows is based on the structure of the monetary supply and use tables used to measure economic activity. In broad terms these tables show transactions in products between industries, households, government and the rest of the world. These tables are based on the principles outlined in the 2008 SNA and are introduced in Chapter The same structure can be used to record the underlying physical flows relating to the transactions between the different economic units. Further, flows to and from the environment can be linked in by adding relevant columns and rows to the monetary supply and use table. These additions yield a physical supply and use table (PSUT) that can record all physical flows: (i) from the environment, (ii) within the economy, and (iii) back to the environment However, unlike transactions, it is not immediately obvious that all physical flows can simply be aggregated or that all physical flows should be recorded in a similar way. Consequently, three different sub-systems have developed within the broad supply and use framework material flow accounting 11, water accounts and energy accounts In all three sub-systems the scope of physical flow accounting includes flows from the environment to the economy, flows within the economy, and flows back to the environment. However, in each sub-system different measurement units are generally used. In material flow accounting flows are measured in terms of mass (e.g. tonnes). In water accounts the unit of measurement is volume (e.g. cubic metres) and in energy 11 Material flow accounting includes the recording of physical flows of products, air emissions, solid waste and other residual flows. 57
6 accounts the unit of measurement is energy content (e.g. joules) 12. While all three subsystem only represent part of the total physical flows, each sub-system is a complete and balanced system of flows Within each of these sub-systems of physical flow accounting finer levels of focus can be undertaken consistent with the general principles of PSUT. This is especially the case for material flow accounts. At an aggregate national level, i.e. summing all industries, Economy Wide Material Flow Accounts (EW-MFA) can be compiled. At the same time, it is also possible to focus on detailed accounts relating to individual products, or on the flows of specific types of residuals such as emissions to air or solid waste Within all sub-systems there may also be interest in looking at only one part of the physical flows, for example energy use by industries and households, rather than considering these flows in conjunction with all PSUT related flows. Nonetheless, even in this narrower case, the same concepts, definitions and standards are applied such that the organisation of data and the development of broader information systems can be supported Chapter structure 3.15 This chapter explains the physical supply and use approach in Section 3.2 including definitions of natural inputs, products and residuals. These definitions are fundamental in defining the boundaries between the environment and the economy and hence in constructing meaningful supply and use tables In Section 3.3 a range of general accounting matters are discussed including gross and net recording of flows and the treatment of flows between countries The final three sections of the chapter discuss the measurement of individual physical flow accounts. Energy accounts are discussed in Section 3.4, Water accounts are discussed in Section 3.5, and a number of material flow accounts, including air emission, water emission and solid waste accounts, are discussed in Section Energy content is measured on a net calorific value basis. Energy accounts may also be measured in terms of the mass or volume of particular energy products but such accounts exclude the energy supplied from renewable sources such as solar and wind energy and are not discussed in this chapter. 58
7 3.2 The physical flow accounting framework 3.18 This section introduces the supply and use approach to physical flow accounting through the introduction of the broad framework and its underlying accounting principles and then the definitions of the three key flows natural inputs, products and residuals The physical supply and use table approach 3.19 As explained in Chapter 2, in the context of measuring physical flows related to supply and use, the economy is defined by the production boundary of the SNA. The production boundary comprises a specific set of economic activities carried out under the control and responsibility of institutional units in which inputs of labour, capital, and goods and services are used to produce outputs of goods and services (products). 13 The SEEA recognises that some of the inputs (natural inputs of materials and energy) come from the environment and that, as a result of the production, consumption and accumulation of products, a range of other physical flows occur that can result in materials and energy returning to the environment Flows from the environment into the economy are referred to as natural inputs, flows within the economy consist of either products or residuals, and flows from the economy to the environment are residuals. This series of flows is represented in Figure Some natural inputs, after entering the economy, are recorded as immediately returning to the environment as they are no longer required by the economy. Natural inputs that are not used in production, for example mining overburden, mine dewatering and discarded catch in fishing are called natural resource residuals. Also, some residuals remain in the economy rather than returning directly to the environment, for example solid waste collected and stored in controlled landfills. 13 The SNA production boundary is described in detail in 2008 SNA paragraphs
8 Figure Physical flows in relation to the production boundary of the economy 3.21 The underlying framework for the recording of physical flows follows the monetary supply and use tables for products as defined in the SNA and summarised in SEEA Chapter 2. The monetary supply and use table covers all flows of goods and services within the production boundary of the SNA The intent in physical flow accounting is to record the physical flows underpinning the transactions recorded in the monetary supply and use tables, primarily with respect to goods, and then to extend the monetary supply and use table to record physical flows from the environment to the economy (such as flows of natural resources) and physical flows from the economy to the environment (such as emissions to air and water) Conceptually, flows solely within the environment are out of scope of physical supply and use tables although there may be instances where the recording of such flows is useful for analytical purposes. Examples of these flows include the evaporation and precipitation of water and soil moved through soil erosion. The asset accounts presented in Chapter 5 include flows within the environment to the extent that the flows reflect changes in the stock of environmental assets This general framework of flows may be applied in the case of individual commodities or groups of commodities. For example, flows of the hazardous element mercury might be tracked from the point it is extracted from the environment, circulated within the economy and released to the environment. Alternatively, there may be interest in only analysing physical flows into the economy or out of the economy without necessarily linking the two. For example, the analysis of solid waste will focus on flows 60
9 within the economy (for example, flows to waste treatment plants) and from the economy to the environment, but not on flows from the environment to the economy The general framework for the full articulation of physical flows is shown in Table in the form of a physical supply and use table (PSUT). A full articulation of all flows is generally most relevant for energy and water where all flows can be meaningfully expressed in a single unit e.g. joules or cubic metres The rows of the table show the types of natural inputs, products and residuals. The rows for natural inputs and residuals are an extension in the PSUT compared to the monetary supply and use table in the SNA. The top half of the table, the supply table, shows the flows relating to the production, generation, and supply of natural inputs, products and residuals by different economic units or the environment. The bottom half of the table, the use table, shows the flows relating to the consumption and use of natural inputs, products and residuals by different economic units or the environment. Each of these flows is defined and discussed in detail later in this section The columns of the PSUT are structured to reflect both the activity underlying the flow (e.g. whether it is related to production, consumption or accumulation), and the economic units involved. The first column covers the use of natural inputs, the production and intermediate consumption of products, and the generation and receipt of residuals by all enterprises in the economy. It is classified by industry using ISIC The second column covers the consumption of products by households and the generation of residuals from this consumption. The activity of households in extracting and collecting natural inputs from the environment for their own consumption is a productive activity and hence this activity should be recorded in the first column under a relevant industry class Unlike the monetary supply and use table, no entries in physical terms are made in relation to government final consumption expenditure. Government final consumption expenditure represents the acquisition and consumption by governments of their own output and does not have any direct associated physical flow. All of the physical flows related to the intermediate consumption of governments, e.g. paper, electricity, etc, are recorded in the first column under the relevant industry class (commonly public administration). The generation of residuals by governments in the production of their output is also recorded in the first column There may be analytical interest in distinguishing the non-market productive activity of households and governments from the market activity within particular industries (e.g. the abstraction of water on own-account by households for final consumption). In these 14 The approach to compiling a PSUT in the Central Framework through a focus on physical flows is quite distinct from an approach to estimating PSUT based on applying appropriate price indexes to cells in monetary supply and use tables. A price index approach is not considered in the Central Framework and represents a narrower conceptualisation concerning the recording of physical flows than explained here. 61
10 cases alternative presentations of PSUT may be developed where the information on the relevant productive activity, which is an of-which within a broader industry class, is re-arranged and shown next to other flows associated with households (e.g. final consumption) or government The third column, labelled accumulation, concerns changes in the stock of materials and energy in the economy. From a supply perspective, this column records reductions in the physical stock of produced assets through, for example, demolition or scrapping. It also shows emissions from controlled landfill sites which result from materials discarded in previous accounting periods. From a use perspective, the accumulation column records additions to the physical stock of produced assets (gross capital formation) and the accumulation over an accounting period of materials in controlled landfill sites. Amounts of water, energy and materials that are incorporated into other products are also recorded in the accumulation column in the use table Accumulation flows may be classified by industry using ISIC and, if so, can be combined with industry level information from the first column to provide an overall assessment of flows of residuals by industry. At the same time, retaining the distinction between residuals from current activity (from the first column) and residuals from past activity (from the third column) may be important for some analyses. Alternatively, the accumulation flows may be classified by product, for example by type of scrapped produced asset. Further discussion on the recording of scrapped and demolished produced assets is included later in this section The fourth column recognises the exchanges between national economies in the form of imports and exports of products and flows of residuals. Residuals received from the rest of the world and sent to the rest of the world primarily concern the movement of solid waste between different economies. Excluded from these flows are so-called transboundary flows, for example polluted water flowing downstream into a neighbouring country or air emissions transferred into other countries atmospheres. Transboundary flows are considered flows within the environment and hence are out of scope of the PSUT framework. Where relevant, these flows may be recorded as supplementary items. They may also be relevant in a broader assessment of the state of the environment, for example in assessments of the quality of water resources over time. 62
11 Table General physical supply and use table SUPPLY Production; Generation of residuals Accumulation Flows from the Rest of the World Production; Generation of residuals Generation of Industries - classified by by industries (incl. household residuals by ISIC production on own account) - households classified by ISIC Flows from the Environment Natural inputs A. Flows from the environment (incl. natural resource residuals) Total Total Supply of Natural Inputs (TSNI) Products C. Output (incl sale of recycled and reused products) D. Imports of products Total Supply of Products (TSP) Residuals TOTAL SUPPLY I1. Residuals generated by industry (incl. natural resource residuals) I2. Residuals generated following treatment J. Residuals generated by household final consumption K1. Residuals from scrapping and demolition of produced assets K2. Emissions from controlled landfill sites L. Residuals received from rest of the world M. Residuals recovered from the environment Total Supply of Residuals (TSR) USE Intermediate consumption of products; Use of natural inputs; Collection of residuals Final consumption* Accumulation Flows to the Rest of the World 63 Flows to the Environment Industries - classified by ISIC Households Industries - classified by ISIC Natural inputs B. Extraction of natural inputs Total Use of Natural Inputs (TUNI) Products Residuals B1. Extraction used in production B2. Natural resource residuals E. Intermediate consumption (incl purchase of recycled and reused products) N. Collection and treatment of residuals (excl accumulation in controlled landfill sites) F. Household final consumption (incl purchase of recycled and reused products) G. Gross Capital Formation (incl. fixed assets and inventories) O. Accumulation of waste in controlled landfill sites H. Exports of products P. Residuals sent to the rest of the world Q. Residual flows to the environment Q1. Direct from industry and households (incl. natural resource residuals & landfill emissions) Q2.Following treatment Total Total Use of Products (TUP) Total Use of Residuals (TUR) TOTAL USE *No entries for government final consumption are recorded in physical terms. All government intermediate consumption, production and generation of residuals is recorded against the relevant industry in the first column of the PSUT.
12 3.34 The fifth column is the significant addition to the monetary supply and use table structure. In this column flows to and from the environment are recorded. Within the PSUT the environment is a passive entity that does not undertake production, consumption or accumulation in the same way as units inside the economy. Nonetheless, the incorporation of the environmental column allows a full accounting for flows of natural inputs and residuals that would otherwise not be possible. Accounting and balancing identities 3.35 The PSUT contains a range of important accounting and balancing identities. The starting point for the balancing of the PSUT is the supply and use identity, which recognises that, within the economy, the amount of a product supplied must also be used within the economy, most likely by a range of different economic units, or exported. Thus (using references to the cells in Table 3.2.1) Total Supply of Products (TSP) = Domestic production (C) + Imports (D) is identical to Total Use of Products (TUP) = Intermediate consumption (E) + Household Final Consumption (F) + Gross capital formation (G) + Exports (H) 3.36 The supply and use identity for products also applies in the monetary supply and use table. In the PSUT the supply and use identity is also applied to flows of natural inputs and residuals such that the total supply of natural inputs must equal the total use of natural inputs (TSNI = TUNI) and the total supply of residuals must equal the total use of residuals (TSR = TUR) When applied to all three types of physical flows these equalities also relate to the fundamental physical identities underpinning the physical supply and use tables, i.e. the conservation of mass and the conservation of energy. These physical identities imply the existence of material and energy balances for all individual materials within the system It can be shown that, over an accounting period, flows of materials into an economy must equal the flows of materials out of an economy plus any net additions to stock in the economy. This is known as the input-output identity. The net additions to the stock comprise additions and deductions over an accounting period in (i) gross capital formation in investment goods and inventories of products; (ii) physical flows of residuals to and from the rest of the world; (iii) residuals recovered from the environment (e.g. oil collected following an oil spill) and (iv) the accumulation of solid waste in controlled landfill sites (excluding emissions from these sites) Thus the input-output identity describing the physical flows between an economy and the environment is as follows (using references to the cells in Table 3.2.1) Materials into the economy = Natural inputs (A) + Imports (D) + Residuals received from the rest of the world (L) + Residuals recovered from the environment (M) is equal to 64
13 Materials out of the economy = Residual flows to the environment (Q) + Exports (H) + Residuals sent to the rest of the world (P) plus Net additions to stock in the economy = Gross capital formation (G) + Accumulation in controlled landfill sites (O) - Residuals from produced assets and controlled landfill sites (K) 3.40 This identity may be applied at the level of an entire economy (as described) and also at the level of an individual industry or household where notions of imports and exports relate to flows to and from the rest of the economy as well as to the rest of the world Particular note is made regarding the flows of residuals. For these flows a number of stages need to be recognised. In the first stage, residuals are generated or come into the economy as reflected in cells (I1 and J to M) in Table These residuals are received by other units in the economy (N), accumulate in controlled landfills (O), sent to other countries (P) or returned to the environment (Q1). The residuals received by other units (N) may be treated or processed and then either sold as recycled or reused products (for example reused water) or returned to the environment. If sold as recycled or reused products the production is recorded in (C) and the purchase in (E) or (F). The supply of the residual to the environment (possibly after treatment) is recorded in (I2) and the use in (Q2) Natural resource residuals are shown as entering the economy from the environment (A and B2) and then returning to the environment (I1 and Q1). Unlike natural inputs that are used in production there are no flows of natural resource residuals in the product rows of the PSUT In practice, a complete PSUT is rarely compiled other than for energy and water. Nonetheless, these accounting identities and a common set of accounting principles can be applied even where only individual commodities or small groups of similar commodities are being recorded. In particular, clear boundaries about the point of transition between the environment and the economy must be used The following parts explain the general definitions and boundary issues relating to natural inputs, products and residuals. 65
14 3.2.2 Definition and classification of natural inputs 3.45 Natural inputs are all physical inputs that are moved from their location in the environment as a part of economic production processes or are directly used in production The three broad classes of natural inputs are natural resource inputs, inputs from renewable energy sources and other natural inputs as presented in Table This section discusses each of these classes and notes some specific measurement issues for natural resource inputs concerning the flows of resources affected by extraction processes but not used by the economy (i.e. natural resource residuals) and the treatment of cultivated biological resources. Natural resource inputs 3.47 Natural resource inputs comprise physical inputs to the economy from natural resources. Thus natural resource inputs comprise inputs from mineral and energy resources, soil resources, natural timber resources, natural aquatic resources, other natural biological resources and water resources. Natural resource inputs exclude the flows from cultivated biological resources. Cultivated biological resources are produced within the economy and hence are not flows from the environment For natural resources, the point at which they are recognised as entering the economy needs to be defined for each type of resource. It is recognised that some amount of economic production must be undertaken before a natural resource can be considered extracted and hence it is a matter of determining the point at which the natural resource is best meaningfully described as extracted, and hence enters the economy as part of a longer production process All natural resource inputs are recorded as entering the economy from the environment. The majority of natural resource inputs that enter the economy become products (e.g. extracted minerals, removals of timber, water abstracted for distribution). However, some natural resource inputs do not subsequently become products and instead immediately return to the environment. These flows are termed natural resource residuals. 66
15 Table Classes of Natural Inputs Natural resource inputs Extraction used in production Mineral and energy resources Oil resources Natural gas resources Coal and peat resources Non-metallic minerals (excl. coal & peat) Metallic minerals Soil resources (excavated) Natural timber resources Natural aquatic resources Other natural biological resources (excluding timber and aquatic resources) Water resources Surface water Groundwater Soil water Natural resource residuals Inputs of energy from renewable sources Solar Hydro Wind Wave and tidal Geothermal Other electricity and heat Other natural inputs Inputs from soil Inputs from air Soil nutrients Soil carbon Other inputs from soil Nitrogen Oxygen Carbon dioxide Other inputs from air Other natural inputs n.e.c There are three types of natural resource residuals i. Losses during extraction which cover resources that the extractor would prefer to retain (for example losses of gas through flaring and venting); ii. Unused extraction which covers resources in which the extractor has no ongoing interest (for example mining overburden, mine de-watering and discarded catch) 15 ; and 15 In some cases, natural resource residuals can be collected and used for other purposes than the primary output of the extractor or by other economic units. Examples include the harvest of timber felling residues 67
16 iii. Reinjections. These flows cover natural resources that are extracted but are immediately returned to the deposit and may be re-extracted at a later time (e.g. water reinjected into an aquifer and natural gas reinjected into a reservoir) Table presents examples of different natural resource inputs. It separates the quantities of resource extracted into those amounts that are intended and available for use in the economy (i.e. extraction used in production) and those amounts that return to the environment (i.e. natural resource residuals). In general terms the point of entry to the economy is the point at which the resource is available for further processing. The notion of processing includes the transportation of the resource, i.e. the extraction point should be as close to the physical location of the resource as possible In some cases there is a clear link between the class of natural resource that is extracted and the associated natural resource residual. For example, felling residues are in the same class of natural input as removals of timber resources. However, in some cases the classes are different. For example, for soil and rock moved in the extraction of minerals, the total natural resource input will be a combination of the minerals extracted and the soil and rock moved (mining overburden) In situations where a natural resource residual is subsequently sold, for example sales of felling residues for fuelwood, the flows are recorded as extraction used in production. The recording of extractions used in production and natural resource residuals is consistent with the recording of extraction in the asset accounts described in Chapter 5. Table Examples of natural resource inputs Natural resource Extraction used in production Natural Resource Residual Mineral and energy resources Soil resources Gross ore Crude oil Natural gas Excavated soil used for agricultural, construction and land reclamation purposes Mining overburden Flaring, venting at well head Reinjection of natural gas Dredgings Unused excavated soil Natural timber resources Removals of timber Felling residues Natural fish resources Gross catch less discarded catch Discarded catch Other natural biological Harvest/capture Harvest/capture residues resources Water resources Abstracted water Mine dewatering Biological resources 3.54 Biological resources require special consideration in the determination of the boundary between the environment and the economy. To ensure consistency with the production boundary, a distinction must be made between those resources that are by households for fuelwood, or the use of mining overburden to provide materials for road construction. In these cases, the quantities collected should be recorded as extraction incorporated into products rather than under natural resource residuals flowing to the environment. 68
17 considered to be cultivated as part of a process of production (cultivated biological resources) and those biological resources that are not produced (natural biological resources) The criteria used to make the distinction include the extent of direct control, responsibility and management over the growth and regeneration of the biological resource. These criteria are discussed in greater detail in Chapter 5 with regard to timber resources (Section 5.8) and aquatic resources (Section 5.9). A consistent application of the criteria should be maintained for the purposes of both asset accounts and physical flow accounts Applying the distinction is important because the accounting treatment varies depending on whether the resource is natural or cultivated. For natural biological resources the resources are considered inputs to the economy at the time they are extracted following the logic presented in Table However, cultivated biological resources are not considered natural resource inputs and are instead treated as growing within the economy This difference in treatment has implications for the recording of other physical flows. For natural biological resources, the use of oxygen and nitrogen, and the uptake of soil nutrients and water are treated as flows within the environment and only the actual harvest of resources is considered to flow into the economy For cultivated biological resources, a complete accounting of physical flows requires the recording of the nutrients and other substances absorbed from the environment as natural inputs, since the biological resources themselves are already in the economy. The physical flows resulting from metabolism (e.g. photosynthesis and respiration) and transpiration are either embodied in products or return to the environment as residuals. Inputs of energy from renewable sources 3.59 Inputs of energy from renewable sources are the non-fuel sources of energy provided by the environment. These are increasingly important sources of energy for economies in many countries. Inclusion of these inputs provides a basis for a complete balance of the flows of energy between the environment and the economy when measured in terms of energy content (joules). Inputs of energy from renewable sources are classified by different sources such as, but not limited to, solar energy, hydropower, wind energy, wave energy and geothermal energy. Inputs of energy sourced from natural resources, such as natural timber resources, are not included under this heading, nor does it include energy inputs from cultivated timber resources, other cultivated biomass, or from solid waste Estimates of inputs of energy from renewable sources should reflect the amount of energy incident on the technology put in place to collect the energy e.g. solar panel, wind turbine, etc. Estimates should not be based on the total potential energy that might be harnessed particularly where there is no equipment in place to capture the 69
18 energy. In practice, estimates of inputs of energy from renewable sources will generally reflect the amount of energy actually produced, commonly but not exclusively, in the form of electricity Special consideration is required with regard to hydropower since, depending on the physical flow accounting involved, the relevant natural inputs may be recorded as inputs from renewable energy sources or natural resource inputs. For the purposes of compiling energy accounts, the entries concerning the flows from the environment should be considered inputs from renewable energy sources equal to the electricity produced by the hydro power plant, measured in joules. For water accounts, the flows from the environment should be recorded as natural resource inputs of water resources equal to the volume of water that passes through a hydropower plant. No double counting is implied since each of these accounts is compiled separately in different units for different purposes. Other natural inputs Inputs from soil 3.62 Inputs from soil comprise nutrients and other elements present in the soil that are absorbed by the economy during production processes. Inputs from soil include nutrients (e.g. nitrogen, phosphorous and potassium) absorbed by cultivated plants as they grow. By convention, the carbon bound in soil that is released to the environment as the result of cultivation is recorded as an input from soil in order to ensure a balance in the overall system. Only the amounts actually absorbed or released are considered natural inputs. Note that these inputs are distinct from the bulk extraction and movement of soil resources that is included under natural resource inputs. Inputs of soil water to the economy are recorded as part of water resources within natural resource inputs. Inputs from air 3.63 Inputs from air comprise substances taken in by the economy from the air for purposes of production and consumption. They include the compounds and elements (including nitrogen, oxygen and carbon dioxide) used by cultivated biological resources and the substances absorbed during combustion and other industrial processes. They are part of the structure of PSUT as they enable a balance of materials to be recorded in the system. 70
19 3.2.3 Definition and classification of products 3.64 Following the SNA, products are goods and services that result from a process of production in the economy. The scope of products included in physical flow accounts is limited to those with positive monetary value For an individual enterprise, different types of production may be recorded. Products that are sold to other economic units are considered to result from either the primary or secondary production of the enterprise depending the relative significance of the product. In principle, the enterprises that produce the same primary products are grouped to the same industry class In some cases, products are produced on own-account. This occurs when they are not sold to other economic units but they are used either directly for the final consumption of the producer (e.g. production of agricultural output consumed by farmers) or they are a form of capital formation (e.g. own-account construction of a house). In both cases the physical flows should be recorded to ensure consistency with the output and production boundaries of the monetary supply and use tables An enterprise may also undertake ancillary production. This generally involves the production of supporting services (such as accounting, employment, cleaning, transport services) that might be purchased from other enterprises but are produced inhouse to support the production of primary and secondary products. The SNA recommends that only in cases where ancillary production is significant should distinct measures of output for the production of these different services be recorded. In these cases, separate establishments should be created that are treated as undertaking the ancillary production. However, in most cases, the production of these services is not recorded as a separate set of outputs and rather the relevant inputs are recorded as comprising part of the overall inputs to the production of the enterprise s primary and secondary products There are also some products that are used as part of production processes within an enterprise (intra-enterprise flows) that are not recognized by monetary transactions in the SNA. For example, electricity generated through the incineration of solid waste for use within a firm would not be recorded in monetary terms in the SNA. For physical flow accounting, these intra-enterprise flows may be recorded since there are physical flows that take place. However, the extent of recording should be consistent with the analytical purpose at hand There are many situations in which households undertake production involving the extraction or collection of natural resource inputs and then consume this production on own-account. Examples include the collection of fuelwood, the abstraction of water, and fish caught in recreational fishing. In these cases, the production is recorded as part of the production of the relevant economic activity in the industry column of the PSUT. Consistently, the use of natural inputs by households is also recorded in the industry column. Depending on the significance of the activity it may be useful to separate this production from that of other units undertaking the same activity. The corresponding household final consumption of own-account production is shown in the second column of 71
20 the PSUT An important product flow in the PSUT framework is the flow of fertilisers, including those fertilisers produced on own-accounts such as manure. The spreading of fertilisers on to soil results in two flows. First, there are nutrients that are absorbed by the crops and this amount is considered a product flow that is, it remains within the economy. Second, there are nutrients that are not absorbed. These are recorded as flows of residuals from the dissipative use of products Products may be either goods or services. In general, the product component of physical flow accounts will focus on goods that are transacted between economic units. However, in some cases, for example, the provision of wastewater treatment services, there may be an interest in comparing physical flows (e.g. the flow of wastewater into and out of a sewerage facility) with the associated payment for services. Classification of products 3.72 Generally, physical flows of products are classified using the Central Product Classification (CPC). For some specific accounts, for example energy and solid waste accounts, specialised product classifications may be appropriate. These are discussed in relevant sections Definition and classification of residuals 3.73 Residuals are flows of solid, liquid and gaseous materials, and energy that are discarded, discharged or emitted by establishments and households through processes of production, consumption or accumulation Residuals may be discarded, discharged or emitted directly to the environment or be captured, collected, treated, recycled or reused by economic units. These various transformation processes may lead to the generation of new products that are of economic value to the unit undertaking the transformation even if the residual, when first discarded or emitted has no economic value to the household or establishment discarding or emitting the residual In situations where the intent is to discard a product but the discarder receives money or other benefits in exchange for the discarded product, this is treated as a transaction in a product and not as a residual. These flows may be of particular interest in the compilation of solid waste accounts A distinction must be made between payments made by a generator of residuals to establishments that collect, treat or otherwise transform residuals and the flows of the residuals themselves. The payments made are treated as payments for services and are treated as transactions in products while the flows of residuals are recorded separately. 72
21 A specific case of this distinction concerns flows of solid waste between countries. The payments for the services provided for the transport and treatment of waste by other countries are recorded as imports and exports of services while the physical flows of waste are separately recorded as flows of residuals Residuals should be recorded at the time the emission or discard event takes place. The timing of the emission or discard event may be quite distinct from the time of the acquisition which is the appropriate time to record the flow from the perspective of the monetary accounts. A specific case concerns consumer durables such as refrigerators, washing machines, cars and other products that households use over extended periods of time. In the monetary accounts consumer durables are recorded as purchased and consumed in the same accounting period. This is in contrast to the treatment of fixed assets purchased by enterprises which are recorded as consumed over the operating life of the asset. Emissions from consumer durables and discards of consumer durables should be recorded at the time they occur even though the consumption activity will have been recorded in the monetary accounts in a previous period Controlled and managed landfill sites, emission capture and storage facilities, treatment plants and other waste disposal sites are considered to be within the economy. Therefore, flows of residuals into these facilities are regarded as flows within the economy rather than flows to the environment. Subsequent flows from these facilities may either be directly to the environment as residuals or lead to the creation of other products or residuals Household or industrial waste may be dumped (possibly illegally) in open country or by the roadside. As well, tankers at sea may wash their tanks (also possibly illegally) or lose their cargo through being wrecked. These flows should be recorded as residuals flowing from the economy to the environment Efforts might be made to recover residuals, including natural resource residuals, from the environment and bring them back into the economy either for treatment or for disposal to a landfill site. This is the only case where flows of residuals from the environment to the economy should be recorded. In numerical terms, the amount may be small but, in respect of particular incidents (e.g. the wreck of an oil tanker near a protected coast) or specific locations, there may be merit in identifying these flows explicitly The attribution of residuals to individual economies is consistent with the principles applied in the determination of the residence of economic units as outlined in Chapter 2. Residuals are attributed to the country in which the emitting or discarding household or enterprise is resident (for details see Section 3.3). The question of whether the residual has been emitted or discarded into a national environment or into another countries environment is not directly addressed in this recording although this may be of interest in determining the change in the state of a national environment over time In principle, flows of residuals between the national environment and another environment are not recorded in PSUT as there are no flows out of or into an 73
22 economy. Nonetheless, depending on the nature of the relationship between the different national environments there may be interest in recording these flows. For example, countries at the downstream end of a river system may be interested in the flows of residuals generated by other countries transported by a river or the deposition of acidification ( acid rain ) originating from acidifying emissions in other countries. Groups of residuals 3.83 There are a wide variety of different types of residuals and they are not usually accounted for as a single type of flow using mutually exclusive classes. Rather, different groups of residuals are analysed depending on the physical nature of the flow, the purpose behind the flow or simply to reflect the balance of physical flows leaving the economy. The following text presents definitions of the most widely accepted groupings of residuals. Solid waste 3.84 Solid waste covers discarded materials that are no longer required by the owner or user. Solid waste includes materials that are in a solid or liquid state but excludes wastewater and small particulate matter released into the atmosphere Solid waste includes all materials sent to or collected by waste collection or treatment schemes including landfill establishments. Solid waste also includes those same materials if they are discarded directly to the environment whether legally or illegally. In addition, solid waste may include some discarded materials exchanged between economic units, for example scrap metal, for which the discarder receives payment. In these circumstances, the solid waste is considered a product (since the solid waste has a positive value) rather than a residual. Further discussion on the delineation between solid waste residuals and products is in Section 3.6 as part of the description of physical flow accounts for solid waste. Wastewater 3.86 Wastewater is discarded water that is no longer required by the owner or user. Water discharged into drains or sewers, water received by water treatment plants and water discharged direct to the environment is all considered wastewater. Wastewater includes return flows of water which are flows of water direct to the environment, with or without treatment. All water is included regardless of the quality of the water, including returns from hydro-electric power generators Wastewater also includes reused water which is wastewater supplied to a user for further use with or without treatment. Wastewater that is recycled within the same establishment is not recorded in SEEA accounts. 74
23 Emissions 3.88 Emissions are releases of substances to the environment by establishments and households as a result of production, consumption and accumulation processes. Generally, emissions are analysed by type of receiving environment, (i.e. emissions to air, emissions to water bodies, emissions to soil) and by type of substance Most focus in accounting for emissions is on releases directly to the environment. In some cases releases of substances by establishments and households may be collected and contained within economic units (e.g. the capture of methane gas by landfill operations to generate electricity); or transferred between economic units for treatment or other use (e.g. substances in wastewater sent to sewerage facilities for treatment before the return of water to the inland water system) thus lessening the potential pressure on the environment The total quantity of releases of substances by establishments and households is referred to as gross releases. Gross releases comprise emissions to the environment, and substances captured within economic units or transferred to other economic units Emissions to air are gaseous and particulate substances released to the atmosphere by establishments and households as a result of production, consumption and accumulation processes. By convention, emissions to air exclude the release of steam or water via evaporation. Further details on accounting for emissions to air are presented in Section Emissions to water are substances released to water resources by establishments and households as a result of production, consumption and accumulation processes. For any individual establishment or household, emissions to water are measured in terms of the additional substances that the establishment or household has added to water rather than the total quantity of substances in the water discharged by the establishment or household. In this way, substances that were already in the water received by the establishment or household are not attributed to that unit Emissions to water exclude those materials that cannot be carried by regular flows of water such as large items of solid waste. These materials are included in measures of solid waste Since a large proportion of gross releases of substances to water by establishments and households occurs via sewerage systems, accounting for these releases generally covers both emissions to the environment and releases to economic units (largely, sewerage facilities). Further details on accounting for emissions to water and associated releases to economic units are presented in Section Emissions to soil are substances released to the soil by establishments and households as a result of production, consumption and accumulation processes. Some substances emitted to soil may continue to flow through the environment and enter the water system. In principle, flows of substances having been recorded as 75
24 emissions to soil by an individual establishment, should not also be recorded as emissions to water by the same establishment. Dissipative uses of products 3.96 Dissipative uses of products covers products that are deliberately released to the environment as part of production processes. For example, fertilisers and pesticides are deliberately spread on soil and plants as part of agricultural and forestry practice, and in certain countries salt is spread on roads to improve road conditions for drivers. In these cases, a proportion of the amount of product released may be used or absorbed as part of the production process and hence becomes incorporated into new products. The remaining proportion will remain in the environment and this proportion should be recorded as a residual flow to the environment. Dissipative losses 3.97 Dissipative losses are material residues that are an indirect result of production and consumption activity. Examples include particulate abrasion from road surfaces, abrasion residues from car brakes and tyres, and zinc from rain collection systems. These residues should be accounted for as dissipative losses as part of ensuring an overall balance of flows from the economy to the environment. Natural resource residuals 3.98 Natural resource residuals are natural resource inputs that do not subsequently become incorporated into production processes and instead immediately return to the environment. Natural resource residuals are recorded as a generation of residuals by natural resource extracting industries and as a flow of residuals directly to the environment Examples of natural resource residuals include the flaring and venting of natural gas, discarded catch in fishing and felling residues from the harvesting of natural timber resources. Excluded from natural resource residuals are residuals associated with the harvesting of cultivated biological resources such as crop residues, felling residues from cultivated timber resources and manure from the farming of livestock. These residuals are recorded as solid waste. A more detailed discussion of natural resource residuals is presented earlier in this section (see paragraphs ). Losses Another way in which residuals are considered is in terms of losses. This is of particular interest in the analysis of physical flows of energy and water. Four types of losses are identified according to the stage at which they occur through the production process. It is noted that some types of losses may be necessary for maintaining safe 76
25 operating conditions as is the case of flaring and venting in the extraction of natural gas, while others may be unwanted losses as is the case for water evaporation from distribution channels The four types of losses are: i. Losses during extraction are losses that occur during extraction of a natural resource before there is any further processing, treatment or transportation of the extracted natural resource. Losses during extraction exclude natural resources that are reinjected into the deposit from which they were extracted. This may be the case, for example, for natural gas re-injected into the reservoir, or water abstracted from groundwater and re-injected into an aquifer. Some losses during extraction may also be recorded as natural resource residuals. ii. Losses during distribution are losses that occur between a point of abstraction, extraction or supply and a point of use. iii. Losses during storage are losses of energy products and materials held in inventories. They include evaporation, leakages of fuels (measured in mass or volume units), wastage and accidental damage. Excluded from the scope of inventories are non-produced assets, even though they might be considered as being stored. Thus, for example, the evaporation of water from artificial reservoirs is excluded from losses during storage. These reductions in the quantity of water resources are shown in asset accounts (Chapter 5). iv. Losses during transformation refer to the energy lost, for example residual heat, during the transformation of one energy product into another energy product. It is essentially an energy balance concept reflecting the difference in calorific value between the input and output commodities. Losses during transformation only apply to energy flows Losses should be recorded if there is a preference on the part of the economic unit to retain the physical quantities that return to the environment. Particularly in situations where resources are being extracted, some physical quantities of resources may be lost as part of the extraction process but if these quantities are of no interest to the extractor then they should not be considered losses From the perspective of suppliers of products, the amounts of water, electricity, other energy products and other materials that are illegally diverted from distribution networks or from storage may be considered losses due to theft. However, since in physical terms the water, energy or other material is not lost to the economy they are not considered losses in the SEEA. Nonetheless there may be interest in compiling data concerning theft as a subset of overall use of water, energy and other materials. It should be noted that losses due to theft may be difficult to measure in practice and may often be included in losses in distribution. 77
26 Classification of groups of residuals There is no single classification of all residuals. The complication is that the various groups of residuals overlap each other. In order to suitably organise information to answer different policy and research questions, there is no clear approach that might be taken to resolve issues of double counting. Such double counting would arise if a complete classification was constructed following the structure of the various groups of residuals just defined An example of the potential overlap is the treatment of flaring and venting of natural gas at the wellhead. These flows of gas are considered natural resource residuals, losses during extraction and a component of air emissions Table gives an indication of the types of materials that are commonly included in the different groupings of residuals to support analysis of residuals whether the focus is on the purpose behind the discard (e.g. solid waste), the destination of the substance (e.g. emissions to air), or the processes leading to the emission (e.g. dissipative losses). Table Typical components for groups of residuals Group Solid waste (includes recovered materials) (a) Wastewater (a) Emissions to air Typical components Chemical and healthcare waste, Radioactive waste, Metallic waste, Other recyclables, Discarded equipment and vehicles, Animal and vegetal wastes, Mixed residential and commercial waste, Mineral wastes and soil, Combustion wastes, Other wastes Water for treatment and disposal, Return flows, Reused water Carbon Dioxide, Methane, Dinotrogen oxide, Nitrous oxides, Hydrofluorocarbons, Perfluorocarbons, Sulphur Hexaflouride, Carbon monoxide, Non-methane volatile organic compounds, Sulphur dioxide, Ammonia, Heavy metals, Persistent organic pollutants, Particulates (e.g. PM10, dust) Emissions to water Emissions to soil Residuals from dissipative use of products Dissipative losses Nitrogen compounds, Phosphorous compounds, Heavy metals, Other substances and (organic) compounds Leaks from pipelines, chemical spills Unabsorbed nutrients from fertilisers, salt spread on roads. Abrasion (tyres/brakes), Erosion/corrosion of infrastructure (roads, etc) Natural resource residuals Mining overburden, felling residues, discarded catch. (a) This list of typical components for groups of residuals can also be applied to certain flows defined as products. 78
27 Accumulation of residual flows The environmental pressures caused by residuals relate to residual flows from the current period and also flows in the past periods because of the potential of residuals to accumulate. The effect of continuing the existing flow of residuals may be quite different depending on the level already accumulated at the beginning of the period. The measurement of how flows of residuals affect the state and quality of the ecosystems that receive residuals is addressed in SEEA Experimental Ecosystem Accounts It is noted here that the damage inflicted by the ambient concentrations of a residual often increases non-linearly with the amount of residual generated. However, the supply and use tables described in this section detail only the quantity of residuals generated in a single period and do not reveal the consequences of cumulating this amount with past or future amounts of the same (or other) residuals. It is also noted in this regard that the effect on the environment will vary depending on the type of residual and type of environment. The recording of scrapped and demolished produced assets The general physical supply and use table shown in Table includes an entry for residuals from scrapping and demolition of produced assets (Cell K). The recording of these residuals under the column for accumulation highlights that the assets being scrapped were produced in previous periods as opposed to residuals that are the result of current period production activity Many of these residuals will be collected and treated (and possibly recycled) by waste treatment and similar enterprises. In the use table these residuals are shown as received by waste treatment enterprises (Cell N), accumulated in controlled landfill (Cell O), sent to the rest of the world (Cell P) or flowing directly to the environment (Cell Q) A particular interest in recording these residuals is attributing the residuals to the users of the scrapped and demolished produced assets. A difficulty arises when the scrapped assets are sold to another economic unit (the scrapping unit) who then manages the process of final scrapping and demolition. Ideally, the residuals should always be attributed to the former user of the asset in production There are two approaches for recording flows associated with scrapped and demolished produced assets. The first is to classify the flows in the accumulation column by industry and appropriately attributing the residual flows to the industry that had previously used the scrapped asset in production. These flows would then be shown as received by the waste treatment industry in Cell N or sent directly to controlled landfill (Cell O). Alternatively, if classifying the flows in the accumulation column in this way is not possible, then two additional entries may be recorded in the first column. One entry is in Cell N reflecting the implicit use of the scrapped asset by the scrapping industry and the second entry is in Cell I reflecting the generation of 79
28 residuals by the scrapping industry that are subsequently collected by the waste treatment industry or sent to controlled landfills. Two entries are required to maintain a balance of flows for the industry that is scrapping the produced asset In practice, there may be difficulties in attributing the scrapping and demolition of produced assets to the former user because assets, particularly buildings, may be sold just prior to scrapping or demolition. Hence at the time the event generating the residual occurs, a different industry may be the owner and user of the produced asset. Where possible, the residual should be attributed to the industry that has most recently used the produced asset as a capital input to a production process. 80
29 3.3 Principles of physical flow accounting Introduction The application of the broad framework for physical flow accounting outlined in section 3.2 requires the adoption of a range of accounting principles and conventions. A number of these are explained in Chapter 2 including the principle of double entry accounting, the units of measurement, and the definitions of economic units and industries This section describes some specific recording principles relevant to physical flow accounting namely, gross and net recording of physical flows, the treatment of international flows of goods, and the treatment of goods for processing Gross and net recording of physical flows The PSUT framework presented in Section 3.2 records all flows between the environment and the economy, between different economic units and, where applicable, records flows within economic units. This recording of flows is referred to in the SEEA as gross recording. The key advantage of a gross recording approach is that a full reconciliation of all flows at all levels of the supply and use table, for example by industry and by product, can be made However, recording all of these flows may hide some key relationships and hence for analytical purposes, alternative consolidations and aggregations of flows have been developed. These alternative views are often referred to as net although the nature of the consolidations and aggregations varies and hence there is no single application of net recording It is noted that the terms gross and net are used in a wide range of accounting situations. In the SNA the term net is used to indicate whether an accounting aggregate has been adjusted for consumption of fixed capital (depreciation). In other situations, the term net is used simply as the difference between two accounting items. The terms gross and net are also used to describe different aggregates that have related but different measurement scopes One of the common areas in which gross and net recording is applied is in energy accounts. Energy accounts compiled on a gross basis show all flows of energy between economic units. Some of these flows represent flows of energy products to energy producers, e.g. flows of coal to electricity producers, and other flows are to an end user, e.g. flows of electricity to households. Net energy accounts exclude nonconsumptive energy uses that represent the transformation of one energy product to another energy product and hence allow a focus on the end use of energy Generally, care should be taken in the use and interpretation of the terms gross and net and clear definitions of inclusions and exclusions should be provided and sought. 81
30 3.3.3 Treatment of international flows The treatment of physical flows to and from the rest of the world needs careful articulation. The underlying principle to be applied in the SEEA is that relevant flows are attributed to the country of residence of the producing or consuming unit. This differs from the territory principle of recording that is applied in a number of statistical frameworks. The territory principle of recording attributes the relevant flows to the country in which the producing or consuming unit is located at the time of the flow Following both the SNA and the Balance of Payments Manual (BPM6), the residence of an institutional unit is defined by the economic territory with which it has the strongest connection. 16 In the majority of situations the concepts of territory and residence are closely aligned but there are important activities, in particular international transport, that need to be considered directly so as the appropriate treatment can be defined. This part discusses the areas of international transport, tourist activity and natural resource inputs. International transport The appropriate recording of international transport activity is important particularly for information concerning the use of energy and the associated release of emissions. The appropriate and consistent attribution of physical flows relating to international transport to individual countries is an important component of the SEEA To ensure consistency with other parts of the accounts, the treatment is centred on the residence of the operator of the transport equipment. Usually this will be the location of the headquarters of the transport operator. Therefore, regardless of the distances travelled, the number of places of operation, whether the transport service is supplied to non-residents or whether the transport service is between two locations not within the resident country; all revenues, inputs (including fuel wherever purchased) and emissions are attributed to the country of residence of the operator Once the determination of the residence of the operator of international transport equipment using standard SNA and BPM principles has taken place, the appropriate accounting is illustrated in the following examples: i. A ship, whose operator is a resident in Country A, transports goods from Country B to Country C, and refuels in Country C before returning home. In this case purchases of fuel are attributed to Country A (being exports of fuel from Country C and imports of fuel of Country A). Payments for transport service by Country C are exports of services by Country A. All emissions by the ship are attributed to Country A. 16 See 2008 SNA, paragraph
31 ii. A passenger aircraft, whose operator is a resident in Country X, transports people from Country X to Country Y and returns to Country X. The passengers are from various countries, X, Y and Z. In this case any purchases of fuel are attributed to Country X and are recorded as imports if purchased in Country Y. Payments by the passengers are recorded as exports of services by Country X if the passengers are resident in Country Y or Z. All emissions by the aircraft are attributed to Country X Special note is required in relation to the bunkering of fuel, primarily for ships and aircraft. Special arrangements may be entered into such that a unit resident in a country stores fuel in another country while still retaining ownership of the fuel itself. Following the principles of the SNA and the BPM, the location of the fuel is not the primary consideration. Rather focus must be on the ownership of the fuel. Thus if Country A established a bunker in Country B and transports fuel to that country in order to refuel a ship that it operates, then the fuel is considered to have remained in the ownership of Country A and no export of fuel to Country B is recorded. Thus the fuel stored in Country B is not necessarily all attributable to Country B. This treatment is likely to differ from the recording in international trade statistics and adjustments may be needed to source data to align to this treatment. Tourist activity The recording of tourist activity is consistent with the recording of international transport activity in that the concept of residence is central. Tourists include all those travelling outside their country of residence including short term students (i.e. less than 12 months), people travelling for medical reasons and those travelling for business or pleasure. The consumption activity of a tourist travelling abroad is attributed to the tourist s country of residence and not to the location of the tourist when the consumption is undertaken. Thus purchases by the tourist in other countries are recorded as an export by the country visited and as an import of the country of residence of the tourist Solid waste generated by tourists will generally be attributed to local enterprises (e.g. hotels, restaurants). Emissions from local transport used by tourists in a foreign country (e.g. taxis, minibuses, etc) are attributed to the local transport company and, as noted in regard to international transport, emissions from aircraft and other long distance transport equipment are attributed to the country of residence of the operator. In neither case are the emissions attributed to the tourist Emissions from cars are also attributed to the country of residence of the operator (in this case the driver of the car), whether the car is owned by the driver or the car is being hired from a rental car firm. 83
32 Natural resource inputs Natural resource inputs are physical flows from the environment to the economy. They derive from stocks of natural resources comprising mineral and energy resources, soil resources, natural timber resources, natural aquatic resources, other natural biological resources and water resources. All of these resources are considered to be owned by residents of the country in which the resources are located. By convention, natural resources that are legally owned by non-residents are considered to be owned by a notional resident unit and the non-resident legal owner is shown as the financial owner of the notional resident unit. Consequently, in general, the extraction of natural resource inputs must take place within a country s economic territory by economic units that are resident in the country Where illegal extraction takes place, for example when non-residents illegally harvest timber resources, the reduction in the country s resources should be recorded in the asset account (see Chapter 5) as part of extractions of natural resources. However, the associated natural resource input in the PSUT should only be shown in the accounts of the country in which the illegal extractor is resident. No exports should be recorded The major exception to this treatment concerns natural aquatic resources. Following accounting conventions, the harvest of aquatic resources is allocated to the residence of the operator of the vessel undertaking the harvesting rather than to the location of the resources. Thus the amount of natural resource input that should be recorded for a country is equal to the quantity of aquatic resources caught by vessels whose operator is resident in the country regardless of where the resources are caught. Natural resource inputs are not recorded for the harvest of aquatic resources by vessels operated by non-residents in national waters and neither are exports recorded in this situation. In the accounts of the country to which the non-resident operator is connected, there should be entries for natural resource inputs for aquatic resources caught in non-national waters but there should be no reduction in national aquatic resources in their asset accounts for this harvest Treatment of goods for processing It is increasingly common for goods from one country to be sent to another country for further processing before being (i) returned to the original country, (ii) sold in the processing country, or (iii) sent to other countries. In situations where the un-processed goods are sold to a processor in a second country there are no particular recording issues. However, in situations where the processing is undertaken on a fee for service basis and there is no change of ownership of the goods (i.e. the ownership remains with the original country) the financial flows are unlikely to relate directly to the physical flows of goods being processed From a monetary accounts perspective, the enterprise processing the goods assumes no risk associated with the eventual marketing of the products and the value of the output of the processor is the fee agreed for the processing. This fee is recorded as an export of a service to the first country. A consequence of this treatment is that the recorded pattern of inputs 84
33 for the enterprise that is processing goods on behalf of another unit is quite different from the pattern of inputs when the enterprise is manufacturing similar goods on their own account A simple illustration may be given in relation to the production of petroleum products. A firm that refines crude oil on own account has intermediate consumption of crude oil and other inputs, and output of refined petroleum products. A firm that is processing crude oil on behalf of another firm has, in physical terms, similar inputs and uses the same produced assets but, in their accounts, shows neither the intermediate consumption of crude oil nor the output of refined petroleum products. Instead only an output equal to the processing fee is recorded For similar amounts of crude oil processed, the estimates of value added and other inputs (i.e. labour and produced assets) are likely to be comparable. However, by recording only the processing fee rather than the full value of the goods processed, the nature of the aggregate supply and use relationship is changed Although this treatment accords with the SNA and provides the most appropriate recording of the monetary flows, it does not correspond to the physical flows of goods. Consequently, a different treatment of goods for processing is recommended for physical supply and use tables. The treatment is to record the physical flows of goods, both as they enter into the country of the processing unit and as they leave that country. Tracking the physical flows in this way enables a clearer reconciliation of all physical flows in the economy and also provides a physical link to the recording of the environmental effects of the processing activity in the country in which the processing in being undertaken, including for example, emissions to air. The same considerations apply to flows of goods for repair and merchanting Generally, information on the physical flow of goods between countries is available in international trade statistics. However, it is necessary to identify those flows of goods where the ownership has not changed and to apply a different treatment in monetary terms compared to the international trade data Depending on the products and industries that are of interest, reconciliation entries may be required if accounts combining physical and monetary data are to be compiled. 85
34 3.4 Physical flow accounts for energy Introduction Energy flow accounts record energy flows, in physical units, from the initial extraction or capture of energy resources from the environment into the economy, to the flows of energy within the economy in the form of the supply and use of energy by industries and households and finally, the flows of energy back to the environment The compilation of energy flow accounts allows for a consistent monitoring of the supply and use of energy by energy type and, in combination with monetary information, indicators of energy intensity, efficiency and productivity can be derived Energy flow accounts are a sub-system within the general physical flow framework. Energy accounts data are compiled by converting physical measures of mass and volume such as tonnes, litres and cubic metres into a common unit representing energy content in net calorific terms. The use of the joule as a common measurement unit is recommended by the International Recommendations for Energy Statistics (IRES) Scope and definitions of energy flows Energy flows consist of flows of (i) energy from natural inputs, (ii) energy products, and (iii) energy residuals. Flows of air emissions and solid waste generated by energy production and use are not included although all types of waste used as inputs in the production of energy are included Energy from natural inputs comprise flows of energy from the removal and capture of energy from the environment by resident economic units. These flows include energy from mineral and energy resources (e.g. oil, natural gas, coal & peat, uranium), natural timber resources, and inputs from renewable energy sources (e.g. solar, wind, hydro, geothermal) Energy from cultivated biomass, including from cultivated timber resources, is treated as produced within the economy and hence is first recorded as the flow of an energy product. However, to ensure a complete balance of energy flows in the PSUT, a balancing entry equal to the energy products from cultivated biomass is recorded as a component of energy from natural inputs in both the supply and the use tables Energy products are products that are used (or might be used) as a source of energy. They comprise (i) fuels that are produced/generated by an economic unit (including households) and are used (or might be used) as sources of energy; (ii) electricity that is generated by an economic unit (including households); and (iii) heat that is generated and sold to third parties by an economic unit. 18 Energy products include energy from 17 International Recommendations on Energy Statistics (IRES) 2011, International Recommendations on Energy Statistics (IRES) 2011,
35 biomass and solid waste that are combusted for the production of electricity and/or heat 19. Some energy products may be used for non-energy purposes A distinction can be made between primary and secondary energy products. Primary energy products are produced directly from the extraction or capture of energy resources from the environment. Secondary energy products are the result of transformation of primary, or other secondary, energy products into other types of energy products. Examples include petroleum products from crude oil, charcoal from fuelwood and electricity from fuel oil Heat and electricity may be either primary or secondary products depending on their production process. For example, if heat is captured directly from the environment through solar panels it is a primary energy product. It is a secondary energy product if produced from other energy products such as coal or oil Generally, physical and monetary flows of energy products should be classified using the Standard International Energy Product Classification (SIEC) presented in the IRES. Often, monetary flows will be classified using the CPC. Since there is not a one-to-one relationship between SIEC and CPC categories, a correspondence between these classifications will be needed for detailed analysis of combined physical and monetary datasets Energy residuals in physical terms comprise a number of components. Most focus is on energy losses which are defined consistently with the general definition of losses outlined in Section 3.2. Particular examples of energy losses include flaring and venting of natural gas and losses during transformation in the production of primary energy products from energy from natural inputs and in the production of secondary energy products. Energy losses during distribution may arise from the evaporation and leakages of liquid fuels, loss of heat during transport of steam, and losses during gas distribution, electricity transmission and pipeline transport. Energy residuals also include other energy residuals particularly heat generated when end users (either households or enterprises) use energy products for energy purposes (e.g. electricity) In order to fully balance the energy PSUT it is also necessary to record two other residual flows. The first relates to the energy embodied in energy products used for non-energy purposes which is shown as leaving the energy system as a residual flow. Non-energy purposes include the use of energy products to manufacture non-energy products (for example the energy product naptha is used in the manufacture of plastic, a non-energy product), and the direct use of energy products for non-energy purposes (for example, as lubricants, etc.). The second additional residual flow concerns the generation of energy from the incineration of solid waste. The energy embodied in solid waste is shown as entering the energy system as a residual flow before becoming an energy product. Neither of these residual flows are considered part of energy residuals. 19 International Recommendations on Energy Statistics (IRES) 2011, 2.B 87
36 3.4.3 Physical supply and use tables for energy Physical supply and use tables for energy record the flows of energy from natural inputs, energy products, energy residuals and other residual flows in physical units of measure. They are based on the principle that the total supply of each flow is equal to the total use of the same flow (i.e. total supply of energy products equals total use of energy products) Table shows the SEEA physical supply and use table for energy. The table includes flows of all energy from natural inputs and energy products, including those energy products that are transformed into other energy products. Therefore, the energy content of some products is counted more than once. Coal, for example, is used as input into a transformation process to obtain electricity and heat, and the accounts record the energy content of the coal as well as the energy content of the resulting electricity and heat The columns of the energy supply and use table follow the structure of the general PSUT presented in Table The level of industry detail highlights those industries that most commonly play a significant role in energy production or use, but there is no restriction in the amount of industry detail that may be incorporated. The accumulation column records changes in the inventories of energy products that can be stored, for example coal, oil and natural gas. 88
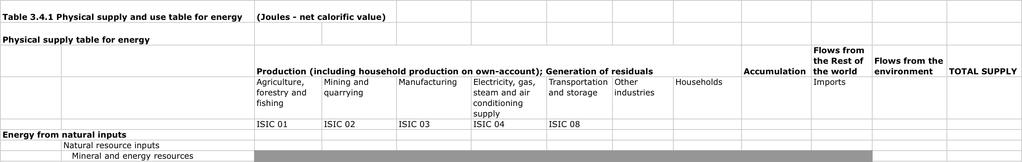
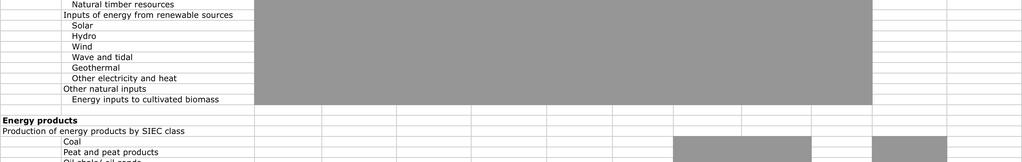
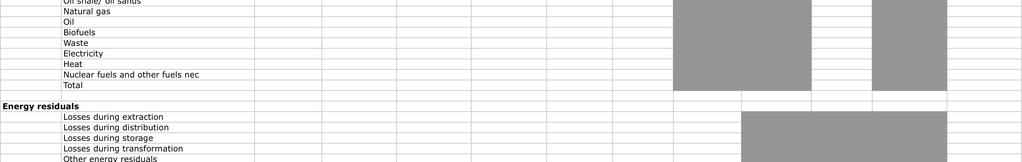
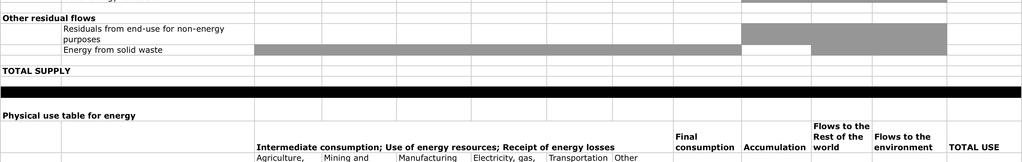


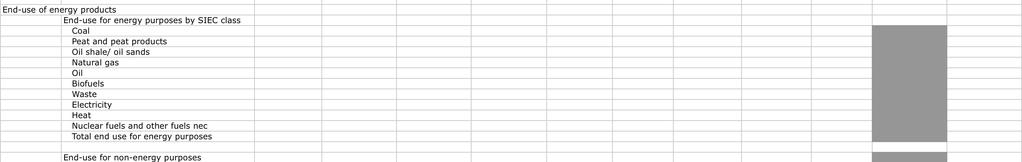

37 89
38 Key components of the PSUT for energy The key components of the PSUT for energy concern (i) the supply and use of energy resources, (ii) the supply of energy products, including energy products produced on own account; (iii) imports and exports of energy products; (iv) the transformation and end-use of energy products; and (v) the supply and use of energy residuals and other residual flows. These five areas are discussed in the following paragraphs. Supply and use of energy from natural inputs The first part of the energy supply table and the first part of the energy use table relate to the flows of energy from natural inputs. The structure of these parts is analogous to the sections on natural inputs in the general PSUT described in Table In the supply table energy from natural inputs is shown as being supplied by the environment. In the use table energy from natural inputs is shown as being used by the extracting industries. The total supply of each input must equal to the total use of each input Flows of energy from natural inputs may be presented at varying levels of detail depending on those inputs of most relevance and analytical interest in a country. For those inputs that are types of mineral and energy resource (e.g. oil and natural gas), all of the extracted resource is recorded regardless of the ultimate purpose for the use of the extracted natural resource. On the other hand, for natural timber resources only that amount extracted for fuelwood is recorded as energy from natural inputs In principle, the inputs of energy from renewable sources (solar, hydro, wind, wave and tidal, geothermal, etc.) should reflect the amount of energy incident on the technology put in place to collect the energy. In practice, inputs of energy from renewable sources are recorded in terms of the amounts of heat and electricity produced via the relevant technology. Consequently, in practice, losses of energy in the capture of energy from renewable sources are not included in the PSUT. Energy from hydro-electric schemes is recorded here in terms of energy produced For those inputs that are types of mineral and energy resources, losses of energy during extraction are included in the total amount of resource extracted from the environment, in line with the general treatment of natural resource residuals and losses. Entries for losses during extraction should also be made in the bottom parts of the supply and use tables concerning energy residuals. 90
39 Supply of energy products All energy products supplied from one unit to another, including between units within a single enterprise, are included in the flow accounts no matter if the energy product is sold or exchanged as part of a barter or provided free of charge Energy products are primarily produced by establishments classified to ISIC section B, Mining and quarrying, ISIC Section C, Manufacturing and ISIC section D, Electricity, gas, steam and air conditioning supply. For many countries, the main source of supply may be imported energy products. Energy products are classified following the Standard International Energy product Classification (SIEC) Energy products are produced as secondary production by many establishments and also for use within an establishment (i.e. for own account production and use). Where it is possible to quantify the own account, intra-establishment production and use of energy products, these flows should be recorded in the accounts as flows of energy for own use. 20 In Table the flows relating to own-account production and use are not separately identified A special case in the supply of energy products concerns energy production by households. Households may purchase and install equipment for the generation of energy products (for example, solar panels) and also may collect and use energy resources such as fuelwood to generate energy products. The energy produced is either consumed on own account or sold on the market, for example by selling electricity to an electricity grid Following the general principles of recording production, all activity should be allocated to the relevant industry whether for own-account consumption or for sale. A distinction between those amounts of energy produced by households for sale as compared to production for own-use may also be compiled. Energy produced for own-account consumption should be recorded as household final consumption in the use table. Imports and exports of energy products Imports and exports of energy products should be recorded when a change of ownership between a resident and a non-resident unit occurs. Energy products in transit through the economic territory should generally not be included in imports and exports. However, for electricity and heat it may be difficult to distinguish between transit flows and other flows, and, in practice, all flows of electricity and heat into a country may be recorded as imports, and all outgoing flows may be recorded as exports. Energy products sent abroad for processing should be treated following the treatment of goods for processing described in Section Energy use by resident units abroad, essentially covering tourists driving abroad and companies engaged in international transport activities, should be recorded in the accounts 20 Generally these flows are not recorded in monetary supply and use tables. 21 SEEA-Energy provides a more detailed discussion of the recording of own-account production and use of energy products. 91
40 either as the use of the industries earning the value added from these activities or as a use of the households operating the transport equipment. All energy use by non-resident units within the national boundary (ships, planes, trucks and tourists) should be excluded. Transformation and end-use of energy products The use of energy products is split into two sections in the use table. The first section, Transformation of energy products, records the transformation of energy products into other energy products. For example, the mining and quarrying industry may produce coal as an energy product in the supply table and its use to produce electricity would be shown in the transformation of energy products as the use of coal by the electricity supply industry The second section, End-use of energy products, records the use of energy products to produce goods and services that are not energy products. These goods and services may be used for intermediate consumption, for household final consumption, as a change in inventories of energy products, or for export. The end-use of energy products is shown in two parts uses for energy purposes and uses for non-energy purposes. Non-energy uses of energy products include, for example, the use of oil based products as lubricants or in the production of plastics. In Table only the end-use of energy products for energy purposes is shown as allocated by type of energy product but this allocation is also possible for end-use for non-energy purposes In total, intermediate consumption includes the use of all energy products by industries as inputs in a production process, regardless of the nature of the production process, i.e. whether it is a process converting an energy product into another energy product for further use in the economy (transformation), or whether it is a process which ultimately uses the energy content of the energy product so that no further use of the energy is possible (enduse), in some cases by incorporating the energy product in a non-energy product Some energy products may be stored by industries for later transformation or end-use. The net changes in the quantities stored are recorded as changes in inventories and are recorded in the accumulation column for each relevant energy product. Exports of energy products are also recorded as part of end-use Final consumption refers to the consumption by households of energy products purchased or otherwise obtained from energy suppliers. All final consumption reflects the end use of energy. Final consumption includes the energy products produced by the households themselves, e.g. energy produced from fuelwood gathered by households and electricity generated by windmills for own-use The concept of final consumption of energy in the SEEA differs from concept of final consumption used in energy balances as defined in IRES. In energy balances final consumption relates to the total end-use of energy by industries and households (excluding change in inventories and exports). It is therefore a broader measure than final consumption in the SEEA which relates only to end-use by households. 92
41 Energy residuals and other residual flows The bottom parts of the supply and use tables record entries associated with energy residuals and other residual flows. Different types of energy residuals are recorded losses during extraction, losses during distribution, losses during transformation, losses during storage, and other energy residuals (including residuals from end-use for energy purposes). The different energy residuals are recorded as being supplied by various industries and households in the supply table and received by the environment in the use table Losses of energy products are recorded as part of the intermediate consumption of the producer when the losses occur before a change of ownership from the producer to the user has taken place. However, losses of energy products after they have been delivered from the producer to the user of the product (for example from storage) should be recorded as part of intermediate or final consumption of the user For other residual flows, the energy embodied in energy products used for non-energy purposes is shown as supplied by various industries and households and, by convention, is recorded as being retained in the economy as an increase in accumulation in the use column. By convention, the energy from solid waste is shown as supplied from within the economy in the accumulation column and a matching positive entry is recorded in the use table in the column for the industry incinerating the solid waste Energy statistics, energy accounts and energy balances Energy statistics, energy accounts and energy balances all provide information on energy supply and energy use. Energy statistics result from the collection and compilation of information on production, imports, exports and domestic use of energy products on the basis of specific surveys and by using, for example, business statistics and international trade statistics. Energy balances re-organise these basic statistics by confronting and consolidating supply and use, and by highlighting the transformation of energy within the economy. Similarly, energy accounts, which primarily use national accounts classifications and definitions, can be seen as a re-organisation and broadening of scope of energy statistics. Both energy balances and energy accounts apply the principle that supply equals use, but supply and use are defined in different ways in these two systems In contrast to the energy accounts, energy balances normally include only physical data on energy. Since one of the main purposes of energy accounts is to link physical and monetary data in a comparable way, this leads to different definitions and a different organisation of energy data in physical terms so that it can be aligned with the data in monetary terms in the national accounts One main difference between the energy balances and the energy accounts concerns how activities are classified and the treatment of various activities within the national boundary. The energy accounts use the concept of residence to determine whether a specific energy flow should be included, for instance, as imports and whether it is included as part of 93
42 energy use. The boundary of the energy balances follows the territory principle of recording One method of reconciling aggregates that are derived from energy accounts and energy balances is through the compilation of bridge tables. Bridge tables show the adjustments required to either energy accounts or energy balances to account for the conceptual differences between the approaches. A full description of the relationship between energy accounts and energy balances and associated bridge tables is included in SEEA Energy Energy aggregates Accounting for energy flows provides a framework for the assessment of energy production and consumption and related issues of resource use and air emissions. Two energy aggregates are defined in the SEEA that suit particular analytical and policy questions. Other aggregates and indicators may also be compiled using data contained in the energy PSUT with differing inclusions and exclusions depending on the questions of policy or analytical interest Gross Energy Input reflects the total energy captured from the environment, energy products that are imported and energy from residuals within the economy (e.g. from incinerated solid waste). It can therefore provide an indicator of the pressures placed on the environment (or other countries' environments) in the supply of energy to the economy. In terms of entries contained in the energy PSUT, Gross Energy Input is equal to Energy from Natural Inputs plus Imports of energy products plus Energy from waste. For analytical purposes it may be useful to disaggregate Energy from Natural Inputs into the energy from natural resource inputs, the energy from renewable sources and the energy inputs to cultivated biomass, since each of these types of natural inputs relates to different environmental pressures The second main energy aggregate is Net Domestic Energy Use. Net Domestic Energy Use reflects the net amount of energy used in an economy through production and consumption activity and can be used to assess trends in energy consumption by resident units. Net Domestic Energy Use is defined as the end-use of energy products (including changes in inventories of energy products) less exports of energy products plus all losses of energy (losses during extraction, losses during transformation, losses during storage and losses during distribution). It is regarded as a "net" measure since for energy products that are transformed into other energy products only the transformation losses are included, not the total input of energy products into the transformation process. Separate analysis of the components of Net Domestic Energy Use (e.g. total end-use of energy products less exports, and total energy losses) can also provide important information concerning energy use For the total economy, Gross Energy Input and Net Domestic Energy Use differ only by the amount of energy products exported. Both aggregates may also be compiled for individual industries and for households using the same definitions as outlined for the total economy but focusing on the relevant columns in the PSUT. These and other aggregates 94
43 and indicators can be linked to data in the economic accounts in physical and monetary terms, to derive measures of intensity and productivity in energy use. 95
44 3.5 Physical flow accounts for water Introduction Water flow accounts describe water flows, in physical units, from the initial abstraction of water resources from the environment into the economy, to the water flows within the economy in the form of supply and use by industries and households, and finally flows of water back to the environment. This section describes a complete PSUT for water flows noting that individual components of the PSUT could be compiled separately. Related accounts for emissions to water (Section 3.6) and asset accounts for water (Section 5.11) are also relevant For the purposes of water resource management the compilation of data for a river basin or other hydrologically relevant area may be appropriate. It is noted however, that while physical data may be available for such geographic areas, corresponding economic data will generally only be available for administrative regions and these two geographic boundaries may not align Scope of water flows Water is in continuous movement. Solar radiation and gravity keep water moving from land and oceans to the atmosphere in the form of water vapour (evaporation and transpiration) and falling back through precipitation. The focus of the SEEA is the inland water system with provision for the inclusion of sea or ocean water abstracted for production and consumption (e.g. saline water for desalinization or cooling) The inland water system comprises surface water (rivers, lakes, artificial reservoirs, snow, ice, glaciers), groundwater and soil water within the territory of reference. All flows associated with the inland water system are recorded in the asset accounts for water resources, including flows to and from accessible seas and oceans. The PSUT records the abstraction of water from the inland water system, and seas and oceans by economic units; the distribution and use of this water by various economic units; and the returns of water to the inland water system and seas and oceans. Flows such as the evaporation of water from lakes and artificial reservoirs and flows between water bodies are considered flows within the environment and are recorded in the asset accounts as described in Chapter Emissions to water (e.g. pollution) are recorded in a separate PSUT that is discussed in Section 3.6. The broader issue of the impact of economic activity on the quality of water requires an assessment of the quality of the stock of water resources. Water quality accounts are discussed in more detail in SEEA-Water. 96
45 3.5.3 Physical supply and use table for water Physical supply and use tables can be compiled at various levels of detail, depending on the required policy and analytical focus and data availability. A basic PSUT for water contains information on the supply and use of water and provides an overview of water flows. The PSUT is divided into five sections that organize information on (i) the abstraction of water from the environment; (ii) the distribution and use of abstracted water across enterprises and households; (iii) flows of wastewater and reused water (between households and enterprises); (iv) return flows of water to the environment; and (v) evaporation, transpiration and water incorporated into products Table shows the SEEA physical supply and use table for water. The columns of the PSUT are structured in the same way as for the general PSUT described in Table The breakdown of the economic activities, classified according to ISIC distinguishes the following groups: ISIC which includes Agriculture, Forestry and Fishing; 22 ISIC 05-33, which includes: Mining and quarrying, Manufacturing and Construction; ISIC 35 - Electricity, gas, steam and air conditioning supply; ISIC 36 - Water collection, treatment and supply; ISIC 37 - Sewerage; ISIC 38, 39, 45-99, Other industries Industry classes ISIC 35, 36 and 37 are specifically identified because of their importance in the supply and use of water and provision of water-related services. ISIC 35 is a major user of water for hydroelectric power generation and cooling purposes. ISIC 36 and 37 are the main industries for the distribution and treatment of water and wastewater The following paragraphs describe the key components of the physical supply and use table for water. Abstraction of water The abstraction of water is recorded in part (i) of the supply table, Sources of abstracted water, as being supplied by the environment. The same volume of water is recorded in part (i) of the use table, Sources of abstracted water, by the industry that undertakes the abstraction. Water may be abstracted from artificial reservoirs, rivers, lakes, groundwater and soil water. The capture of precipitation via, for example, the capture of water from the roofs of houses in water tanks, is recorded as abstraction via precipitation. Precipitation direct to the inland water system is not recorded in the PSUT but is recorded in the asset account for water resources Abstraction is defined as the amount of water that is removed from any source, either 22 For certain analytical purposes it may be relevant to distinguish between the uses of water by these different industries. 97
46 permanently or temporarily, in a given period of time. Water used for hydroelectric power generation, is considered as abstraction and is recorded as a use of water by the abstractor. Water abstracted but not used in production, such as water flows in mine de-watering, are recorded as natural resource residuals. Water abstraction is disaggregated by source and by industry Following the general treatment of household own-account activity, the abstraction of water by households for own-consumption should be recorded as part of the activity of the water collection, treatment and supply industry (ISIC 36). This activity is shown as a separate column in Table Consistent with the treatment for the asset accounts for water resources, the water in artificial reservoirs is not considered to be produced, i.e. it is not considered to have come into existence via a process of production. Consequently, abstraction from artificial reservoirs is recorded as abstraction from the environment and flows of precipitation into artificial reservoirs and flows of evaporation from the reservoirs are not recorded in the PSUT for water. These flows are recorded in the asset accounts for water resources as part of the overall accounting for the change in the stock of water resources over an accounting period Abstraction of soil water refers to the uptake of water by plants and is equal to the amount of water transpired by plants plus the amount of water that is embodied in the harvested product. Most abstraction of soil water is used in agricultural production and in cultivated timber resources but in theory the boundary extends to all soil water abstracted for use in production, for example, including soil water abstracted in the operation of golf courses. 23 Abstraction of soil water is calculated based on the area under cultivation using coefficients of water use. Different coefficients should be used for different plants and should take into consideration location effects (e.g. soil types, geography and climate) In principle, an amount of abstracted water is retained at the end of each accounting period for use in the next accounting period, for example in storage tanks. However, this volume of water is relatively small in comparison to the overall flows of water during an accounting period and is also small relative to the stock of water held in the total inland water system. Therefore, in practice, the net changes in the accumulation of abstracted water over an accounting period is assumed to be zero by convention. 23 Soil water abstracted by non-cultivated plants is not in scope of the PSUT but there may be interest in recording these flows, for example, in respect of natural timber resources. 98
47 99
48 Distribution and use of abstracted water Water that has been abstracted must either be used by the same economic unit which abstracts it (referred to as abstracted water for own use), or be distributed, possibly after some treatment, to other economic units (referred to as abstracted water for distribution). Most of the water for distribution is abstracted by ISIC 36, Water collection, treatment and supply. However, there may be other industries that abstract and distribute water as a secondary activity Part (ii) of the supply table, Abstracted water, shows the supply of abstracted water by the industries undertaking the abstraction with the differentiation as to whether the water is for own use or for distribution. This part of the supply table also records imports of water from the rest of the world. The total of water abstracted for own-use, abstracted for distribution, and imported represents the total water available for use in the economy The use of this water is shown in part (ii) of the use table where the water available for use is shown as the intermediate consumption of industries, the final consumption of households or exports to economic units in the rest of the world The abstracted water received from other economic units refers to the amount of water that is delivered to an industry, households or the rest of the world by another economic unit. This water is usually delivered through systems of pipes (mains), but other means of transportation are also possible (such as artificial open channels, trucks, etc.) Within the economy, water is often exchanged between water distributors before being delivered to users. These water exchanges are referred to as intra-industry sales. These are the cases, for example, when the distribution network of one distributor does not reach the water user and hence water must be sold to another distributor in order for the water to be delivered. In principle, all intra-industry sales should be recorded following standard accounting principles. However, these exchanges are not recorded in the PSUT as their recording would increase the total flows recorded even though there may be no additional physical flows of water. That is, the intra-industry sales are transactions of water in situ and the same physical flow of water occurs whether intra-industry sales take place or not. Nonetheless, depending on the volumes of water involved, it may be useful to present these intra-industry flows in a supplementary table. Flows of wastewater and reused water After accounting for the distribution and use of water it is necessary to consider flows of wastewater between economic units. Wastewater is discarded water that is no longer required by the owner or user. Wastewater can be discharged directly into the environment (in which case it is recorded as a return flow), supplied to a sewerage facility (ISIC 37) (recorded as wastewater to sewerage), or supplied to another economic unit for further use (reused water). Flows of wastewater include exchanges of wastewater between sewerage facilities in different economies. These flows are recorded as imports and exports of wastewater. 100
49 3.206 In situations where wastewater flows to a treatment facility or is supplied to another economic unit, flows of water are recorded in part (iii) of the supply table, Wastewater and reused water and part (iii) of the use table. Flows of wastewater are generally residual flows between economic units since it is usually the case that the flow of wastewater to a sewerage facility is also accompanied by a payment of a service fee to the sewerage facility i.e. the sewerage facility does not purchase the wastewater from the discarding unit Reused water is wastewater supplied to a user for further use with or without prior treatment, excluding the reuse (or recycling) of water within economic units. It is also commonly referred to as reclaimed wastewater. Reused water is considered a product when payment is made by the receiving unit Reused water excludes the recycling of water within the same establishment (on site). Information on these flows, although potentially useful for analysis of water use efficiency, is not generally available. However, a reduction in the total volume of water used, while maintaining the same level of output, can provide an indication of an increase in water use efficiency which, in turn, may be due to the reuse of recycled water within an industry Once wastewater is discharged into the environment (e.g. into a river), its re-abstraction downstream is not considered as a reuse of water in the accounting tables, but as a new abstraction from the environment. Return flows of water to the environment All water that is returned to the environment is recorded as being supplied to the environment in part (iv) of the supply table, Return flows of water. In some cases these flows will comprise flows of wastewater direct to the environment from industries and households i.e. flows of wastewater not sent to treatment facilities. In other cases these flows will comprise flows of water from treatment facilities following treatment. In the supply table these flows are shown as being supplied by the various industries and households either to the inland water system or to other sources, including the sea. Corresponding volumes of water are recorded in part (iv) of the use table, with the flows shown as being received by the environment Some return flows of water to the environment are losses of water. Consistent with the general definition of losses outlined in Section 3.2, losses of water comprise flows of water that do not reach their intended destination or have disappeared from storage. The primary type of losses of water are losses during distribution Losses during distribution occur between a point of abstraction and a point of use or between points of use and reuse of water. These losses may be caused by a number of factors including evaporation (e.g. when water is distributed through open channels), and leakages (e.g. when water leaks from pipes or distribution channels, including rivers in some cases, into the ground). In practice, when losses during distribution are computed as a difference between the amount of water supplied and received, they may also include problems associated with water meters and theft. 101
50 3.213 Urban runoff is a significant flow of water. Urban runoff is that portion of precipitation on urban areas that does not naturally evaporate or percolate into the ground, but flows via overland flow, underflow, or channels, or is piped into a defined surface water channel or a constructed infiltration facility. Urban runoff that is collected by a sewerage or similar facility is recorded as the abstraction of water from the environment (by convention attributed to the sewerage industry, ISIC 37) in the supply table. It may then be treated before returning to the environment or it may be treated and distributed as reused water. Urban runoff that is not collected by a sewerage or similar facility but flows directly to the inland water system is not recorded in the PSUT Although separate estimates for urban runoff may be available in some countries, these flows generally cannot be measured directly. Estimates may be obtained by measuring the difference between the volumes of wastewater discharged by economic units (industries and households) into sewers and the volumes of wastewater collected by the sewerage system. Evaporation of abstracted water, transpiration and water incorporated into products To fully account for the balance of flows of water entering the economy through abstraction and returning to the environment as return flows of water, it is necessary to record three additional physical flows evaporation of abstracted water, transpiration and water incorporated into products Flows of evaporation are recorded when water is distributed between economic units after abstraction, for instance during distribution via open channels or while in water storage tanks and similar structures. The transpiration of water occurs when soil water is absorbed by cultivated plants as they grow and is subsequently released to the atmosphere Amounts of water incorporated into products (e.g. water used in the manufacture of beverages) is shown as supplied by the relevant industry, commonly a manufacturing industry The supply and use of evaporation of abstracted water, transpiration and water incorporated into products is recorded in part (v) of the supply and use tables. Ideally, these flows would be recorded separately with the flows of evaporation of abstracted water and transpiration shown as flowing to the environment from the relevant water user and the flows of water incorporated into products shown as retained in the economy in the accumulation column. In practice, direct measurement of these flows, particularly as it relates to the distinction between transpiration and the water incorporated into cultivated plants, is usually not possible and hence a combined flow may be recorded Water aggregates Water accounting provides a useful tool for improved water management. Many aggregates and indicators can be derived from PSUT and, using the structured framework, these data can be linked to data from the economic accounts in physical and monetary 102
51 terms, to derive measures of intensity and productivity of water use. Three water aggregates are defined in the SEEA that suit particular analytical and policy questions. Other aggregates and indicators may also be compiled using data contained in the water PSUT with differing inclusions and exclusions depending on the questions of policy or analytical interest Gross Water Input reflects the total water abstracted from the environment or that is imported. It can therefore provide an indicator of the pressures placed on the environment (or other countries' environments) through the supply of water to the economy. In terms of entries contained in the water PSUT it is equal to Total Abstracted Water plus Imports of water. For analytical purposes it may be useful to disaggregate Gross Water Input by source (for example, surface water, ground water, soil water, or other sources including precipitation and sea water). Gross Water Input can also be measured by industry Net Domestic Water Use focuses on the use of water by resident units. This aggregate excludes all flows of water between economic units (and hence is a net measure) and also deducts all exports of water. It is most directly defined as the sum of all return flows of water to the environment plus evaporation, transpiration and water incorporated into products. Net Domestic Water Use can be compiled for individual industries and for households. Where exports and imports of water are relatively small there will be little difference between Gross Water Input and Net Domestic Water Use at a national level. However, there may be interest in compiling this aggregate at an industry level, for example, for agriculture or the water collection, treatment and supply industry, or for regions within a country between which imports and exports of water may be significant The third main aggregate is Final Water Use (generally referred to as water consumption within water statistics). Final Water Use is a key indicator of environmental pressure with respect to water since it allows for the fact that a large proportion of the water abstracted is returned to the environment and hence may be re-abstracted. Final Water Use is equal to evaporation, transpiration and water incorporated into products and reflects the quantity of water no longer available for use The aggregates and indicators just described do not cover all changes in the stock of water in inland water resources. Of particular interest may be losses of water through evaporation, particularly from artificial reservoirs. These losses are recorded in the asset accounts for water resources described in Section
52 3.6 Physical flow accounts for materials Introduction The third sub-system of physical flow accounting concerns flows of materials. In contrast to energy and water, materials are a far more diverse set of natural inputs, products and residuals. Consequently, although in principle a complete accounting for material flows on the basis of the mass of each type of material may be accomplished, in practice accounting for materials tends to focus either on particular materials or on specific types of flows In addition, there is interest in focussing on particular parts of the overall material flow cycle. For example, Section 3.2 defined emissions as a type of residual that are releases of substances by establishments and households into the air, water or soil as a result of production, consumption and accumulation processes. The focus on accounting for emissions is therefore not on the complete cycle through the economy of the particular substances that comprise emissions but rather only on the flow from the economy to the environment. Similar considerations apply in accounting for solid waste This section discusses the main areas in which development of physical flow accounting for materials has taken place (i) product flow accounting, (ii) accounting for air emissions, (iii) accounting for emissions to water and associated releases to economic units, (iv) accounting for solid waste and (v) economy wide material flow accounting (EW- MFA). In all cases the accounting systems work within the principles and structures outlined in Sections 3.2 and Product flow accounting For the management of specific products it may be useful to trace the physical flows of an individual material from the environment, through the economy and back into the environment. At a very detailed level it is possible to track flows of elements, such as mercury, that may be of interest due to their hazardous nature. Using similar methods, flows of nutrients in the soil might be tracked in terms of the uptake of nutrients by crops and the embodiment of these nutrients in other products As materials flow through the economy, they may become embodied in products that are more complex. These material flows can be analysed by combining the physical flow data with the economic relationships in standard supply and use tables. In this way it is possible to estimate the quantity of specific materials required to yield final products. This type of information is relevant for demand based analysis of material flows and for the calculation of the upstream requirements of production that are necessary for life cycle analysis and related analytical techniques A particular example of this type of material flow accounting is the compilation of nutrient balances. Nutrient balances track the flows of soil nutrients (Nitrogen (N), Phosphorous (P) and Potassium (K)) from the soil through various products. Nutrient balances, particularly if calculated at a broad scale, necessarily require the use of multiple coefficients in order to estimate not only the total quantity of inputs, but also 104
53 the extraction of nutrients embodied in products (e.g. harvested crops and fodder used for livestock) Three major types of physical flows are used to construct nutrient balances on a broad scale. First, product flows of fertiliser products, which may be organic or inorganic and are measured in tonnes of nutrients. Second, flows of other organic inputs, which include own-account production of nutrients on farms through use of manure, and nutrients from natural cycling processes, such as natural fixation, that occur during the accounting period. These other organic input flows are estimated in a variety of ways depending on the type of flow. Third, nutrients removed from the system when crops are harvested and when other plants and grasses are used for grazing by livestock. These flows are also estimated by applying relevant coefficients to data on the physical supply of crops, grasses and fodder and taking into account farming practices. The difference between the total inputs and the removals is the nutrient balance and represents the surplus or deficit of nutrients resulting from production processes Nutrient balances are related to the dissipative use of products (primarily fertilisers) (described in Section 3.2.4) in agricultural and forestry activities. Positive nutrient balances (i.e. there are residuals from the dissipative use of products) are not necessarily lost to the relevant production unit. Depending on a number of factors, some of the residuals could remain in the soil as a stock of nutrients that may be useful for crop production in the future. However, a proportion of the positive balance for a given nutrient also commonly leads to degradation of nearby surface and groundwater as well as emissions to air, e.g. in the form of nitrous oxide (a greenhouse gas). A negative nutrient balance (i.e. the case where removals exceed inputs for N, P, or K) can be an indicator of a lack of sustainability in production since, ultimately, the production of crops cannot continue without an appropriate balance of each of the major nutrient categories in the soil. 24 There are no residual flows in this situation While product flow accounting may be undertaken following different accounting rules suited or tailored to an individual product, it is recommended that accounting be undertaken consistently with the boundaries and definitions outlined in Sections 3.2 and 3.3. If this is done it permits a much broader range of linkages and analysis, especially with associated economic data Accounting for air emissions Emissions to air are gaseous and particulate substances released to the atmosphere by establishments and households as a result of production, consumption and accumulation processes. The SEEA air emission account records the generation of air emissions by resident economic units by type of substance. 24 More information and guidelines for calculating nutrient balances are available from FAO, OECD and Eurostat. See for example, OECD/Eurostat Gross Nitrogen Balances Handbook, December
54 3.234 In some situations the gaseous and particulate substances generated through economic activity may be captured for use in other production processes (for example, the capture of methane gas in landfill sites to generate energy) or may be transferred between economic units for use in production or for storage (for example, the storage of carbon). To fully account for the flows of particular gaseous and particulate substances there may be interest in recording the flows of these substances within and between economic units, in addition to emissions to air. This extension is not described in this section but in accounting terms it follows the same general principles outlined in this chapter Since the focus is on the generation and release of residuals there is no requirement to construct a complete PSUT. Rather, emphasis is on determining an appropriate scope for the measurement of air emissions that aligns with the scope and boundaries used in the compilation of the economic accounts The SEEA air emission account is presented in Table Its structure is a reduced and reoriented version of the general PSUT presented in Table The left hand part of the table is the supply table and shows the generation of emissions by industries and households by type of substance. For the purpose of accounting for emissions of carbon dioxide it is recommended that, where possible, carbon dioxide emissions resulting from the burning of fossil fuels should be distinguished from carbon dioxide emissions from biomass. Table Air emissions account The column for accumulation shows the release of air emissions from controlled landfill sites as these reflect a release of emissions from production, consumption and accumulation activity in earlier periods. These emissions should be attributed to the waste management units that operate the landfill sites Air emissions by households are broken down by purpose (transport, heating, other). Additional purposes may be added depending on analytical requirements and available information. 106
55 3.239 The right hand part of the table is the use table which shows the release of emissions to the atmosphere. Issues in the measurement of air emissions Economic boundary with respect to air emissions Consistent with the general definition of the economic boundary using the principle of residence, some air emissions will occur when economic units undertake activity in other countries. Consequently, while the majority of air emissions will be released into the national environment, some air emissions from resident economic units will be released into the environment of the rest of the world. The use of the concept of residence means that air emission accounts for a nation will exclude emissions released within a national territory by non-residents (such as tourists and foreign transportation operations), whereas the emissions abroad of resident economic units will be included. Environmental boundary with respect to air emissions The nature of air emissions means that it is quite possible for air emissions released in one country to be carried through the atmosphere into the territory of another country. While these flows may be of considerable interest in understanding the state and quality of the atmosphere of a national environment, these flows are out of scope from air emission accounts as they are flows that take place within the environment Air emission accounts also do not record the extent of the capture or embodiment of gases by the environment, for example carbon captured in forests and soil. Other scope and boundary issues Included within the scope of air emissions in the air emission account is a range of other emissions that are the direct result of economic production processes. These are the emissions from cultivated livestock due to digestion (primarily methane), and emissions from soil as a consequence of cultivation, or other soil disturbances such as a result of construction or land clearance. Emissions from natural processes such as unintended forest and grassland fires and human metabolic processes which are not the direct result of economic production are excluded Secondary emissions occur when emissions from various economic processes combine in the atmosphere to create new substances. These new combinations should be considered as changes occurring in the environment and excluded from air emission accounts Flaring and venting of residual gaseous and particulate materials into the atmosphere is part of the process of extracting natural gas and crude oil. These releases are included in the air emission accounts. 107
56 3.246 Emissions from manure collected and spread on agricultural land are within scope of the air emission accounts. The use of manure is considered the dissipative use of a product and, following the general guidelines in Section 3.2, the emissions from the manure are considered flows from the economy to the environment rather than flows within the environment The air emissions generated by industries and households should be measured at the point they leave an establishment. Thus they should be measured after the substances have passed through any relevant filtering or emission reduction technology or process within the establishment For example, landfill sites may generate air emissions but may also capture these gases to produce other outputs for example, the production of energy from methane captured on-site thereby releasing different air emissions direct to the atmosphere. However, only those emissions that leave the establishment should be recorded and attributed to the waste management industry. 25 Attribution of air emissions Air emissions are released due to production, consumption and accumulation processes of industries and households. In order to permit effective linking of physical flow data to monetary data, the physical flows of emissions should be classified using the same classifications used in the SNA. For household consumption, it is necessary to consider both the purpose of the consumption and the actual product being used by households. This requires consideration of data classified by COICOP (the Classification of Individual Consumption by Purpose) and by CPC The attribution of air emissions is of particular relevance in the measurement of air emissions from durable goods such as cars. Air emission accounts should attribute the emissions according to the nature of the activity for which the durable goods are being used rather than by the characteristics of the durable good. Thus emissions from a car used for private household transport should be attributed to households, while emissions from a car used for the delivery of goods by a retailer should be attributed to the retail industry In addition to air emissions that are released through the operation of durable goods, there may also be emissions that are leaked into the atmosphere both during the operating life and after the good has been discarded. These leakages should be recorded as they occur and attributed to the owner of the good at the time of the leakage. It may be that the ownership of the discarded good is a landfill site in which case the leakages should be reflected as part of the overall air emissions from the landfill site and attributed to the waste management industry operating the site. 25 Emissions from landfill sites will include both emissions from accumulated solid waste and emissions from equipment used to operate the site. 108
57 3.252 Usually emissions from solid waste in landfill sites will not relate directly to inflows of solid waste and other materials to the site during the current accounting period but instead are emissions due to the accumulation of solid waste over time. For this reason there may be analytical interest in only considering those emissions generated through the day to day operation of the landfill sites (e.g. emissions from the burning of fuel for trucks and machines) as the emissions from solid waste cannot be directly related to broader measures of economic activity in the current period Following the general accounting treatment for the activity of general government units, air emissions generated by government are recorded against the relevant industry activity (for example, public administration). It is noted that often waste management units are operated as part of general government activity. It may be difficult to separate out these operations from within a broader general government unit by whom they may be managed. Nonetheless, given the importance of waste management activities in accounting for air emissions it is recommended that all efforts be made to identify these activities separately within the broader suite of general government activities. The relationship between air emission accounts and other accounting frameworks There is significant policy interest in air emissions particularly carbon dioxide and other greenhouse gas emissions. For different reasons, other accounting frameworks are of particular importance in relation to the SEEA air emission accounts The first is the accounting for emission inventories under the auspices of the United Nations Framework Convention on Climate Change (UNFCCC). Many countries compile relevant statistics on emission inventories on a regular basis and there are close parallels in the accounting for air emissions as described in the SEEA. The main adjustments required to bridge between SEEA air emission accounts and UNFCCC required data concern the emissions of residents abroad and non-residents in the territory. The focus of these adjustments is on land, water and air transport and national fishing vessels operating abroad The second important framework is the energy accounts described in Section 3.4. Because a significant source of carbon dioxide and greenhouse gas emissions is from the burning of fossil fuels, there are important connections between the measurement of air emissions and the measurement of energy accounts. Indeed, it is common for relevant sections of air emission accounts to be compiled based on data contained in energy accounts. 109
58 3.6.4 Accounting for emissions to water and associated releases to economic units Emissions to water are substances released to water resources by establishments and households as a result of production, consumption and accumulation processes. Emissions to water resources can constitute a major environmental problem and cause the quality of water resources to deteriorate. Some of the substances emitted into water resources are highly toxic and thus affect negatively the quality of the receiving water resource. Similarly, other substances, such as nitrogen and phosphorus, can lead to eutrophication, and organic substances can have effects on the oxygen balance thus affecting the ecologicall status of a water resource Within the SEEA framework it is relevant to account for both emissions of substances to water resources and releases of the same substances to the seweragee system by establishments and households. These releases are received and treated by sewerage facilities before emissions to water resources occur. The accounting coverage is therefore gross releasess of substances to water resources and the sewerage system by establishments and households. The relevant flows are depicted in Figure Figure Flows in water emission accounts Accounts for gross releases to water, commonly referred to as water emission accounts, present information on the activities responsible for the emissions and releases, the types and amounts of substances, as well as the destination of the emissions (e.g. water resources or the sea). Water emission accounts are a useful tool for designing economicc instruments, including new regulations to reduce emissions into the inland water system or seas and oceans. When analysed in conjunction with the technology in place to reduce gross releases and treat wastewater, data from water emissions accounts can be used in impact studies concerning the efficiency of current 110
59 technologies in reducing substances in the water and concerning the potential of new technologies. Coverage of water emission accounts Water emission accounts record the quantity of substances added to water by establishments and households during an accounting period. The quantities are expressed in terms of mass (kilograms or tonnes, depending on the substance under consideration). Water emission accounts cover: (a) substances added to wastewater and collected in the sewerage system; (b) substances added to wastewater discharged directly to water bodies; and (c) substances from non-point sources, for example, emissions and releases from urban runoff and emissions from agriculture. The water emission accounts thus provide a description of the wastewater flows described in the PSUT for water in Section 3.5, in terms of substances resulting from economic activity. The direct dumping of waste into water bodies is not covered in water emission accounts but in solid waste accounts Sources of water emissions and releases are classified as point source and non-point source. Point source water emissions and releases are those for which the geographical location of the discharge of the wastewater is clearly identified. They include, for example, water emissions and releases from sewerage facilities, power plants and other industrial establishments. Non-point (or diffuse) sources of water emissions and releases are sources without a single point of origin or a specific outlet into a receiving water resource. Water emissions from non-point sources include substances carried off the land by urban runoff and releases of substances that result from a collection of individual and small scale activities which, for practical reasons, cannot be treated as point sources. By convention, the emissions and releases associated with urban runoff that pass through sewerage facilities are attributed to the sewerage industry Emissions relating to returns of irrigation water and rainfed agriculture are described in terms of the substances that are added to the return flows of water from agricultural land, primarily fertiliser and pesticide residues in the soil that infiltrate into groundwater or run-off to surface water. Strictly, flows of substances from soil to water resources should be considered as flows within the environment and hence out of scope of the system of physical flows recorded in PSUT. However, given the significant policy interest in these flows they may commonly be incorporated into water emission accounts. Water emission account The structure of the SEEA water emission account is shown in Table Its structure is a reduced version of the general PSUT presented in Table The top half of the table is the supply table and shows the generation of water emissions and releases by industries and households by type of substance and the treatment of 111
60 releases by the sewerage industry. The bottom half of the table is the use table and shows the collection of releases to wastewater for treatment by the sewerage industry and the emissions to the environment The level of industry detail in the table is dependent on data availability and analytical interest. Where focus is on a particular type of substance, the rows of the table may be structured to reflect the destinations of the emissions and releases generated. Thus, for any particular industry or household it is possible to show the quantity of emissions that flow directly to the environment and releases that flow to sewerage facilities. The environment column may also be disaggregated to show releases to the inland water resources or to the sea For analytical reasons it may be useful to reallocate the emissions of substances by the sewerage industry to the economic unit responsible for the original release. This is often difficult to calculate as the sewerage industry usually treats flows of wastewater coming from diverse users of the sewage system in aggregate. Therefore, in general, an allocation is obtained by applying treatment or abatement rates of the sewerage facility to all releases collected by the facility. (For details see SEEA-Water.) The exchange of relevant substances with the rest of the world (imports and exports) covers the exchanges of substances associated with the release of wastewater from one economy to a sewerage facility in another economy. Water emission accounts do not include 'imports' and 'exports' of substances through natural flows of water resources. Thus, the quantity of relevant substances in rivers crossing country borders and/or flowing to the open sea are not recorded in the water emission account Included in the accounts are emissions of relevant substances from fixed assets, such as from vessels operating within a country s water resources (for example, due to corrosion or fuel leaks). These flows are recorded in the accumulation column. Finally, emissions due to activities undertaken in water resources or seas (e.g. dredging of waterways and ports) are included and recorded against the relevant industry. 112
61 * BOD (biological oxygen demand) and COD (chemical oxygen demand) are measures of substances that have an unfavourable influence on the oxygen balance. More specifically, BOD is the mass concentration of dissolved oxygen consumed under specific conditions by the biological oxidisation of organic and/or inorganic matter in water; and COD is the mass concentration of oxygen consumed under specific conditions by the chemical oxidisation with bichromate of organic and/or inorganic matter in water. 113
62 3.6.5 Solid waste accounts Solid waste accounts are useful in organising information on the generation of solid waste and the management of flows of solid waste to recycling facilities, to controlled landfills or directly to the environment. Measures of the amount of waste in aggregate or of quantities of specific waste materials may be important indicators of environmental pressure. The construction of solid waste accounts allows these indicators to be placed in a broader context with economic data in both physical and monetary terms. The definition of solid waste Following the definition provided in Section 3.2, solid waste covers discarded materials that are no longer required by the owner or user. Where the unit discarding the materials receives no payment for the materials then the flow is considered a residual flow of solid waste. Where the unit discarding the materials receives a payment but the actual residual value of the material is small, for example in the case of scrap metal sold to a recycling firm, this flow is considered a product flow of solid waste Discarded materials sold as second hand products for example the sale of a second hand car or furniture should be treated as flows of products and not treated as solid waste. In the determination of whether a material is a second hand product, consideration may be given of the extent to which the receiving unit can use the product again for the same purpose for which it was conceived In practice, in many countries, statistics on solid waste will be based on legal and administrative lists of materials determined to be solid waste. However, the principles above should provide a basis for the measurement of solid waste in countries where legal or administrative processes concerning waste do not exist or are limited in scope. These principles may also provide a basis for the establishment or amendment of lists of solid waste materials. Structure of the solid waste account The structure of the solid waste account is presented in Table It follows the logic of the general PSUT described in Section 3.2. There is no standard international classification of solid waste but for illustrative purposes the table includes an indicative listing of types of solid waste based on the European Waste Catalogue Statistical version (EWC-Stat) The upper half of the table is the supply table. The first part of the supply table, Generation of solid waste residuals, shows the generation of solid waste by industries and households. It also shows the supply of solid waste from the rest of the world (recorded as imports) and also solid waste recovered from the environment (for 114
63 example, oil recovered following an off-shore oil spill, debris collected following a natural disaster, or the excavation of soil from locations at which hazardous chemicals were used) The bottom half of the table is the use table. The first part of the use table, Collection and disposal of solid waste residuals, shows the collection and disposal of solid waste by various activities within the waste collection, treatment and disposal industry and by related activities in other industries. It also shows the flow of solid waste to the rest of the world as exports and the flow of solid waste direct to the environment The columns of the table highlight the various activities of the waste collection, treatment and disposal industry. These are landfill operation, incineration of solid waste (of which incineration of solid waste to produce energy is separately identified), recycling and reuse activities, and other treatment of solid waste. Other treatments include the use of physical-chemical processes, the use of mechanical-biological processes, and the storage of radioactive waste. More industry detail may be provided depending on analytical requirements and available information. Of particular interest may be the identification of cases where the activities just listed are undertaken as secondary or own-account production within other industries It is noted that the accumulation of waste in landfill sites is not presented in a distinct accumulation column as in the general PSUT. This is done such that all information on the waste collection, treatment and disposal industry can be presented as a single group In the second part of the supply table, Generation of solid waste products and in the second part of the use table, Use of solid waste products, the flows of solid waste that are products rather than residuals are recorded, following the distinction described above. The flows recorded here relate to cases when a solid waste product is identified at the time of disposal by the discarding unit. The flow is recorded in the second part of the supply table matched by a use of solid waste products in the second part of the use table. Sales of scrap metal would be recorded in this way Sales of products manufactured from solid waste, or simply obtained from waste collection, should not be included. For example, paper discarded by households that is collected by a charitable organisation and subsequently sold in bulk to a paper recycling firm, is only recorded in the solid waste account in respect of the initial flow of solid waste from households to the charitable organisation. 115
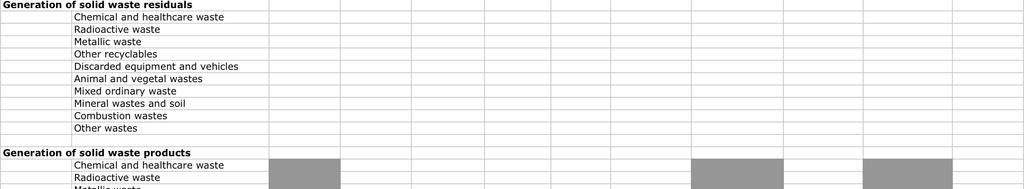
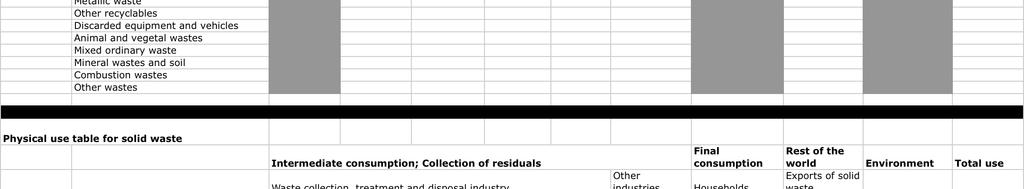

64 116