NCE- Cities Stream. Strategic Framework for Cities Linking Economic Performance and Climate Performance
|
|
|
- Vanessa Austin
- 5 years ago
- Views:
Transcription
1 NCE- Cities Stream Strategic Framework for Cities Linking Economic Performance and Climate Performance Team: Meenu Tewari, Saon Ray, Sahana Roy Chowdhury, Indro Ray, Amrita Goldar, Zeba Aziz and Vidhya Unnikrishnan 1
2 Urban in India s Climate Perspective In 2000, India emitted million tons of CO2 eq. from the energy, industrial processes, agriculture, and waste management sectors. [India s 2nd National Communication to UNFCCC, 2012] India s emissions/capita are low by global standards (1.49 tons), but growing India s commitment is to reduce emissions Intensity/GDP by 20-25% from 2005 levels by 2020 Decoupling process between emissions (per capita) and growth (energy ktoe/unit of GDP) already begun NAPCC (2008) 12 th Plan Source: WB World Development Indicators, INCCA 2010, 2 nd Natcom 2012 Probable urban origins of emissions: Transport, Industry, Buildings, Waste account for ~ 47% of emissions, >56% acc to some estimates 2
3 Why are cities important to India s growth and carbon story? India is poised at a major urban transition 91 million urban residents added in just the last 10 years 377 million urban in 2011 expected to reach 600 million by % >66% to GDP, >90% to total tax revenues, majority of non-ag jobs By % GDP, 70% of all net jobs 70-80% of India [buildings, infrastructure] that will exist by 2050 still to be built An estimated million sq.m of commercial and residential space will be needed over the next 20 years to accommodate this growth (eq. to building a Chicago every year) Decisions over these long-lived assets, demand for water, energy, land, resources, and the potential for lock-ins have huge implications for the quality of India s growth story and its carbon story 3
4 Challenges and potential for important co-benefits Costs and savings India s overall emissions low, but growing Estimates show that India s environmental externalities already cost it 5.7% of GDP Public health benefits urban pollution was the cause of 620,000 premature deaths in 2010, up from 100,000 in Acc to a CPCB survey only 2 of India s largest 148 cities have passable air quality 13 of G20 s 20 most polluted cities are in India Social inequality and vulnerability 65 million urban residents live in slums -- up from 52 million in % of slum dwellers burn biomass based cooking fuels or kerosene (rel to 20% all urban); 44% live with open drains; 33% without access to sanitation Underserved by clean water, affordable housing and transport, the poorest live in the most climate vulnerable locations in the city, Getting the urban story right is key
5 Where is the fastest urban growth taking place? 4 frontiers 1. Tier II cities (1-5 million 85% growth between , 45 cities) ( %; 3 metros slowed down to 15%) 2. The urban periphery Rapid unregulated growth at the boundary of the city Manufacturing dispersal to the periphery either due to HC orders or high price of urban land Voluntary and involuntary relocation of urban slums to periphery; some move to be near jobs New commercial and residential development, large middle class gated communities Assault on ground water, reliance on polluting diesel generated power, no pubic transit, poor waste disposal severe carbon and urban productivity implications/ raises the boundary question 3. Census towns vs. statutory towns Between 2001 and 2011 of the 2750 new towns that were added, 2509 (or 91%) were census towns All urban criteria present except statutory status that brings with it a municipal governance structure and an urban budget If you add large rural villages with all criteria except 1 urban levels in India would be closer to 50% than the current 31% MNREGs Urbanization by stealth, and the lock in implications of this labeling/funding mismatch 4. Metros Sites for urban redevelopment, brown-field development and retrofitting of aging stock 5
6 What does this growth look like? HI-LU-LC Million Plus Cities States not considered High Income, High Urban, High Carbon Karnataka (1), Andhra Pradesh (3), Punjab (3), Tamil Nadu (4), Gujarat (4), Haryana (1), Maharashtra (6), Goa and Delhi High Income, High Urban, Low Carbon LI-LU-LC LI-LU-HC LI-HU-LC Kerala (7) High Income, Low Urban, Low Carbon Himachal & Uttarakhand Low Income, High Urban, Low Carbon West Bengal (2) HI-HU-HC Low Income, Low Urban, High Carbon Jharkhand (3) & Chhatisgarh (2) HI-HU-LC Low Income, Low Urban, Low Carbon Bihar (1), Uttar Pradesh (7), Assam, Orissa, Madhya Pradesh (4), Rajasthan (3) & Jammu and Kashmir (1)
7 There are multiple pathways to lower carbon urban growth 1. High Growth, High Urban, High Carbon Maharashtra (Mumbai, Pune, Pimpri-Chinchwad, Nashik) - Mumbai: large, but dense, compact with relatively low vehicle ownership per 1000, and congested but efficient public transport & successful decongestion (BKC), Water security, building standards); Pune: distributed development, with relatively low commute times Gujarat (Surat, Ahmedabad, Rajkot) 2. Low growth, low urban, low carbon The traditional BIMARU states, and resource intensive states 3. High growth, high urban, low carbon states Kerala - Fastest urbanization in the last 10 years, but a different kind city formation. Agglomeration economies harnessed by putting a boundary around many small towns 4. High growth, low urban, low carbon states (Himachal, Uttarakhand) 5. Low growth-high urban-low carbon states (West Bengal) 6. States in transition: from low growth-low urban-low carbon to higher growth, higher urban and relatively low carbon Madhya Pradesh with its many innovations in Bhopal and Indore- BRT, electricity reform, roads, housing. 7

8 What are the major sources of urban emissions? Industry: - 27%; Transport: 8%, Buildings: 7.2%, Waste 3% = 45% Each has important mitigation and adaptation potential Planning Commission 8
9 1. INDUSTRY: Energy intensity, Emissions intensity Largest consumer of electricity (34 percent), followed by agriculture (30) Share of energy in manufacturing cost is high in 16 key sectors: (1) cement, (2) caustic chlor, (3) aluminium, (4) glass, (5) ceramic, (6) copper, (7) paper, (8) fertiliser, (9) foundry, (10) synthetic textiles, (11) textiles, (12) engineering, (13) tyre, (14) drugs and pharma,(15) dairy and (16) sugar Identified as targets for policy efforts to reduce energy intensity by IREDA and CII KEY STRATEGIES: PAT Scheme (Perform, Achieve, Trade) under the National Mission for Enhanced Energy Efficiency in Industry (NAPCC) sets out energy efficiency targets for 15 industries in a market mediated process. [no carbon credits, so markets don t function; SMEs left out of the picture] Energy audits compulsory in large energy consuming units in nine industrial sectors since March 2007 Energy labeling program for appliances launched in 2006 BEE Minimum efficiency standards efficiency bandwidth of the sector divided into 4 bands. And energy efficiency improvement targets set out within each band (from current levels for each unit to the highest within its band).

 State Categories (5) (1)")
10 Million plus cities with number of energy intensive industries (2) (20) (8) (12) (4) State Categories (5) (1) (1)
11 2. Transport Population (million) Vehicular ownership grew at a rate 5-6 times that of the population growth rate in select million plus cities ( ) 39% ( ) 35% ( ) 15% Share of 2-wheelers increased from 48% in 1981 to 72% in 2012 (2-wheelers + cars increased from 70% in 1981 to 85% in 2012) Share of the public transport has decreased from 11% in 1951 to 3% in 1981 to 1.1% in In 2009, only 20 out of 85 Indian cities with a population of 0.5 million had bus services. ~ 23% - 40% of the projected abatement in the transportation sector lies in the modal shift from private to public modes of transportation (23% - Planning Commission 2011; 40% - McKinsey 2009) UAs pop 1-2 million UAs pop 2-5 million UAs pop 5-10 million UAs pop >10 million 40% 35% 42% 30% 50% 47% 45% 27% 23% Vehicles (million) ( ) 69% ( ) 152% 130% 307% 169% 219% 200% 101%


12 City Size and Mode Choice Access to public transit grows with city size Smaller cities rely far more on polluting two wheelers, cars and IPT Walkability and NMT falls with city size in the Indian context 12
13 Size, density and its non-linear association with travel behavior Vehicle Density and Carbon intensity (kgco2/capita/year) in the select million plus cities 1-2 million 2-5 million 5-10 million >10 million Reddy, B. S., & Balachandra, P. (2012). Dynamics of Urban Mobility: A Comparative analysis of megacities of India.
14 Comparing the Mega-Cities (pop > 10million) Kolkata, Mumbai & Delhi City Vehicle Ownership (per 1000) 2W Share Modal Share (%) Car Share 3W Share Bus Share Transport energy intensity (GJ/capita/year) Carbon emissions (tco2/year) Carbon intensity (kgco2/capita /year) PM-10 Annual average* (μg/m3) Kolkata Delhi , Mumbai , *2010 Data, Rest 2005 Population growth in mega-cities Vehicle growth in mega-cities Source: Census of India


15 Kolkata Population (2011): 14 million Density: 24,000 p/sq.km Road Density: 5% Delhi Population: 16 million Density: 11,000 p/sq.km Road Density: 21% Mumbai Population: 18 million Density: 26,000 p/sq.km Road Density: 11% Source: IIHS, 2011,

16 Buses and Abatement: Prabhu and Pai 2011 A bad reduced emissions by 70,000 t/yaer on avg Projected to save 2/3rds by 2031 Rel low cost Quick wins 16
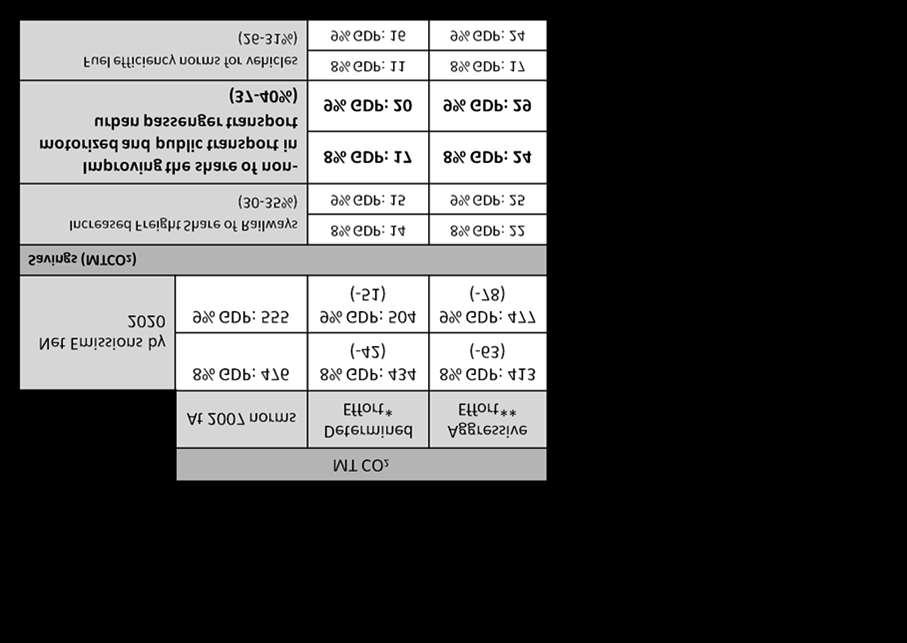
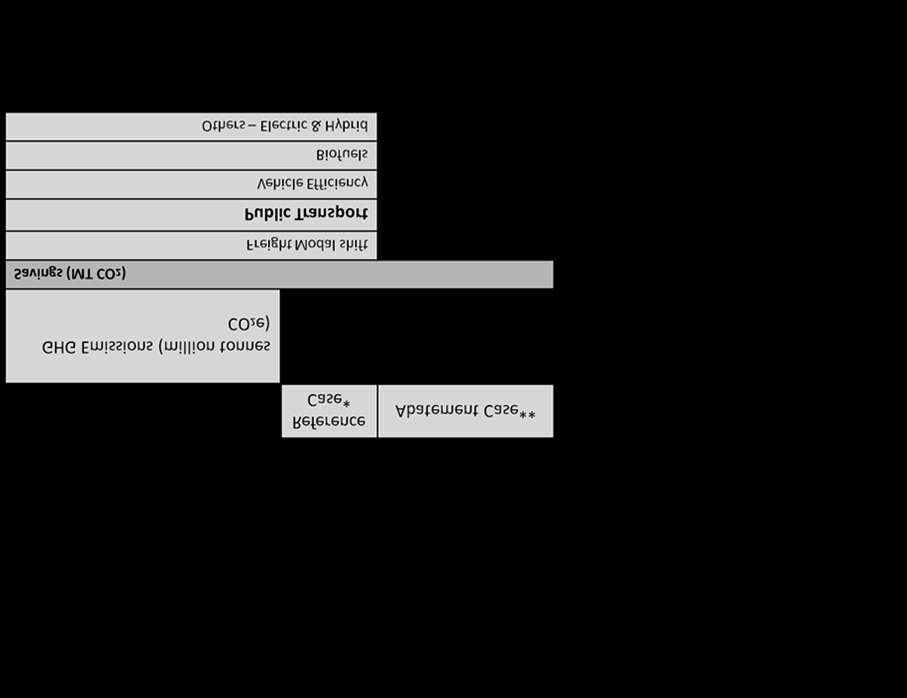
17 Abatement Potential in the Planning Commission s Low Carbon Strategy (2011) 1. Avoid: reduce demand for travel through land use planning. Location criteria for industries so as to minimize movement of goods and inputs Locating worker housing near industrial zones Using the National Urban Housing and Habitat Policy to ensure mixed use, dense cities Promoting ToD, discouraging sprawl can reduce transport energy demand in Indian cities by 20% by 2030 (TERI 2011). 2. Shift: promote the use of more carbon efficient modes of transport and achieving the abatement potential through achievement of some of the underlying assumptions of modal shift. could lead to a potential decrease in fuel demand by 21% and CO2 emissions by 20% from BAU by 2030 if share of buses is increased to 75% in Indian cities (TERI 2011). 3. Improve: This strategy is focused towards carbon efficient technologies in various modes of transport, including private vehicles. a 17% reduction is achievable against BAU in motor fuel consumption in Indian cities if fuel efficiency of vehicles can be improved by 20% by 2030 (TERI 2011). 17

18 18

19 19
20 3. Buildings: Combining green growth with jobs, urban form and mitigation/adaptation co- Sector emission: Mt CO2 in 2007 (~12.6% of total) (Indian Network on Climate Change Assessment, 2010) Energy Consumption: Ktoe (39.8% of total) (IEA) 2 NAPCC Missions ( NMSH & NMEEE) incorporate the buildings sector Crucial for future growth, esp. urban ( acc. to some estimates 80% of India still to be built /rebuilt construction a major future growth sector Potential source of green jobs Building energy demand stems from two parts - Building design & Lifestyle of Inhabitants Both Aspects covered by policy: e.g. BEE s Energy Conservation Building Code/Green Buildings codes & Standards (e.g., appliance energy efficiency improvements under BEE s Star Rating) Globally recognized as the sector with the highest potential (29%) for emissions reduction (IPCC) Expert Group on Low Carbon Strategies finds a 60 Mt abatement potential for commercial Buildings Based on their recommendations, the 12 th Plan also lists out Lighting, Labeling, and Super efficient appliances and Green Building codes as a focus area 20
21 Missed opportunities Current prioritization based on do-ability and technology solutions (lighting, appliance standards) BUT, Cooking (which accounts for more 60% of residential demand) largely ignored by climate policies From an urban perspective urban biomass based cooking still 20% (47% in urban slums) - cobenefits ( indoor air pollution, black carbon)- needs to be recognized; renewed policy emphasis on improved cookstoves is potentially low hanging fruit Issues related to urban LPG, Kerosene consumption such as politically-sensitive fossil fuel subsidies, demand management, and better targeting to avoid diversion Trends for 53 million plus cities analyzed for lifestyle and housing patterns (NSSO 66th Round CES, 65 Round Housing Condition Survey ) show extremely high diversity Huge disparity in energy choices and consumption levels between economic classes With progress, huge surge in unmet demand for energy and land expected from the LIG & MIG need to exploit before saturation window closes; can customize incentives 21
22 Building Design: Abatement potential & leveraging interactions Policy dictated move towards EE buildings rather than Green (NMSH) Twin track strategy BEE s ECBC and MNRE s GRIHA (Green Building Code) The Green Buildings concept is broader than energy efficient buildings incorporates elements not just of energy consumption but also water intensity of construction, waste management, renewable incorporation Case studies show a cost increase (6-18%) but energy saving potential (25-30%) In a EE based ECBC policy paradigm connection load requirements of 100 KW effectively exclude the residential space (which is the largest share of the pie- 77.1%) 22
23 Barriers to Green/EE buildings Barriers to Green/EE improvements in literature Access to finance: MNRE gives capital subsidies for renewables, but EE requires continuous monitoring and auditing financial markets not developed. Lack of technical manpower (supervisors/ contractors as well as skilled laborers) Grey zone of unauthorized construction: outside of building bylaws /construction directives Problem of Small scale and split incentives additional barriers Small scale limits consumer access to funding and technical assistance Construction and ownership with 2 diff parties knowledge not transferred, O&M suffers, standards are low Aggregate demand for Green Building via joint housing schemes in pvt. societies or in the public sector (RAY (EWS) and JNNURM (Slum- Upgrading) overlap of mandate SVAGRIHA rating system provides answers (projects with built-up area less than 2500 sq. m) Pune s Eco-housing Assessment Criteria also an option. Hudco/MoUD programme for training and skill development for green construction sector is key. Offers both mitigation and adaptation potential 23
24 Percentage of Households 4. Water: a key emerging challenge Kannur Malappuram Thrissur Kollam Asansol Kozhikode Jamshedpur Kochi Allahabad Srinagar Jodhpur Varanasi Durg-Bhilai Nagar Gwalior Thiruvananthapuram Kota Ranchi Raipur Jabalpur Chandigarh Tiruchirappalli Dhanbad Aurangabad Meerut Amritsar Agra Madurai Coimbatore Vasai Virar Patna Rajkot Faridabad Vijayawada Nashik Ghaziabad Ludhiana Bhopal Indore Vadodara Visakhapatnam Kanpur Nagpur Lucknow Jaipur Pune Surat Kolkata Chennai Ahmedabad Hyderabad Bangalore Mumbai Delhi Million Plus Cities in 2011 (Arranged by population size in ascending order) % Household_Groundwater_2011 % Household_Tap_2011 Linear (% Household_Groundwater_2011) Linear (% Household_Tap_2011) Larger cities better connected to piped water networks than smaller cities. Smaller cities have a high degree of dependence on groundwater (the newest million plus cities have the greatest deficits); overexploitation of ground water a major problem Presence of piped networks not enough; need to consider the main source of water (along with network coverage) as many cities use ground water in their piped networks.
25 Surface and Ground Water Tensions Surface and ground water tensions: India is moving away from surface water to groundwater source. E.g., Amritsar and Faridabad Amritsar (1.4 million people) Three-forth of its households is served by city s 258 tubewells while the rest depend on private tubewells and borewells. Between these two sources and few large institutions, 341 MLD of groundwater is extracted; water tables were at 23m in 2005; declining by 50cm/yr; contaminated shallow water is pushing people to dig up to 50 m (handpumps) and m for tubewells. + electric power + polluting diesel fueled pupsets Faridabad (1.5 million people) On the outskirts of Delhi, on the banks of the Yamuna. At least 3 lakes in vicinity. 15,000 sme and large firms, accounts fro 60% of haryana GDP. Yet relies wholly on piped ground water. Yamuna water polluted due to effluents dumped by upstream Delhi. Lakes contaminated. This shift has triggered mainly water supply-side adaptation policies under the National Water Mission under National Action Plan for Climate Change, National Water Policy (2012), and 12 th Five Year Plan ( ), including 70% of JnNURM funds But, key Issues like ground water recharge, water pollution, waste-water treatment, water recycling, conservation, and demand management are severely neglected.
26 The responsibility of providing local infrastructure is usually entrusted with the local government and the ability to provide good infrastructure service is dependent on the local government s revenue generating capacity. Low to begin with, the revenue raising capacity of Indian ULBs has been declining % Share of own revenue raised by ULBs as % of total revenue Countries India 0.94 % Municipal revenue as % of GDP Brazil 5% 48 South Africa 6% Source: Thirteenth Finance Commission taken from IFMR. Source for India: Thirteenth Finance Commission for the year
27 Sector No. of Projects No. of Projects completed Approved Cost (cr.) Approved Cost (%) Water Supply ,638 34% Sewerage ,504 26% Drainage ,054 12% Solid Waste Management ,963 11% Roads & Flyovers ,681 8% Mass Rapid Transit System ,520 3% Other Urban Transport ,651 2% Others % Total , % JNNURM 2014 PROJECTS SANCTIONED UNDER UIG And 23% of total approved cost for all transportation projects under JNNURM Water Supply Sewerage Roads & Flyovers Drainage Mass Rapid Transit System Shift to Public transport has an abatement potential of about 17 MT CO 2 (plng comm) yet the level of investment received under JNNURM has been low Solid Waste Management Other Urban Transport Others No. of Projects Approved Cost (in 100 cr.)
28 Need for alternative sources of financing JnNURM funds have been key, but there is a greater need for ULBs to develop alternative financial mechanisms as JNNURM funds are insufficient to meet the growing infrastructure needs. HPEC has estimated an investment requirement of 39.2 lakh crores for urban infrastructure and JNNURM funds can cover only a meager part of it. With a combined fiscal deficit of 7.2% of GDP, it is impossible for the Central and State government to independently finance the investment requirement. Thus local bodies need to tap additional financial sources to fill the investment gap. Generation of own sources of revenue will also enable ULBs to meet the long run operation and maintenance expenditure of the created assets. Generating revenue through innovative mechanisms like accessing debt markets or through bonds and pooled financing helps in achieving dual goals of governance reforms and access to finance. Debt markets (as opposed to loans) may create incentives for ULBs to bring in management reforms, reduce operation & maintenance inefficiencies, generate surplus and upgrade the skills of the municipal workforce.
29 National Action Plan on Climate Change India s Commitment: 20-25% Reduction in energy intensity from 2005 levels by 2020 National Mission Objectives Urban Context National Solar Mission (1.7%) Enabling environment to deliver 20 GW of solar power by 2022 National Mission on Sustainable Habitat (0.4%) National Mission on Green India (18.3%) National Mission for Sustaining the Himalayan Ecosystem (0.5%) National Mission on Enhanced Energy Efficiency (0.2%) National Water Mission (35.4%) National Mission for Sustainable Agriculture (43%) National Mission on Strategic Knowledge on Climate Change (0.5%) Extension of Energy Conservation Building Code optimization of energy demand) Urban planning/shift to public transport: long-term transport plans for small/medium cities Recycling of material and urban waste management: power from Waste Double area under afforestation in the next 10 Years monitoring of Himalayan ecosystems Market-based approaches for energy consumption reduction Perform and Trade Initiatives (PAT) Conservation of water, minimizing wastage and ensuring its more equitable distribution Low input sustainable agriculture Promotion of climate science Research and Data sharing 29
30 National programmes with urban themes that complement the NAPCC Programme Objective Nodal Agency MGNREGA JNNURM NFSM, IWMP focuses on works on water conservation, drought-proofing, afforestation, tree plantation, minor irrigation works, land development, flood control and protection, drainage in water-logged rural areas creates non-ag employment focuses on efficiency in urban infrastructure and service delivery mechanisms, community participation, and accountability of ULBs restoring soil fertility and productivity, Restore ecological balance by harnessing, conserving, and developing degraded natural resources such as soil, vegetative cover, and water impacts on water sheds and wetlands MoRD MoUD MoA NAP develop the forest resources with people s participation non-ag jobs MoEF APDRP, NEP, TP, RGGVY Share of electricity from non-conventional sources to be increased (RPOs), feed-in tariffs, promotion of decentralized distribution and generation (DDG) in remote villages, reduction in T&D losses power sector reforms MoP State Plans M.Gandhi National Rural Employment Guarantee Act; Jawaharlal Nehru National Urban Renewal Mission; National Food Security Mission; Integrated Watershed Management Program; National Afforestation Programme; Restructured & Accelerated Power Developmen and Reforms Programme; National Electricity Plan, Tariff Policy, Rajeev Gandhi Grameen Vidyuditikarn Yojna 30
31 Conclusions 1. India is at the brink of a major urban transition 70% of the country is still to be built The quality and productivity of India s cities will thus centrally shape India s economic growth story and its carbon trajectory 2. BAU is not an option it can lock India into irreversible investments in long lived assets and infrastructures that are inefficient, costly and high carbon. 3. Innovative urban growth is good for the economy, good for the climate and good for the poor Controlling for population size, we found that more urbanized states in India tend to have high per capita income, thought not necessarily a high share of the poor and vulnerable: governance, institutions and policy interventions play a crucial role in optimizing the benefits and costs of urbanization. 4. Indian data show that there might be multiple pathways to a high-growth, rel. low carbon urban outcome (TN, Gujarat, Kerala, Uttarakhand, an emergent MP). 5. Innovative sources of finance will be critical central sources imp, but municipalities need to raise their own revenue from a diversified set of sources (monetizing land, debt based, pooled) 31
32 Conclusions - II 7. Projectization, and a siloed sectoral focus leads to segmentation and many missed institutional opportunities, and interactions that are key; redundancy and overlap in other cases Plays into the challenge of not seeing funds for climate action 8. Need dedicated O&M funds the risks of financialization 9. Building institutional capacity at the municipal level is key 10.Urban water security is going to be a central challenge imp both for adaptation, but also Mitigation potential e.g, Access to direct household water connection minimizes electricity consumption That may be required by households to extract groundwater. It is estimated that ground water demand will increase by 980 million cubic meters (MCM) by 2050 and it would require 100 GWh of electricity to extract 1 BCM of water. Efforts taken by municipalities to provide direct household water connection has the potential to reduce electricity consumption required for ground water extraction. 32
33 Conclusions III 10. Increased usage of fuel efficient vehicles, modal shift from private vehicles to public transport, non-motorized transport are key mitigation mechanisms are quick wins 11. The urban density and carbon relationship is non-linear (e.g., density from Overconcentration vs planned mixed use development supported by urban planning policies) 12. Pursuing energy-efficient industry and green building (and not just energy efficient buildings), fuel diversification and energy efficient product standards simultaneously with principles of conservation (water, energy, fuel waste). 11. Institutional innovations and reforms that break bottlenecks and lower the cost of leveraging the co-benefits of pursuing multiple objectives and interactions Simultaneously (across funding lines, agencies and tasks water and energy) 33