CONSIDERATIONS FOR ESTIMATING PAVEMENT TREATMENT LIVES AND PAVEMENT LIFE EXTENTION ON FLEXIBLE PAVEMENTS Volume 1
|
|
|
- Brice Whitehead
- 5 years ago
- Views:
Transcription
1 CONSIDERATIONS FOR ESTIMATING PAVEMENT TREATMENT LIVES AND PAVEMENT LIFE EXTENTION ON FLEXIBLE PAVEMENTS Volume 1 By Jorge B. Sousa, Ph.D George Way, PE Consulpav August 11, 2007 (Edited )
2 Table of Contents 1 EXECUTIVE SUMMARY... 4 Acknowledgment... 5 Disclaimer INTRODUCTION Background Purpose of Study Study Objective STUDY APPROACH-ESTIMATING TREATMENT LIVES Estimate of Treatment Lives How to Bring in the Effect of Climate in Life of Treatments? How to Bring in the Effect of Traffic in Life of Treatments? How to Bring in the Effect of Existing Pavement Condition? How to Bring in the Intrinsic Maintenance Material Properties Effect of Amount of Binder on treatment life Type of Binder TREATMENT PERFORMANCE Capacity Effects of WATERPROOFING on treatment life TREATMENT LIVES Vs. TREATMENT PERFORMANCE CAPACITY (TPC) CONCEPTS ABOUT PAVEMENT LIFE EXTENTION Introductory concepts Evaluation of the Reduction of Pavement Strength with Cracking Level Considerations for rigid pavements CONCLUSIONS AND RECOMMENDATIONS Conclusions Recommendations REFERENCES List of Tables Table 1- Maintenance Pavement Treatments Used by Caltrans (Flexible and Rigid Pavements) Table 2 - Maintenance Treatment Thickness and Asphalt Content (Gallons per Square Yard or Percent Asphalt in the Mix) Table 3 - Ratios of Strain Energy at Break Table 4 - Treatment Performance Index Table 5 - Waterproofing Index for various treatments Table 6 - Increase in Treatment Structural Life due to Treatment in Years Table 7 - Life Extension for Maintenance Treatments in Coastal and Valley Regions Table 8 - Life Extension for Maintenance Treatments in Mountain Regions Table 9 - Life Extension for Maintenance Treatments in Desert Regions
3 List of Figures Figure 1 - Pavement Condition vs. Life and Type of Work Required... 7 Figure 2 - Effect of too much water in the roadway (API 2005)... 8 Figure 3- Maintenance Treatment Lives (Hicks 2006)... 9 Figure 4- Climate Regions Proposed For California- Coastal, Valley, Mountain and Desert... Error! Bookmark not defined.12 Figure 5 - Relation between TREATMENT PERFORMANCE CAPACITY and ESTIMATED LIFE OF TREATMENT when applied over GOOD pavements in Coastal and Valley areas Figure 6 - Relation between TREATMENT PERFORMANCE CAPACITY and ESTIMATED LIFE OF TREATMENT when applied over FAIR pavements is Coastal and Valley areas... Error! Bookmark not defined.22 Figure 7 - FWD sensor number 1 deflection versus AC Pavement Layer Thickness... Error! Bookmark not defined.24 Figure 8- AC Pavement Layer Thickness versus ESAL s of traffic loading... Error! Bookmark not defined.25 Figure 9- AC Pavement Layer Thickness versus aggregate Base Layer Thickness... Error! Bookmark not defined.26 Figure 10 Reduction of AC Layer Moduli versus percent cracking... Error! Bookmark not defined.27 Figure 11- Reduction of Subgrade Layer Moduli versus percent cracking Figure 12 - Reduction of Base Layer Moduli versus percent cracking Figure 13 Increased Structural Pavement Life versus percent cracking at time of treatment... Error! Bookmark not defined.34 Figure 14 -Remaining Structural Life (ESALs) versus Time in Years for Fair Condition Error! Bookmark not defined.39 Figure 15 Ratio of Life extension / Treatment Life function of Percent (%) Cracking at Time of Treatment for Valley/Costal Region Appendices A-Summary of Estimated Treatment Lives for Various Regions B-Summary of FWD Deflection Analysis.56 C-MODCOMP5 Pavement Modulus Back-Calculation Program Results...63 D-BISAR stress and strain results...73 E-Increase in Treatment Structural Life due to Treatment in Years Calculation Inputs..79 3
4 Executive Summary The California Department of Transportation (Caltrans) employs a variety of pavement preservation treatments to maintain and preserve their network of paved highways. The primary purpose of the proactive pavement preservation program is to delay the need for costly pavement rehabilitation or reconstruction. History has shown that reducing such costly repairs is enhanced by maintenance treatments sealing out moisture which adds to the structural integrity and endurance of almost every pavement and reduces the deleterious action of water. Historically the degree of structural reinforcement of these thin maintenance treatments (less than one inch) has been difficult to estimate in a rational manner. The purpose of this study is to estimate in a rational manner the pavement treatment life and pavement life extension (amount of time to rehabilitation treatments are delayed) as shown in Figure 1. Figure 1- Maintenance Treatment Lives (Hicks 2006). This report focuses on an applied research effort to develop tables that estimate treatment lives and life extension for 30 maintenance treatments commonly used in California. For purposes of this study it was assumed (and later confirmed by the analysis) that maintenance treatments 4
5 placed on good pavements will last longer than treatments placed on bad pavements. Likewise it was postulated (and later verified by experience) that treatments perform better if they have more binder, are made with better binder and are thicker (i.e. more long lasting and more waterproofing). Since pavement distress data was not readily available in the California pavement management system, data from other sources was used to develop the draft rational model. Data from Arizona Department of Transportation such as percent cracking, Falling Weight Deflection, pavement thickness and traffic loading was used extensively to develop the rational model under the assumption that life extension is related to the degree of waterproofing provided by the treatment. Flexible pavement maintenance lives in years were estimated for 23 Flexible Pavement Maintenance Treatments. Estimates were developed for three climate regions, three traffic levels and three cracking distress levels. In all 621 average and 621 standard deviation values were developed based upon the collective experience of the Pavement Preservation Task Group (PPTG) and to a limited degree the Authors experience. Average treatment lives for flexible pavement maintenance treatments ranged from no improvement to an average value of as much as 12 years. Similarly for Rigid (concrete) pavement maintenance lives, values in years were estimated for seven Maintenance Treatments. In all 189 values were estimated for the rigid pavement maintenance treatment lives. Treatment lives for flexible pavement maintenance treatments ranged from no improvement to an average value of as much as 17.5 years. Likewise 621 values were estimated for the flexible pavement treatment life extension from the proposed rational layer elastic analyses model controlling the strain on the bottom asphalt layer (note the model does not consider the effect of reflective cracking). Pavement life extension lives ranged from no improvement to as much as 4.9 years. It should be noted that the rational estimated life extension lives represent the additional structural life gained from sealing the pavement and controlling the moisture in the base, subbase and subgrade. The rational life extension does not include the additional life from reducing reflective cracking which in many cases may be longer than that from sealing out the moisture alone. Additional research is needed to rationally model rigid maintenance treatment lives. It is recommended that based on this study further research be conducted to develop a model to relate treatment life as a function of Treatment Performance Capacity (TPC), pavement condition, traffic level and climate region. It is further recommended that an investigation be made to quantify using CALTRANS data, if available, or other applicable data to estimate the effect of water penetrating in the pavements in the four different climatic regions in California. It is also recommended that the structural life extension be further revised to take into consideration aging of material components and the reflective cracking of pavement layers through the treatments. In this way the values obtained for structural life extension may be 5
6 more in line with perceived expectation from pavement engineers that decide on reconstruction based on actual visible pavement conditions. Finally a thorough cost benefit analyses quantification of the optimum time to apply a treatment should be investigated. 6
7 Acknowledgment The authors thank Dr. Gary Hicks and Dr. Shakir Shatnawi for their assistance on this project. In addition, much thanks to Dr. Kamil Kaloush of Arizona State University who assisted in reviewing the project and assembling project data. Disclaimer The contents of this report reflect the views of the authors. The authors do not endorse specific products or manufacturers. Trade or manufacturers names appear herein solely because they are considered essential to the object of this report. 7
8 2. INTRODUCTION 2.1 Background The California Department of Transportation (Caltrans) employs a variety of pavement preservation (preventive maintenance or corrective maintenance) treatments to maintain and preserve their network of paved highways as shown in Figure 1 (Caltrans Maintenance 2003). The primary purpose of the proactive pavement preservation program is to delay the need for costly pavement rehabilitation or reconstruction. Figure 1 - Pavement Condition vs. Life and Type of Work Required The history of the use of these various maintenance treatments reaches back as far as 1949 (Hveem 1949) if not earlier. Hveem discussed the purpose of the seal coat, although his discussion can be applied to many different types of maintenance surface treatments. He noted the term "seal coat" was to seal the road surface; that is, to prevent surface water from penetrating the pavement or base. However, all highway engineers will recognize that a surface treatment of asphalt and screenings may be applied to a road to accomplish one or more of several distinct purposes. Distinct purposes enumerated for seal coats are as follows (Hveem 1949): 1. Seal the road to the entrance of moisture 2. Develop a non-skid surface on the existing road 3. Apply fresh coatings of aggregate which will enliven and provide an all weather surface to improve wear resistance 4. Reinforce and build an adequate pavement surface 8
 noted that the structural integrity and endurance of almost every pavement is jeopardized by the action of water.")
9 5. Provide new stripping between lanes. 6. Improve luminosity. Hveem identified sealing out moisture as the primary reason for a seal coat application. Later he (Hveem 1950) noted that the structural integrity and endurance of almost every pavement is jeopardized by the action of water. He went on to state that in its simplest form, one of the major problems confronting the civil engineer is the necessity for guarding against or combating the deleterious effects arising from the action of water upon the materials of construction. Thus maintenance surface treatments need to be able to some degree to seal out water (see Figure 2). Figure 2 - Effect of too much water in the roadway (API 2005) 2.2 Purpose of Study Historically thin pavement preservation treatments less than one inch in thickness are considered to improve one or more of the distinct purposes enumerated by Hveem, but the degree of structural reinforcement, if any, of these thin treatments has been difficult to estimate. The purpose of this study is to estimate in a rational manner the pavement treatment life and pavement life extension (amount of time rehabilitation treatments are delayed). In addition, this study is being conducted to help establish the cost effectiveness of pavement preservation treatments, information on treatment lives and life extension associated with applying a given treatment. Life extension is defined as the time the treatment delays the need for rehabilitation. Treatment life does not necessarily equal life extension; it is generally less depending when the treatment is placed as shown in Figure 3. 9
10 Figure 3- Maintenance Treatment Lives (Hicks 2006) This report focuses on developing estimates of pavement treatment life and life extension in flexible pavements which can readily be used by practitioners for a number of maintenance treatments in flexible pavements. Table 1 shows the treatments that were considered for this study. In all 30 maintenance treatments were identified to be studied to estimate the treatment life. However, life extension analysis was only conducted for flexible pavements because of the proposed budget. All the treatments involve the use of asphalt based materials and may be applied very thin like a fog seal or as thick as a one inch HMA surfacing. Additional work is still needed for rigid pavements. 10
11 Table 1- Maintenance Pavement Treatments Used by Caltrans (Flexible and Rigid Pavements) Maintenance Treatment Maintenance Treatment Maintenance Treatment Portland Cement Hot Mix Asphalt (HMA) Asphalt Concrete (AC) Concrete (PCC) 1 HMA Crack Sealing 14 Conventional HMA, 1 inch 24 Crack Sealing 2 HMA Crack Filling 15 Open Graded OGAC, 1 inch 25 Diamond Grinding 3 Fog Seals 16 PBA HMA, 1 inch 26 Partial Depth Spall Repair 4 Rejuvenator Seals 27 Full Depth Spall Repair 5 Scrub Seals Rubberized AC (RAC) 28 Dowel Bar Retrofit 6 Slurry Seals 17 RAC-G Gap Graded, 1 inch 29 Random Slab Replacement 7 REAS Slurry Seal 18 RAC-O Open Graded, 1 inch 8 Micro-Surfacing 19 RAC-O(HB) High Binder, 1 inch 9 Polymer Modified Emulsion (PME) Chip Seal 10 Polymer Modified Asphalt (PMA) Chip Seal Bonded Wearing Course (BWC) 11 Asphalt Rubber (AR) Chips 20 BWC- Open, ¾ inch Seal 12 Asphalt Rubber Cape Seals 21 BWC- Gap, ¾ inch AR (slurry) ½ inch 13 Asphalt Rubber Cape Seals 22 BWC- RAC- G, ¾ inch AR (micro) 3/4 inch 23 BWC- RAC-O, ¾ inch 2.3 Study Objective This report focuses on developing tables that estimate treatment lives and life extension for the 29 treatments which can be readily used by practitioners. As such new tables representing the expected life of treatments in each of the major climate zones in California are included in this report. Also it was recognized that heavy traffic affects treatment lives more than light traffic. The proposed tables reflect the traffic index (TI) as used by Caltrans, but they can be easily converted to the standard AASHTO 18-kip equivalent single axle loads (ESAL s) using the following equation. TI = 9.0*(ESAL s/1,000,000)^0.119 [1] The estimated life information compiled in this document is based on the collective experience of the Pavement Preservation Task Group (PPTG) to which the experience and best 11
12 engineering judgment of a few experts in the industry was added. It should be noted that not all the treatments used in California are as of yet included in this report. Such treatments, particularly concrete treatments, will be addressed in future studies. The data still needs to be verified using actual performance data from the existing Caltrans performance data bases or pavement management systems. The life of the treatment is highly dependent on the timing of the treatment, the traffic it experiences, and the climate it is placed in. Treatments placed on good pavements will last longer than treatments placed on bad pavements. Many times, a treatment is scheduled to be placed on a good pavement, but by the time it is actually placed the condition of the pavement has deteriorated and this will affect the expected live of the treatment. The lives of the treatment are also dependent on the level of traffic and strongly dependent on climate (coastal, valley, mountains, and desert) in which the treatment is placed. 3. STUDY APPROACH-ESTIMATING TREATMENT LIVES 3.1 Estimate of Treatment Lives This study first focused on estimate of treatment lives. The tables in Appendix A show the estimated treatment life for the various treatments. These tables were first developed by the PPTG strategy selection committee, although the original tables were in ranges of average life. As part of this study, it was requested by Caltrans that the PPTG original tables be converted into the average and standard deviation of treatment life for each treatment. The author s (with the assistance of Dr. Kamil Kaloush) made the requested conversion as it is shown in Appendix A. The author s also considered that the treatment lives should be adjusted for different climatic regions. It was decided that the treatment lives developed by the PPTG most appropriately fit into the Coastal and Valley areas (PG and PG 64-16). Following this approach, Appendix A presents the tables that were developed for the Mountainous region (PG 64-28) and the Desert region (PG 70-10). The Mountainous and Desert values represent the estimates of the treatment lives based on the experience of the author s and Dr. Kaloush and like the Coastal and Valley values represent a surrogate group of values based on engineering experience and judgment. This was done in lieu of real California performance data. In the future, is it anticipated that the Caltrans pavement management system will provide more objective measures of treatment life for the various climate regions. Appendix A takes into consideration that the treatments are strongly affected by climate, traffic and pavement condition it was considered important to try to evaluate their lives as a direct function of the treatment itself and these key factors. 3.2 How to Consider the Effect of Climate on Treatment Life? The first step was to identify significant climate zones that affect the performance of the maintenance treatments. It was considered that the expected life of a treatment and life extension will be influenced by the weather. To facilitate integration with other areas, it was 12

13 decided to consider four tables of expected performance one for each PG region in which California has been divided as shown in Figure 4. Figure 4- Climate Regions Proposed For California- Coastal, Valley, Mountain and Desert 3.3 How to Bring in the Effect of Traffic in Life of Treatments? It was recognized that traffic is also a key aspect which affects the life of maintenance treatments. However the number of automobiles is not a key factor. The recognized factor that affects any treatment is the effect of heavy traffic which is defined by the American Association of State Highway and Transportation Officials (AASHTO) in 18-kip equivalent single axle loads (ESAL s). Caltrans uses the Traffic Index which can be easily converted into ESAL s. Also most structural analyzes and reflective modeling programs require some input in terms of stress and stress caused by actual loads that can be derived from ESAL s. Likewise, the traffic and truck volume are incorporated to the degree by categorizing into three major trafficgroupings1) Interstate which has a high truck percentage, 2) non- interstate divided routes (includes sections with four or more lanes that might not be divided) which has a lower percentage of trucks and non-interstate, and 3) non-divided routes (essentially two lane highways) that have a lower traffic volume and lower truck percentage level of traffic. The traffic index, TI, reflects these three categories: : Low TI < 6 [Less than 33,000 ESAL s] Intermediate 6 < TI < 12 [Between 33,000 and 1.1 million ESAL s] Heavy TI >12 [Greater than 1.1 million ESAL s] 13
14 3.4 How to Bring in the Effect of Existing Pavement Condition? For the treatment life and life extension to be meaningful, they must recognize the actual pavement condition at the time of the application of the treatment. Currently there is no easy way to derive information on treatment performance from existing PMS data in California. Also, a Pavement Condition Index (PCI) type system is used by many cities and counties in California (similar to ASTM 6433). By itself the PCI may not be descriptive enough to be of significant help in this area. This is because the more subtle information on individual distress(s) is lost in the calculation of a single number to describe pavement conditions. Since pavement preservation is a non-structural treatment, this means these treatments should only be used on pavements with low deflection values and low levels of distress. If high deflections (beyond an allowable limit) are present, rehabilitation of the pavement will be needed. There is also a maximum cracking threshold before a certain treatment is applied. For pavement preservation, it is suggested that values such as a maximum of 5% cracking and a minimum Pavement Condition Index (PCI) of 70 be considered triggers for pavement preservation (Zhou and Barrantees, 2008). If the pavement is in poor condition, it can have structural problems. Therefore, pavement preservation should not be used as an option in these situations. In the tables "poor condition" is identified along with the associated maintenance treatment option. This is done to develop treatment lives and life extensions that will demonstrate that such maintenance treatments are not cost effective in the late cycle of pavement life. When determining extended life benefits, it may be found that using pavement preservation treatments on pavements in poor condition is not cost effective. In summary, a primary concern for preservation treatments is structural or reflective cracking when the pavement is in good to medium condition and typically structural cracking alone when the pavement is in poor condition. It could be either reflective or structural cracking in the medium condition. It should be noted that this study focuses mainly on maintenance treatments to seal out moisture from cracks and as such raveling or bleeding are not directly addressed in this report. Pavement preservation should preserve the structural integrity of the pavement so that it can perform for a longer time where structural integrity implies load carrying capacity of the pavement. For example, crack sealing may provide the benefits of minimizing water intrusion into the base and subgrade and prevent fines from accumulating in the PCC joints that cause spalling. However, when taking a more in-depth look at what affects a treatment life it was considered that cracking extent by itself may be the most significant aspect. This may be so because the extent of cracking may indicate the capacity of the existing pavement to be more or less impervious to water and the affect on the underlying layers. Also, the extent of cracking is an indication of the possible relative movement between the tips of the crack that have a strong effect on the life of the treatment. 14
15 Although the treatments considered in this report do not add structural capacity to the pavement, their ability to reduce the amount of water that penetrates into the pavement, in turn helps maintain the structural support capability of the lower layers. This is more completely discussed later in the report Treatment life is defined as the number of years a given treatment will serve its function (before another treatment is required). Treatment life is a function of the existing pavement condition and other factors such as traffic, climate, quality of materials and construction. Following are tentative definitions for the various categories in pavement condition; Good - minor distress (< 5 % cracking). Expected life of 8-10 years Fair - minor to moderate distress (5-20% cracking). Expected life of 4-6 years Poor condition (>20 % cracking) - moderate to severe distress and with structural problems. Expected life of 1-3 years 3.5 How to Bring in the Intrinsic Maintenance Material Properties Clearly if a good Pavement Management System (PMS) with adequate data were available, the intrinsic properties of each treatment would not be needed because simple multiple variable regressions would directly give the life of each treatment. However, that data does not exist yet for most treatments and therefore it is necessary to use a modeling approach to bridge the gap. As such, the need to use some models in some cases to model or at least to relate and compare estimated lives from similar treatments arises. It was felt that there was a need to present the data in a simple format which contains key aspects which contribute to the intrinsically value of a treatment. Generically, many aspects will or may contribute to the quality and durability of a flexible pavement treatment such as the following; Quantity of binder, liters per square meter, Aging characteristics of the binder used in treatments Elastic characteristics of binder, Strain energy at break of the binder, Types of additives (none, polymer, rubber, others), Mix stiffness (if applicable) Effect of Amount of Binder on treatment life A preliminary study allowed the determination of the effective binder content available for each treatment (Table 2). Some of the numbers were obtained from the MTAG (Maintenance 2003), others were based on authors experience, which were submitted to the Pavement Preservation Task Group (PPTG) for review. This table considers the average amount of 15
16 asphalt binder used in each treatment. The key factor for emulsion-based treatments is the residual binder content. The use (or not) of tack coats were considered since they may add additional binder content available to each treatment. Another important aspect is also thickness of the treatment as an indication of the degree of protection provided by a given treatment to the underlying layers. Table 2 - Maintenance Treatment Thickness and Asphalt Content (Gallons per Square Yard or Percent Asphalt in the Mix) Maintenance Treatment Thickness of Seal Layer, inch Overall thickness including chips and mix, inch Asphalt/Oil Gal./sq. yd. On surface Overall Asphalt/Oil Gal./sq. yd. On surface includes tack HMA Crack sealing HMA Crack filling Fog seals Rejuvenator seals Scrub seals Slurry seals REAS slurry seal Micro-Surfacing PME chip seals PMA chip seals AR chip seals Cape seals AR (slurry) ½ inch Cape seals AR (micro) ¾ inch Conventional HMA, 1 inch OGAC, 1 inch PBA HMA, 1 inch RAC-G, 1 inch RAC-O, 1 inch RAC-O (HB), 1 inch BWC-Open, ¾ inch BWC-Gap, ¾ inch BWC-RAC-G, ¾ inch BWC-RAC-O, ¾ inch Mix Percent Asphalt by weight of aggregate Type of Binder Several types of binder are available for use in various pavement preservation treatments. The quality of binder has been defined many different ways, such as resistance to aging, elastic recovery, moduli, viscosity, softening point, etc. Clearly aging resistance is important, but specifications today are such that all binders show similar values by aging in the Rolling Thin Film Oven (RTFO) and Pressure Aging Vessel (PAV). One key aspect contributing to the 16
17 longevity of a surface treatment, beyond binder quantity, is its capability to take strain without breaking. Limited data is available for many binders regarding the strain energy at the break point and as such the conclusions and numbers included in this section should be revised when more data is collected. However, Kaloush and others (Kaloush 2002, Kaloush 2003, Zborowski 2006) has reported data comparing the strain energy at the breaking point, for asphalt rubber (AR) binder and conventional binders. Also relating this information to the fact that AR is known to take 5 times the strain (Green et.al. 1977) compared with conventional binders before breaking, and the results of many four point flexural fatigue test where usually the ratio between fatigue live at the same strain level is 1 to 10 between conventional and AR binder mixes and 1 to 3 for polymer modified mixes in this study (Sousa 2000, 2003, 2006), the following ratios were adopted and shown in Table 3 (again subjected to further analysis). Table 3 - Ratios of Strain Energy at Break Binder type RATIO OF STRAIN ENERGY AT BREAK OF MIXES (OR BINDER) Conventional 1 Polymer/Other Modified Binder 1.5 Asphalt Rubber 5 17
18 4. TREATMENT PERFORMANCE CAPACITY To develop an easy method to understand how long a treatment lasts, the concept of a Treatment Performance Capacity (TPC) was developed, and is defined as follows: TREATMENT PERFORMANCE CAPACITY= (BINDER CONTENT PER UNIT AREA (L/m 2 or Gal/SY) * (STRAIN ENERGY AT FRAILURE RATIO) * THICKNESS OF TREATMENT-(mm or inch) For example obviously a fog seal with a regular emulsion will have a much smaller number in terms of TPC than a chip seal simply because it will have less binder. Also an asphalt rubber treatment will show a better Capacity number (even with the same binder content) because it will have a larger STRAIN ENERGY AT FAILURE value than a regular binder. Based upon these assumptions Table 4 shows estimates of the TPC for each of the flexible maintenance treatments. Clearly having a binder that ages less is better, but this factor may be compounded or confounded with more binder which also promotes less aging. A treatment with a high capacity, when placed under heavy traffic and over a badly cracked pavement, will have its capacity drained quite fast compared when it is placed over a low traffic non-cracked pavement A treatment with a low capacity will last less time under the same scenario. TPC is inherent to each treatment and how long it takes to consume that capacity depends on the conditions under which the treatment is applied. 18
19 Table 4 - Treatment Performance Capacity Maintenance Treatment Treatment Performance Capacity (TPC) HMA Crack sealing 6.25 HMA Crack filling 0.81 Fog seals 0.08 Rejuvenator seals 0.08 Scrub seals 6.41 Slurry seals 7.05 REAS slurry seal Micro-Surfacing 8.08 PME chip seals PMA chip seals AR chip seals Cape seals AR (slurry) ½ inch Cape seals AR (micro) ¾ inch Conventional HMA, 1 inch OGAC, 1 inch PBA HMA, 1 inch RAC-G, 1 inch RAC-O, 1 inch RAC-O (HB), 1 inch BWC-Open, ¾ inch BWC-Gap, ¾ inch BWC-RAC-G, ¾ inch BWC-RAC-O, ¾ inch
20 5. EFFECTS OF WATERPROOFING ON TREATMENT LIFE Water within the pavement layers can be a principal cause of pavement deterioration (Cedergren 1994). Specific problems associated with water include: stripping of asphalt pavement; joint displacement in concrete pavements; reduction in pavement strength due to positive pore water pressures in the base course layers; shrinking and swelling of sub-grade materials due to water content changes; and frost heave and thaw weakening due to upward (capillary) flow beneath pavements. Water-related problems are thus responsible for decreased pavement life, increased costs for maintenance, and increased pavement roughness, and occur throughout all regions and climates of the US. A recent National Cooperative Highway Research Program study estimated that excess water reduces the life expectancy of pavement systems by more than half (Christopher and McGuffey,1997). One of the major contributors to deterioration and premature failure of flexible pavements is the presence of excessive moisture within the pavement structure. Water from many sources enters a pavement structure. The largest source of free water in pavement is from surface infiltration (Cedergren, 1974). Excessive moisture that remains under the paved surface can substantially decrease the service life of a pavement structure. Early full-scale pavement tests in the United States, including the Maryland Road Test (Highway Research Board, 1952), the WASHO Road Test (Highway Research Board, 1955), and the AASHO Road Test (Highway Research Board, 1962), indicated that rates of pavement damage attributable to traffic were significantly higher when the pavement structure was saturated. Cedergren (1974) predicted a 50% reduction in pavement service life if a pavement base was saturated as little as 10% of the time. A treatment can also be evaluated based on its water proofing capabilities. Waterproofing is an important characteristic of a treatment form a view point of preserving the investment in the pavement structure. Some treatments afford minimal waterproofing and would also be ranked as a relatively short life. Not all treatments are equal in their structural and functional roles. A fog seal serves the purpose of holding the existing aggregate in place and thus delaying raveling for a short time. It is not considered to be a waterproofing layer in the same sense as a seal coat; however its contribution for evaluating extended structural pavement life can be understood through its water proofing capability. Likewise, crack seals, slurry seals, microsurfacings, chip seals and any other treatment that is not placed with a screed (laydown) does not improve the ride which is the most important functional attribute that a pavement can have and is by far the one that drivers first respond to but they can have significant contributions to waterproofing a pavement. Finally, safety is very important that is why any treatment that reduces skid resistance below an agency acceptable level should be avoided. 20
21 All these things are important in judging which treatment to use and when to use it. In addition, it doesn't rain often in the desert areas so deflections remain very flat over time and aging becomes more of the predominate damage factor. So in low aging areas such as high rainfall, coastal areas waterproofing is important, while in desert areas aging is important, and in mountainous areas, snow and ice (water in another form) is important. However, given the constraints in this project, there was a need to concentrate on waterproofing capabilities of the treatments. Based on the engineering judgment of the authors, Table 5 was developed showing how effective a treatment is at waterproofing a pavement function of the pavement condition. Table 5 - Waterproofing Index for various treatments Maintenance Treatment Waterproofing Waterproofing Waterproofing Pavement Pavement Pavement Condition Condition Condition HMA Crack sealing HMA Crack filling Fog seals Rejuvenator seals Scrub seals Slurry seals REAS slurry seal Micro-Surfacing PME chip seals PMA chip seals AR chip seals Cape seals AR (slurry) ½ inch Cape seals AR (micro) ¾ inch Conventional HMA, 1 inch OGAC, 1 inch PBA HMA, 1 inch RAC-G, 1 inch RAC-O, 1 inch RAC-O (HB), 1 inch BWC-Open, ¾ inch BWC-Gap, ¾ inch BWC-RAC-G, ¾ inch BWC-RAC-O, ¾ inch
22 6. TREATMENT LIVES VERSUS TREATMENT PERFORMANCE CAPACITY (TPC) Appendix A presents the estimated Treatment Lives as explained in Section 2. Based on the Treatment Lives for each of the Coastal and Valley good pavements shown in Appendix A, a correlation was made with the TPC as presented in Table 4 and the results are shown in Figure 5, where the TPC computed for each treatment is related to the perceived and expected life of each treatment. The TPC values used in Figure 6 are obtained from Table 4 and the Estimated Life of Treatment are obtained from Appendix A for Coastal and Valley fair pavements. 14 TPC Age for Good Pavements (Coastal and Valley) TPI <> AGE for GOOD PAVEMENTS (COSTAL AND VALLEY) ESTIMATED LIFE OF TREATMENT (YEARS) R 2 = R 2 = R 2 = Log. (TI < 6 ) Log. ( TI > 12 ) Log. ( 6 < TI <12 ) TREATMENT PERFORMANCE INDEX Treatment Performance Capacity Figure 5 - Relation between TREATMENT PERFORMANCE CAPACITY and ESTIMATED LIFE OF TREATMENT when applied over GOOD pavements in Coastal and Valley areas It can be observed that the R 2 correlation varies between 0.70 and 0.80 indicating that most of the performance (life) of a treatment can be explained by the amount of binder it contains, the properties of the binder and the thickness of the treatment. This indicates that treatments with higher TPC are expected to last longer. It also indicates that the TPC as defined in this report appears to have a very good correlation with the expected life of a treatment and eventually could be used to directly rank the quality of a treatment. This relationship is even better for Fair Pavements as it can be observed in Figure 6 22
23 ESTIMATED LIFE OF TREATMENT (YEARS) TPI <> AGE for FAIR PAVEMENTS (COSTAL AND VALLEY) TPC Age for Fair Pavements (Coastal and Valley) R 2 = R 2 = R 2 = Log. ( TI > 12 ) Log. (TI < 6 ) Log. ( 6 < TI <12 ) TREATMENT PERFORMANCE INDEX Treatment Performance Capacity Figure 6 - Relation between TREATMENT PERFORMANCE CAPACITY and ESTIMATED LIFE OF TREATMENT when applied over FAIR pavements is Coastal and Valley areas 23
24 7. CONCEPTS ON PAVEMENT LIFE EXTENTION 7.1 Introductory concepts Not all treatments will provide the same level of waterproofing. Also not all treatments will have the same resistance to reflective cracking. The combined effect of reducing the amount of water that penetrates the pavement and its resistance to crack propagation will be directly related to the ability of a treatment to extend the life of a pavement. This section addresses the benefits of a treatment to reduce water penetration in the pavement to maintain the moduli of the layers and therefore prevent the strains in the asphalt layers from increasing. It is the low strains in the asphalt layers that will result in an increase in the structural life of the pavement (over the DO NOTHING option). One of the most effective tools to evaluate the moduli of pavement layers is the FWD deflection data and corresponding back calculation analysis. Furthermore mechanisticempirical analyses are very valuable in investigating the strain levels and corresponding pavement lives. Unfortunately there is no direct measurement of permeability of treatments over their lives. As a surrogate for this information data from the Arizona Department of Transportation (ADOT) (where FWD measurements are done annually and the level of cracking is also recorded) proved invaluable. As such, it was assumed that the evolution of FWD s back-calculated moduli of the base, subbase and subgrade layers are directly associated with water penetrating into the pavement. As cracking increases, it was assumed that more water penetrates into the pavement causing the underlying layers to result in lower moduli. 7.2 Evaluation of the Reduction of Pavement Strength with Cracking Level To investigate the reduction of pavement strength with cracking level, more then 30,000 Falling Weight Deflectometer (FWD) deflections from the ADOT) were reviewed and compiled (Way 2007). From this data the average FWD deflections for various levels of cracking were obtained. The FWD data were placed into three categories of cracking, Good (0% cracking), Fair (5% average cracking) and Poor (average 18% cracking level) for asphalt concrete pavement thicknesses varying from 1 inch thick to about 16 inches. An example of the correlation of that data is presented in Figure 7 for FWD sensor number 1. Similar data can be seen Appendix B for all other sensors. 24
25 Good Condition (0% cracking) Fair Condition (5% cracking) Poor Condition (18% cracking) DEFLECTIONS (MILS) AC LAYER THICKNESS (in.) Figure 7- FWD sensor number 1 deflection versus AC Pavement Layer Thickness It should be noted that for Good, Fair and Poor pavements the relationship between pavement thickness and ESAL s remained almost identical as it can be seen in Figure 8, which demonstrates that the set of data is equally balanced for GOOD, FAIR and POOR pavements. 25
26 ESALS (1000) Good Condition (0% cracking) Fair Condition (5% cracking) Poor Condition (20% cracking) AC LAYER THICKNESS (in.) Figure 8- AC Pavement Layer Thickness versus ESAL s of traffic loading This data was used together with the FWD modulus backcalculation program MODCOMP5 (Irwin 1999) to estimate the moduli of the AC layers, base layers and subgrade layers, Appendix C. The relation between AC layer thickness and base thickness was also determined from the average of all pavements and is shown in Figure 9. 26
27 BASE THICKNESS (in.) (1000) y = x AC LAYER THICKNESS (in.) Figure 9- AC Pavement Layer Thickness versus aggregate Base Layer Thickness The back calculated moduli for several pavements under those three conditions were determined with a low root mean square (RMS) errors (mostly less then 2% the maximum error was less than 4%). The relationships between the reduction of layer moduli function (using the moduli of the pavement in GOOD condition, 0% cracks, as a reference) of cracking level for each of the layers at several layer thickness is presented in Figures 10 through
28 1.1 Reduction of AC layer Moduli AC = 3 in. AC=4 in. AC = 6 in. AC = 8 in. AC =10 in Percent Cracking Figure 10 Reduction of AC Layer Moduli versus percent cracking 28
29 1.05 Reduction of Subgrade Moduli AC = 3 in. AC=4 in. AC = 6 in. AC =10 in Percent Cracking Figure 11- Reduction of Subgrade Layer Moduli versus percent cracking 29
30 1.1 Reduction of Base Moduli AC=4 in. AC = 6 in. AC = 8 in. AC =10 in Percent Cracking Figure 12 - Reduction of Base Layer Moduli versus percent cracking For the purpose of this investigation, it was assumed that the reduction in subgrade moduli and base moduli present in the 5% cracked and 18% cracked pavement was basically caused by moisture/water. Clearly, this is a bold assumption because one other aspect can be responsible for the decrease in subgrade and base moduli (namely the higher strains representing the POOR and FAIR pavement) because the AC layer modulus has decreased due to the presence of cracking. However, given the strong effect that water can have in the pavements, this was considered a valid assumption at this time in the research effort. Also the reduction of moduli is not very significant in well compacted materials if the strain levels are low enough. Using elastic layer theory (the BISAR program was used to compute stresses and strains) and taking advantage of the well established SHELL equations to relate strains in the bottom of asphalt layer and top of subgrade layer to pavement life, the lives for several pavements with 3, 4, 6, 8 and 10 in. thickness and at the 3 levels of cracking level was computed (Appendix D). The equations used were: 1. Maximum admissible tensile strain on the base of traditional asphalt concrete layers (Shell 1985): 30
31 ε = (0.856Vb ) Em N...[2] where: ε tensile strain V b volumetric bitumen percentage E m bituminous mixture deformation modulus N 86 KN standard axle number 2. Foundation soil top maximum compressive strain (Shell 1985): 0.25 ε = K s N...[3] where: ε compressive strain K s parameter depending on survival probability adopted in the criteria for pavement design ( % survival probability; % survival probability; % survival probability) N 86 KN standard axle number It was further assumed based on ADOT experience that a GOOD pavement with 0% cracking has an average life of 12 years. Caltrans often places treatments on pavement with up to 25% cracking or more indicating the life of their treatments will be much less. A summary of the results are presented in Table 6. 31
32 Table 6 - Increase in Treatment Structural Life due to Treatment in Years (see note) Condition and percentage of waterproofing treatment (Fair/100% waterproofing) AC Thk (in) AB Thk (in) Annual Traffic ESALs (000) Remaining Life (Do Nothing (years) Increase in pavement life due to treatment (years) Total life after treatment (years) assuming treatment this long Good (0% Crack) Fair (5% Crack) Poor (18% Crack) Fair w/100% waterproofing Poor w/100% waterproofing Poor w/50% waterproofing Fair w/50% waterproofing Good (0% Crack) Fair (5% Crack) Poor (18% Crack) Fair w/100% waterproofing Poor w/100% waterproofing Poor w/50% waterproofing Fair w/50% waterproofing Good (0% Crack) Fair (5% Crack) Poor (18% Crack) Fair w/100% waterproofing Poor w/100% waterproofing Poor w/50% waterproofing Fair w/50% waterproofing Good (0% Crack) Fair (5% Crack) Poor (18% Crack) Fair w/100% waterproofing Poor w/100% waterproofing Poor w/50% waterproofing Fair w/50% waterproofing Good (0% Crack) Fair (5% Crack) Poor (18% Crack) Fair w/100% waterproofing Poor w/100% waterproofing Poor w/50% waterproofing Fair w/50% waterproofing Note: For details of Table 6 input values see Appendix E 32
33 The Remaining Life (Do Nothing) is computed assuming that a pavement in good condition will last 12 years. Based on this assumption, the annual traffic is computed (assuming no annual growth). Using annual traffic computed from above, the number of years that remain for each condition (5% and 18% cracking) is determined. The number of years determined from the Do Nothing scenarios is the benchmark for the rest of the analysis. As such the extra fatigue life determined from the Bisar and Shell analysis for the 100% and 50% levels of water proofing are computed to determine how many years the pavement will last after the treatment is done (assuming that the waterproofing will last at least as long as needed). The numbers in the tables were computed for each pavement thickness. The somewhat similarity of duration for each case is due to the fact that it is assumed that the pavement thickness is such that it can take the traffic and fail in 12 years. The steps taken in the analysis are summarized below. The approach to investigate the increased structural pavement life was as follows;: 1) For a pavement in GOOD condition the life expectancy given by SHELL equation was determined say N (Good). Then the annual number of ESALS carried was determined by N (yearly) = N (Good) /12 years. 2) The life given by the Shell equations for N (Fair) and N (Poor) was also determined in a similar manner. 3) The corresponding remaining lives, in terms of years, of the pavements under those Fair and Good conditions were then determined (using the annual traffic obtained for the GOOD condition) 4) It was then assumed that a 100% water proof treatment that was made would dry the subgrade and base and the lives were determined using the stiffness of AC layers obtained for the FAIR and POOR conditions but using the moduli of the subgrade and base obtained for the GOOD conditions (which were assumed to be dry ). This is an attempt to simulate pavement conditions if a treatment was made. Then the N dry) and the N dry) was determined. 5) It was also assumed that if a treatment provided 50% water proofing that the moduli of the base and subbase layers would be halfway between that of the 5% and 0% cracking condition and between 18% and 0% of cracking condition. The respective lives were determine 6) The increase in life due to the treatment was computed subtracting N (Fair@100%dry)- N (Fair), (as an example for Fair condition with assumed 100% waterproofing treatment). The same for other conditions and cracking levels. Another very important assumption in this case is that the treatment would remain at the same level of waterproofing for the remaining extended life of the pavement. Clearly if a treatment is 100% waterproof, but only lasts a reduce time (say, 1 year), only during that time can contribute to the life extension. As such, its contribution for the total increase in pavement life is a proportional to the treatment life over the total possible 33
34 life extension with a treatment with 100% waterproofing capability. This concept can be better visualized as follows: Based on these assumptions, it was possible to estimate the Increase in Number of Years a treatment will provide function of waterproofing capability of the treatment and the level of cracking at the time of the treatment as shown in Figure
35 6 Increase pavement life funtion of time of treatment intervention assuming remaining life of GOOD pavement was 12 years and that treatment is either 100% or 50% effective at water proofing during the remaining life of the pavement Increased Estructural Pavement Life (as compared to DO Nothing option) - YEARS Linear (100% Waterproofing) Linear (50% Waterproofing) y = x y = x Pavement Cracking % at time of Treatment Figure 13 Increased Structural Pavement Life versus percent cracking at time of treatment With these analyses and values, an EXCEL model was developed to interpolate and extrapolate between the values used where; Life extension = f (% cracking, % waterproofing, life of treatment) In these analyses, it is assumed that pavement life extension relates to its structural capability as given by the remaining life in the structural layers such as AC layers (or concrete layers). To clear the mind of the reader of some possible preconceived ideas, it is important to clarify a few concepts: a) The average life of pavements in GOOD condition was considered 12 years as such and in consequence (base on the FWD back calculated analyses) the average life of FAIR pavements (with 5% cracking) turned out to be about 6 years and the average structural life of POOR pavements (with 18% cracking) turned out to be 1.2 years. These are the given conditions as a basis for this work. 35
36 b) A good quality chip seal that may have a life of 6-12 years over a POOR pavement that has a remaining life of 1.2 year in this analysis will not actually show that the life extension of the structural pavement was 6 years but only 2 years (actually the very best this structural analyses show, under these assumptions, for a POOR pavement with 20% cracking is 2 years if the treatment is 100% waterproof see Figure 14). c) Also in some cases, experience has shown that AR-chip seals and perhaps other treatments have lasted for many years and in some cases as much as 20 years or more, but in this analysis cannot reflect that extraordinary performance for several reasons. One reason is that it is assumed that every year the traffic is actually equal to the maximum possible traffic every year as defined for each pavement structure analyzed (i.e. 1/12 of the traffic obtained when the pavement was in GOOD condition). If the actual traffic over the pavement is less then 1/12 of the traffic that would fail the section in 12 years then it is possible to have a perceived pavement life extension to be much more that that determined by this analysis. Another reason is that in a pavement in GOOD condition it is possible that already some weakening of the base, subbase and foundation takes place due to some water penetration. If the treatment actually seals the pavement from water penetration it is also possible that the pavement could develop more strength then that considered based on the average for the GOOD pavement condition.. d) Also an important limitation of this analysis is that NO credit was given for any reflective cracking resistance capability of any treatments. Clearly the structural life of a pavement may have ended but some treatments may hide that reality for longer times. This can be perceived as limitation of this study when the perception of a life structural pavement increase in the mind of the reader is related to actual pavement condition observed at the surface. An as example such as an AR OGFC or other treatment may retard a few years the appearance of the cracks in the structural section. Thus the INCREASE in structural life PERCEIVED by the practitioner may be the sum of the actual increase in structural life due to waterproofing (more or less the pavement foundation) PLUS how long it takes the cracks to come threw the treatment. With these limitations and considerations in mind, the increase of structural pavement life was computed. Using the lives for each treatment and each region and traffic level given in Appendix A, the waterproof capabilities estimated in Table 5 were used along with the data in Figure 13, to estimate structural life extension of a pavement which is given in Tables 7-9. These lives are what is gained (or EXTENDED) over the DO Nothing alternative. 36
37 Table 7 - Life Extension for Maintenance Treatments in Coastal and Valley Regions Pavement Life Extension for Coastal Region (PG 64-10) and Valley Region (PG 64-16) Maintenance Treatment Traffic Index (TI) TI < 6 6 < TI < 12 TI > 12 Good Fair Poor Good Fair Poor Good Fair Poor (0%) (5%) (18%) (0%) (5%) (18%) (0%) (5%) (18%) HMA Crack sealing N N N HMA Crack filling N N N Fog seals 0.1 N N 0.0 N N 0.0 N N Rejuvenator seals 0.3 N N 0.2 N N 0.2 N N Scrub seals N N N Slurry seals N N N REAS slurry seal N N N Micro-Surfacing N N N PME chip seals N N N PMA chip seals N N N AR chip seals Cape seals AR (slurry) ½ inch Cape seals AR (micro) ¾ inch Conventional HMA, 1 inch N N N OGAC, 1 inch N N N PBA HMA, 1 inch N N N RAC-G, 1 inch N N N RAC-O, 1 inch RAC-O (HB), 1 inch BWC-Open, ¾ inch N N N BWC-Gap, ¾ inch N N N BWC-RAC-G, ¾ inch N N N BWC-RAC-O, ¾ inch N N N 37
38 Table 8 - Life Extension for Maintenance Treatments in Mountain Regions Pavement Life Extension for Mountain Region (PG 64-28) Maintenance Treatment Traffic Index (TI) TI < 6 6 <TI < 12 TI > 12 Good Fair Poor Good Fair Poor Good Fair Poor (0%) (5%) (18%) (0%) (5%) (18%) (0%) (5%) (18%) HMA Crack sealing N N N HMA Crack filling N N 0.4 N N Fog seals 0.2 N N 0.1 N N 0.1 N N Rejuvenator seals N 0.2 N N 0.2 N N Scrub seals N N 1.5 N N Slurry seals N N N REAS slurry seal N N N Micro-Surfacing N N N PME chip seals N N N PMA chip seals N N N AR chip seals Cape seals AR (slurry) ½ inch Cape seals AR (micro) ¾ inch Conventional HMA, 1 inch N N N OGAC, 1 inch N N N PBA HMA, 1 inch N N N RAC-G, 1 inch N RAC-O, 1 inch RAC-O (HB), 1 inch N BWC-Open, ¾ inch N N N BWC-Gap, ¾ inch N N N BWC-RAC-G, ¾ inch N N N BWC-RAC-O, ¾ inch N N N 38
39 Table 9 - Life Extension for Maintenance Treatments in Desert Regions Pavement Life Extension for Desert Region (PG 70-10) Maintenance Treatment Traffic Index (TI) TI < 6 6 <TI < 12 TI > 12 Good Fair Poor Good Fair Poor Good Fair Poor (0%) (5%) (18%) (0%) (5%) (18%) (0%) (5%) (18%) HMA Crack sealing N N N HMA Crack filling N N N Fog seals 0.1 N N 0.1 N N 0.1 N N Rejuvenator seals 0.2 N N 0.1 N N 0.1 N N Scrub seals N N N Slurry seals N N N REAS slurry seal N N N Micro-Surfacing N N N PME chip seals N N N PMA chip seals N N N AR chip seals Cape seals AR (slurry) ½ inch Cape seals AR (micro) ¾ inch Conventional HMA, 1 inch N N N OGAC, 1 inch N N N PBA HMA, 1 inch N N N RAC-G, 1 inch RAC-O, 1 inch RAC-O (HB), 1 inch BWC-Open, ¾ inch N N N BWC-Gap, ¾ inch N N N BWC-RAC-G, ¾ inch N N N BWC-RAC-O, ¾ inch N N N The following is an example to help understand the concepts behind the values presented for the Pavement Life Extension attributed for each treatment. Figure 14 depicts three possible situations relating Treatment Life with Structural Life Extension when a100% waterproof treatment is placed on a FAIR pavement: 1 - In one case the treatment is indeed 100% waterproof and lasts TLa years; therefore the life extension will be LEa years. 2 - In another case the treatment may only last TLb years, although it is 100% waterproof, however the structural life extension will only be LEb years. 3 In a third case a 100% waterproof treatment may last so long, such as TLc years that its structural benefits will not be more then LEa = LEc years. 39
40 This analysis suggests that some treatments may be excessive for some pavement conditions while at other times some treatments may be insufficient. Using this approach, one could consider the possibility that for any given pavement condition there would be an optimum timing for a type of treatment. Remaining Structural Life (ESALS) 1.4E E E E E E E+07 GOOD FAIR FAIR + 100% Waterproof treatment TL b TL a TL c 0.0E Time (years) LE b LE a LE c Figure 714 -Remaining Structural Life (ESALs) versus Time in Years for Fair Condition The relative global and average structural benefit of placing a treatment decreases rapidly with cracking level as it can be observed in Figure 15. These ratios were obtained with the average life for all treatments in the Valley/Coastal region. 40
41 0.3 AVERAGE RATIO of PAVEMENT LIFE EXTENSION / TREATMENT LIFE TI <6 6 < TI < 12 TI > % Cracking at Time of Treatment Figure 815 Ratio of Life extension / Treatment Life function of Percent (%) Cracking at Time of Treatment for Valley/Coastal Region 7.3 Considerations for rigid pavements The approach and models used in the flexible pavement design could be extended to some of the concrete treatments. However, consideration should be made to the following particular aspects of each of the following treatments in concrete pavements: A) For PCC Joint re-sealing and PCC Crack sealing, the approach can be similar to that used for flexible pavements as the main function of these repairs is preventing water to penetrate into the pavement. However, the equations for predicting rigid pavement performance should be used and be a function of moduli of the sub-layers. It is likely that this analysis will also demonstrate that the treatments should be done as soon as possible and they will have similar life extensions as presented for flexible pavements B) Diamond Grinding. The main advantage (from a structural view point) of this treatment is reducing the dynamic loads in the slabs. Clearly should be done as soon as possible... life extension will be greatly increased given that dynamic loads are about 2 times static loads. Taking into consideration the 4 th power law only life increase can be expected to be about 8 to 16 times. Clearly, this assumes Diamond Grinding is done because of step faulting and not to reduce noise. Also consideration should be done if during step faulting any treatments is to be done to the voids that do exist below the slabs. There are many 41
42 assumptions that have to be made or clarified if proper life extension credit is to be given to this treatment. C) Partial depth Spall Repair, Full depth spall repair. In these cases, there are combinations of waterproofing and water penetration reduction efforts. Clearly they should be done as soon as possible. In terms of life extension, they can last the remainder of the life for the rest of the pavement (if the cause of the problem was material defective construction) or depends on the differential characteristics of the foundation below them. It is not easy to make assumptions for life extension. D) Dowel Bar Retrofit, The structural analysis here is also key to demonstrate that with the dowels the edge deflections are minimized and pavement life increases. For heavy traffic loads should be done as soon as possible. For other levels of traffic may not be needed function of location and subgrade characteristics. Predicting life extension requires other types of analysis not addressed in this report. E) Random slab replacement. It presumably is executed when a slab is broken in several pieces. The life of the new slab should be presumably the design life of the pavement, if at the same time improvements are made in the foundation. Otherwise it will probably last only as long as the slab it is replacing lasted. The authors have seen, in China, cases of concrete pavement (well designed according to our standards) where slabs break in 2 years due to heavy overloaded trucks. Once they are replaced they break again after two years. These points out the fact that it is important to understand the mechanism and causes that allow a slab to break. Most of the failures are due to subgrade deficiencies (or/ in consequence due to insufficient slab thickness). 42
43 8. CONCLUSIONS AND RECOMMENDATIONS 8.1 Conclusions This analysis presented in this report is based on the following: The collective experience of the Pavement Preservation task Group (PPTG) expectation of duration of life treatments, The Authors perception of waterproofing capabilities of each treatment The ADOT FWD data function of the percent cracking on pavements with the assumption that the reduction of subgrade moduli and base at different cracking levels were due to water damage of these materials (an that this behavior is reversible if no water is present) The layer elastic analyses controlling the strain on the bottom asphalt layer, clearly demonstrates that huge structural benefits can be derived if: Treatments are done during the initial cracking levels, Treatments are such that remain as long lasting as possible and as waterproofing as possible. However, Life Extensions presented in this report may not match expected Life Extensions based on experience because no credit is given to any of the treatments for resistance to reflective cracking. The controlling distress considered remains on the bottom of the asphalt layer. Some treatments may retard crack propagation to the surface. It is also clear that the better treatments are those that have higher Treatment Performance Capacity, which simply indicates, what is intuitively known by all pavement engineers, that treatments perform better if they have more binder, are made with better binder and are thicker (i.e. more long lasting and more waterproofing). 8.2 Recommendations It is recommended that based on this study a model be developed to relate treatment life function of Treatment Performance Capacity, pavement condition, traffic level and location (function of PG grade). It is further recommended that an investigation be made and quantified, from CALTRANS data, if available, the effect of water penetrating in the pavements in the four different climatic regions in California. It is also recommended that the structural life extension be further revised to take into consideration aging of material components and the reflective cracking of pavement layers 43
44 through the treatments so that the values obtained for life structural life extension may be more in line with perceived expectation from pavement engineers that decide on reconstruction based on actual visible pavement conditions. Finally, a cost benefit analyses quantification of the optimum time to apply a treatment should be investigated. 44
45 9. REFERENCES ASTM 6433, Standard Practice for Roads and Parking Lots Pavement Condition Index Surveys, ASTM 2007 Annual Book of ASTM Standards, Volume 04.03, Cedergren, H.R., Arman, J.A., and O Brien, K.H. (1973). Development of Guidelines for the Design of Subsurface drainage Systems for Highway Pavement Structural Sections. FHWA-RD Federal Highway Administration, Washington, DC. Cedergren, H.R. (1974). Drainage of Highway and Airfield Pavements. John Wiley & Sons, Inc., New York. Cedergren, H.R. (1994). America s Pavements: World s Longest Bathtubs, Civil Engineering, American Society of Civil Engineering, September, pp Christopher, B.R. and V.C. McGuffey (1997). NCHRP Synthesis of Highway Practice 239: Pavement Subsurface Drainage Systems. TRB, National Research Council, Washington, Green, E. L. and William J. Tolonen, The Chemical and Physical Properties of Asphalt- Rubber Mixtures, Arizona Department of Transportation, ADOT-RS-14(162), July, Hicks, R. G. and Rob Marsh, Pavement Preservation Sub-Group on Strategy Selection & Evaluation, Power Point Presentation, April 25, Hveem, F. N., Lovering, W.R., and G.B. Sherman, The Design of Seal Coats and Surface Treatments, State of California Department of Public Works Division or Highways, Materials and Research Department, Hveem, F.N. (1950)). WATER IN HIGHWAY SUBGRADES AND FOUNDATIONS, State of California Department of Public Works Division or Highways, Materials and Research Department, Prepared for National Research Council American Geophysical Union, South Pacific Meeting, Sections of Hydrology and Meteorology, University of California, Davis, California, February 3 and 4, Kaloush, K., Witczak, M., Way, G., Zborowski, A., Abojaradeh, M., and Sotil, A., Performance Evaluation of Arizona Asphalt Rubber Mixtures Using Advanced Dynamic Material Characterization Tests, Final Report Submitted to FNF Construction and the Arizona Department of Transportation, July
46 Kaloush, K., Zborowski, A., Sotil, A., Abojaradeh, M., and Way G. Material Characteristics of Asphalt Rubber Mixtures. Proceedings Asphalt Rubber 2003 Conference, ISBN , p , Brasilia, Brazil, December Maintenance, Maintenance Technical Advisory Guide (MTAG), Caltrans, Office of Pavement Preservation, Division of Maintenance, October, Irwin, L. H., MODCOMP5, Cornell University Local Roads Program, October, Shell, 1985 Addendum to 1978 Shell Pavement Design Manual, Shell International Petroleum Company, Limited, London, Sousa, Jorge, Jorge C. Pais and Rachid Saim, The Effect of Mode of Loading on the Comparison Between Asphalt Rubber and Traditional Hot Mixes Laboratory Performance, Proceedings of the Asphalt Rubber 2000 Conference, Pages , Vilamoura, Portugal, November 14-17, 2000, ISBN Sousa, Jorge, Jorge C. Pais and George B. Way, A Mechanistic-Empirical Based Overlay Design Method for Reflective Cracking, Proceedings of the Asphalt Rubber 2003 Conference, Pages , Brasilia, Brazil, December 1-4, 2003, ISBN Sousa, Jorge, George B. Way, Shakir Shatnawi and Catia Dantas, Asphalt Rubber in New Pavement Design and Construction, Proceedings of the Asphalt Rubber 2006 Conference, Pages 67-98, Palm Springs, California, October 25-27, 2006, ISBN Zborowski, Aleksander and Kamil E. Kaloush Predictive Equations to Evaluate Thermal Fracture of Asphalt Rubber Mixtures, Pages , Proceedings of the Asphalt Rubber 2006 Conference, ISBN
47 Appendix A-Summary of Estimated Treatment Lives for Various Regions 47
48 Treatment Lives for Coastal Region (PG 64-16) and Valley Region (PG or 70-10) Average Daily Traffic (ADT) <TI = 6 (undivided) TI 6-12 (non-interstate > TI=> 12 (divided divided or 4-lane) interstate) Treatment HMA Crack sealing Pavement Condition Good Fair Poor Good Fair Poor Good Fair Poor ** ** ** Avg 7 5 ** ** ** st dev ** ** ** HMA Crack filling Avg st dev Fog seals 1-3 N N 1-2 N N 1-2 N N Avg 2 N N 1.5 N N 1.5 N N st dev 0.33 N N 0.17 N N 0.17 N N Rejuvenator seals Avg st dev Scrub seals Avg st dev Slurry Seals Avg st dev REAS slurry *** *** *** seal Avg 9 6 *** *** 8 6 *** st dev *** *** *** Micro Surfacing Avg st dev PME chip seals Avg st dev PMA chip seals Avg st dev AR chip seals Avg st dev Cape seals (slurry) Avg st dev Cape Seals (micro) Avg st dev
49 Treatment Lives for Coastal Region (PG 64-16) and Valley Region (PG or 70-10) Average Daily Traffic (ADT) <TI = 6 (undivided) TI 6-12 (non-interstate > TI=> 12 (divided divided or 4-lane) interstate) Treatment Conventional HMA (30mm) Pavement Condition Good Fair Poor Good Fair Poor Good Fair Poor Avg st dev OGAC ( mm) Avg st dev PBA HMA (30mm) Avg st dev RAC-G ( mm) Avg st dev RAC-O (30 mm) Avg st dev RAC-O (HB) Avg st dev BWC-Open Avg st dev BWC-Gap Avg st dev BWC-RAC-G Avg st dev BWC-RAC-O Avg st dev
50 Treatment Lives for Coastal Region (PG 64-16) and Valley Region (PG or 70-10) Average Daily Traffic (ADT) <TI = 6 (undivided) TI 6-12 (non-interstate > TI=> 12 (divided divided or 4-lane) interstate) Treatment PCC Joint resealing Pavement Condition Good Fair Poor Good Fair Poor Good Fair Poor Avg st dev PCC Crack sealing Avg st dev Diamond Grinding Avg st dev Partial depth Spall Repair Avg st dev Full depth spall repair Avg st dev Dowel Bar Retrofit**** Avg st dev Random slab replacement Avg st dev
51 Treatment Lives for Mountain Region (PG 64-28) Average Daily Traffic (ADT) < TI=6 (undivided) TI 6-12 (non-interstate divided or 4-lane) > TI=12 (divided interstate) Treatment HMA Crack sealing Pavement Condition Good Fair Poor Good Fair Poor Good Fair Poor ** ** ** Avg 5 3 ** ** ** st dev ** ** ** HMA Crack filling Avg st dev Fog seals 1-3 N N 1-2 N N 1-2 N N Avg 2 N N 1.5 N N 1.5 N N st dev 0.33 N N 0.17 N N 0.17 N N Rejuvenator seals Avg st dev Scrub seals Avg st dev Slurry Seals Avg st dev REAS slurry *** *** *** seal Avg 8 5 *** *** 7 5 *** st dev *** *** *** Micro Surfacing Avg st dev PME chip seals Avg st dev PMA chip seals Avg st dev AR chip seals Avg st dev Cape seals (slurry) Avg st dev Cape Seals (micro) Avg st dev
52 Treatment Lives for Mountain Region (PG 64-28) Average Daily Traffic (ADT) < TI=6 (undivided) TI 6-12 (non-interstate divided or 4-lane) > TI=12 (divided interstate) Treatment Conventional HMA (30mm) Pavement Condition Good Fair Poor Good Fair Poor Good Fair Poor Avg st dev OGAC ( mm) Avg st dev PBA HMA (30mm) Avg st dev RAC-G ( mm) Avg st dev RAC-O (30 mm) Avg st dev RAC-O (HB) Avg st dev BWC-Open Avg st dev BWC-Gap Avg st dev BWC-RAC-G Avg st dev BWC-RAC-O Avg st dev
53 Treatment Lives for Mountain Region (PG 64-28) Average Daily Traffic (ADT) < TI=6 (undivided) TI 6-12 (non-interstate divided or 4-lane) > TI=12 (divided interstate) Treatment PCC Joint resealing Pavement Condition Good Fair Poor Good Fair Poor Good Fair Poor Avg st dev PCC Crack sealing Avg st dev Diamond Grinding Avg st dev Partial depth Spall Repair Avg st dev Full depth spall repair Avg st dev Dowel Bar Retrofit**** Avg st dev Random slab replacement Avg st dev
54 Treatment Lives for Desert Region (PG 70-10) Average Daily Traffic (ADT) < 5000 vpd (undivided) 5,000 to 30,000 vpd (noninterstate divided or 4- lane) > 30,000 vpd (divided interstate) Treatment HMA Crack sealing Pavement Condition Good Fair Poor Good Fair Poor Good Fair Poor ** ** ** Avg 8 6 ** ** ** st dev ** ** ** HMA Crack filling Avg st dev Fog seals 1-3 N N 1-2 N N 1-2 N N Avg 2 N N 1.5 N N 1.5 N N st dev 0.33 N N 0.17 N N 0.17 N N Rejuvenator seals Avg st dev Scrub seals Avg st dev Slurry Seals Avg st dev REAS slurry *** *** *** seal Avg 8 5 *** *** 7 5 *** st dev *** *** *** Micro Surfacing Avg st dev PME chip seals Avg st dev PMA chip seals Avg st dev AR chip seals Avg st dev Cape seals (slurry) Avg st dev Cape Seals (micro) Avg st dev
55 Treatment Lives for Desert Region (PG 70-10) Average Daily Traffic (ADT) < 5000 vpd (undivided) 5,000 to 30,000 vpd (noninterstate divided or 4- lane) > 30,000 vpd (divided interstate) Treatment Conventional HMA (30mm) Pavement Condition Good Fair Poor Good Fair Poor Good Fair Poor Avg st dev OGAC ( mm) Avg st dev PBA HMA (30mm) Avg st dev RAC-G ( mm) Avg st dev RAC-O (30 mm) Avg st dev RAC-O (HB) Avg st dev BWC-Open Avg st dev BWC-Gap Avg st dev BWC-RAC-G Avg st dev BWC-RAC-O Avg st dev
56 Treatment Lives for Desert Region (PG 70-10) Average Daily Traffic (ADT) < 5000 vpd (undivided) 5,000 to 30,000 vpd (noninterstate divided or 4- lane) > 30,000 vpd (divided interstate) Treatment PCC Joint resealing Pavement Condition Good Fair Poor Good Fair Poor Good Fair Poor Avg st dev PCC Crack sealing Avg st dev Diamond Grinding Avg st dev Partial depth Spall Repair Avg st dev Full depth spall repair Avg st dev Dowel Bar Retrofit**** Avg st dev Random slab replacement Avg st dev
57 Appendix B-Summary of FWD Deflection Analysis 57


58 58
59 BASE THICKNESS (in.) (1000) y = x AC LAYER THICKNESS (in.) Figure B-1 Relationship between AC Thickness and Base Thickness in ADOT pavements ESALS (1000) Good Condition (0% cracking) Fair Condition (5% cracking) Poor Condition (18% cracking) AC LAYER THICKNESS (in.) Figure B-2 Relationship between AC layer thickness and ESALs for pavement in Good, Fair and Poor Condition. 59
60 40.0 DF1 DEFLECTIONS (MILS) Good Condition (0% cracking) Fair Condition (5% cracking) Poor Condition (18% cracking) AC LAYER THICKNESS (in.) Figure B-3 Relationship between the average deflections measured by the 1 st sensor of the FWD and the AC layer thickness function of pavement condition 60
61 DF2 DEFLECTIONS (MILS) Good Condition (0% cracking) Fair Condition (5% cracking) Poor Condition (18% cracking) AC LAYER THICKNESS (in.) Figure B-4 Relationship between the average deflections measured by the 2nd sensor of the FWD and the AC layer thickness function of pavement condition Good Condition (0% cracking) Fair Condition (5% cracking) Poor Condition (18% cracking) 6.0 DF3 DEFLECTIONS (MILS) AC LAYER THICKNESS (in.) Figure B-5 Relationship between the average deflections measured by the 3rd sensor of the FWD and the AC layer thickness function of pavement condition 61
62 DF4 DEFLECTIONS (MILS) Good Condition (0% cracking) Fair Condition (5% cracking) Poor Condition (18% cracking) AC LAYER THICKNESS (in.) Figure B-6 Relationship between the average deflections measured by the 4th sensor of the FWD and the AC layer thickness function of pavement condition Good Condition (0% cracking) Fair Condition (5% cracking) Poor Condition (18% cracking) DF5 DEFLECTIONS (MILS) AC LAYER THICKNESS (in.) Figure B-7 Relationship between the average deflections measured by the 5th sensor of the FWD and the AC layer thickness function of pavement condition 62
63 DF6 DEFLECTIONS (MILS) Good Condition (0% cracking) Fair Condition (5% cracking) Poor Condition (18% cracking) AC LAYER THICKNESS (in.) Figure B-8 Relationship between the average deflections measured by the 6th sensor of the FWD and the AC layer thickness function of pavement condition Good Condition (0% cracking) Fair Condition (5% cracking) Poor Condition (18% cracking) DF7 DEFLECTIONS (MILS) AC LAYER THICKNESS (in.) Figure B-9 Relationship between the average deflections measured by the 7th sensor of the FWD and the AC layer thickness function of pavement condition Appendix C-MODCOMP5 Pavement Modulus Back-Calculation Program Results 63
64 MODCOMP5 Pavement Modulus Back-Calculation Program Version 5.0 Release E (4 October 1999 ) (C) Copyright Cornell Local Roads Program
65 (C) Copyright Cornell University All Rights Reserved Data File: C:\MODCOMP5\DATA\3FAIR.DAT Processed: July 4, 09:04 hrs 3 FAIR Summary of Results for Each Iteration (thicknesses in meters, moduli in MPa) Thickness: Infinite Using Model: Seed Moduli: Itn RMS Err E1 E2 E3 E L L L F L L L F L L L F L -> linear model for this layer F -> modulus for this layer has a fixed value Elapsed time: 0:00:00 (.2 sec. ) Computation terminated because deflection match was within tolerance after 3 iterations. Note: Solution is plausible because RMS error is less than 2 percent. MODCOMP5 Pavement Modulus Back-Calculation Program Version 5.0 Release E (4 October 1999 ) (C) Copyright Cornell Local Roads Program (C) Copyright Cornell University All Rights Reserved Data File: C:\MODCOMP5\DATA\3GOOD6.DAT Processed: July 11, 01:44 hrs 3 GOOD Summary of Results for Each Iteration (thicknesses in meters, moduli in MPa) Thickness: Infinite Using Model: Seed Moduli: Itn RMS Err E1 E2 E3 E F L L F F L L F L -> linear model for this layer F -> modulus for this layer has a fixed value Elapsed time: 0:00:00 (.1 sec. ) Computation terminated because deflection match was within tolerance after 2 iterations. Note: Solution is questionable because RMS error is more than 2 percent. 65
66 MODCOMP5 Pavement Modulus Back-Calculation Program Version 5.0 Release E (4 October 1999 ) (C) Copyright Cornell Local Roads Program (C) Copyright Cornell University All Rights Reserved Data File: C:\MODCOMP5\DATA\3GOOD.DAT Processed: July 4, 09:01 hrs 3 GOOD Summary of Results for Each Iteration (thicknesses in meters, moduli in MPa) Thickness: Infinite Using Model: Seed Moduli: Itn RMS Err E1 E2 E3 E L L L F L L L F L L L F L -> linear model for this layer F -> modulus for this layer has a fixed value Elapsed time: 0:00:00 (.2 sec. ) Computation terminated because deflection match was within tolerance after 3 iterations. Note: Solution is plausible because RMS error is less than 2 percent. MODCOMP5 Pavement Modulus Back-Calculation Program Version 5.0 Release E (4 October 1999 ) (C) Copyright Cornell Local Roads Program (C) Copyright Cornell University All Rights Reserved Data File: C:\MODCOMP5\DATA\3POOR.DAT Processed: July 4, 09:05 hrs 3 POOR Summary of Results for Each Iteration (thicknesses in meters, moduli in MPa) Thickness: Infinite Using Model: Seed Moduli: Itn RMS Err E1 E2 E3 E L L L F L L L F L -> linear model for this layer F -> modulus for this layer has a fixed value Elapsed time: 0:00:00 (.1 sec. ) Computation terminated because deflection match was within tolerance after 2 iterations. Note: Solution is questionable because RMS error is more than 2 percent. 66
67 MODCOMP5 Pavement Modulus Back-Calculation Program Version 5.0 Release E (4 October 1999 ) (C) Copyright Cornell Local Roads Program (C) Copyright Cornell University All Rights Reserved Data File: C:\MODCOMP5\DATA\4FAIR.DAT Processed: July 10, 19:07 hrs 4 FAIR Summary of Results for Each Iteration (thicknesses in meters, moduli in MPa) Thickness: Infinite Using Model: Seed Moduli: Itn RMS Err E1 E2 E3 E L L L F L L L F L -> linear model for this layer F -> modulus for this layer has a fixed value Elapsed time: 0:00:00 (.1 sec. ) Computation terminated because deflection match was within tolerance after 2 iterations. Note: Solution is questionable because RMS error is more than 2 percent MODCOMP5 Pavement Modulus Back-Calculation Program Version 5.0 Release E (4 October 1999 ) (C) Copyright Cornell Local Roads Program (C) Copyright Cornell University All Rights Reserved Data File: C:\MODCOMP5\DATA\4GOOD.DAT Processed: July 10, 19:05 hrs 4 Good Summary of Results for Each Iteration (thicknesses in meters, moduli in MPa) Thickness: Infinite Using Model: Seed Moduli: Itn RMS Err E1 E2 E3 E L L L F L L L F L -> linear model for this layer F -> modulus for this layer has a fixed value Elapsed time: 0:00:00 (.1 sec. ) Computation terminated because deflection match was within tolerance after 2 iterations. Note: Solution is questionable because RMS error is more than 2 percent 67
68 MODCOMP5 Pavement Modulus Back-Calculation Program Version 5.0 Release E (4 October 1999 ) (C) Copyright Cornell Local Roads Program (C) Copyright Cornell University All Rights Reserved Data File: C:\MODCOMP5\DATA\4POOR.DAT Processed: July 10, 19:09 hrs 4 POOR Summary of Results for Each Iteration (thicknesses in meters, moduli in MPa) Thickness: Infinite Using Model: Seed Moduli: Itn RMS Err E1 E2 E3 E L L L F L L L F L -> linear model for this layer F -> modulus for this layer has a fixed value Elapsed time: 0:00:00 (.1 sec. ) Computation terminated because deflection match was within tolerance after 2 iterations. Note: Solution is questionable because RMS error is more than 2 percent. MODCOMP5 Pavement Modulus Back-Calculation Program Version 5.0 Release E (4 October 1999 ) (C) Copyright Cornell Local Roads Program (C) Copyright Cornell University All Rights Reserved Data File: C:\MODCOMP5\DATA\6FAIR.DAT Processed: July 4, 08:46 hrs 6 in. FAIR Summary of Results for Each Iteration (thicknesses in meters, moduli in MPa) Thickness: Infinite Using Model: Seed Moduli: Itn RMS Err E1 E2 E3 E L L L F L L L F L L L F L -> linear model for this layer F -> modulus for this layer has a fixed value Elapsed time: 0:00:00 (.1 sec. ) Computation terminated because deflection match was within tolerance after 3 iterations. Note: Solution is questionable because RMS error is more than 2 percent. 68
69 MODCOMP5 Pavement Modulus Back-Calculation Program Version 5.0 Release E (4 October 1999 ) (C) Copyright Cornell Local Roads Program (C) Copyright Cornell University All Rights Reserved Data File: C:\MODCOMP5\DATA\6GOOD.DAT Processed: July 4, 08:43 hrs 6 GOOD Summary of Results for Each Iteration (thicknesses in meters, moduli in MPa) Thickness: Infinite Using Model: Seed Moduli: Itn RMS Err E1 E2 E3 E L L L F L L L F L L L F L -> linear model for this layer F -> modulus for this layer has a fixed value Elapsed time: 0:00:00 (.4 sec. ) Computation terminated because deflection match was within tolerance after 3 iterations. Note: Solution is plausible because RMS error is less than 2 percent. MODCOMP5 Pavement Modulus Back-Calculation Program Version 5.0 Release E (4 October 1999 ) (C) Copyright Cornell Local Roads Program (C) Copyright Cornell University All Rights Reserved Data File: C:\MODCOMP5\DATA\6POOR.DAT Processed: July 4, 08:48 hrs 6 POOR Summary of Results for Each Iteration (thicknesses in meters, moduli in MPa) Thickness: Infinite Using Model: Seed Moduli: Itn RMS Err E1 E2 E3 E L L L F L L L F L L L F L -> linear model for this layer F -> modulus for this layer has a fixed value Elapsed time: 0:00:00 (.1 sec. ) Computation terminated because deflection match was within tolerance after 3 iterations. Note: Solution is questionable because RMS error is more than 2 percent. 69
70 MODCOMP5 Pavement Modulus Back-Calculation Program Version 5.0 Release E (4 October 1999 ) (C) Copyright Cornell Local Roads Program (C) Copyright Cornell University All Rights Reserved Data File: C:\MODCOMP5\DATA\8FAIR.DAT Processed: July 10, 21:44 hrs 8 fair Summary of Results for Each Iteration (thicknesses in meters, moduli in MPa) Thickness: Infinite Using Model: Seed Moduli: Itn RMS Err E1 E2 E3 E L F L F L F L F L -> linear model for this layer F -> modulus for this layer has a fixed value Elapsed time: 0:00:00 (.1 sec. ) Computation terminated because deflection match was within tolerance after 2 iterations. Note: Solution is questionable because RMS error is more than 2 percent. MODCOMP5 Pavement Modulus Back-Calculation Program Version 5.0 Release E (4 October 1999 ) (C) Copyright Cornell Local Roads Program (C) Copyright Cornell University All Rights Reserved Data File: C:\MODCOMP5\DATA\8GOOD.DAT Processed: July 10, 21:50 hrs 8 GOOD Summary of Results for Each Iteration (thicknesses in meters, moduli in MPa) Thickness: Infinite Using Model: Seed Moduli: Itn RMS Err E1 E2 E3 E F L L F F L L F L -> linear model for this layer F -> modulus for this layer has a fixed value Elapsed time: 0:00:00 (.0 sec. ) Computation terminated because deflection match was within tolerance after 2 iterations. Warning: Solution is not acceptable because RMS error is too large. 70
71 MODCOMP5 Pavement Modulus Back-Calculation Program Version 5.0 Release E (4 October 1999 ) (C) Copyright Cornell Local Roads Program (C) Copyright Cornell University All Rights Reserved Data File: C:\MODCOMP5\DATA\8POOR.DAT Processed: July 10, 21:47 hrs 8 poor Summary of Results for Each Iteration (thicknesses in meters, moduli in MPa) Thickness: Infinite Using Model: Seed Moduli: Itn RMS Err E1 E2 E3 E L F L F L F L F L -> linear model for this layer F -> modulus for this layer has a fixed value Elapsed time: 0:00:00 (.1 sec. ) Computation terminated because deflection match was within tolerance after 2 iterations. Note: Solution is questionable because RMS error is more than 2 percent. MODCOMP5 Pavement Modulus Back-Calculation Program Version 5.0 Release E (4 October 1999 ) (C) Copyright Cornell Local Roads Program (C) Copyright Cornell University All Rights Reserved Data File: C:\MODCOMP5\DATA\10FAIR.DAT Processed: July 4, 09:28 hrs 10 FAIR Summary of Results for Each Iteration (thicknesses in meters, moduli in MPa) Thickness: Infinite Using Model: Seed Moduli: Itn RMS Err E1 E2 E3 E L 73.4 L F F L L F F L L F F L -> linear model for this layer F -> modulus for this layer has a fixed value Elapsed time: 0:00:00 (.1 sec. ) Computation terminated because deflection match was within tolerance after 3 iterations. Warning: Solution is not acceptable because RMS error is too large. 71
72 MODCOMP5 Pavement Modulus Back-Calculation Program Version 5.0 Release E (4 October 1999 ) (C) Copyright Cornell Local Roads Program (C) Copyright Cornell University All Rights Reserved Data File: C:\MODCOMP5\DATA\10GOOD2.DAT Processed: July 4, 09:34 hrs 10 GOOD Summary of Results for Each Iteration (thicknesses in meters, moduli in MPa) Thickness: Infinite Using Model: Seed Moduli: Itn RMS Err E1 E2 E3 E L L L F L L L F L L L F L -> linear model for this layer F -> modulus for this layer has a fixed value Elapsed time: 0:00:00 (.2 sec. ) Computation terminated because deflection match was within tolerance after 3 iterations. Warning: Solution is not acceptable because RMS error is too large. MODCOMP5 Pavement Modulus Back-Calculation Program Version 5.0 Release E (4 October 1999 ) (C) Copyright Cornell Local Roads Program (C) Copyright Cornell University All Rights Reserved Data File: C:\MODCOMP5\DATA\10GOOD.DAT Processed: July 4, 09:32 hrs 10 GOOD Summary of Results for Each Iteration (thicknesses in meters, moduli in MPa) Thickness: Infinite Using Model: Seed Moduli: Itn RMS Err E1 E2 E3 E L L L L L L L L L L L L L -> linear model for this layer Elapsed time: 0:00:00 (.2 sec. ) Computation terminated because deflection match was within tolerance after 3 iterations. Note: Solution is very credible because RMS error is less than 1 percent. 72
73 MODCOMP5 Pavement Modulus Back-Calculation Program Version 5.0 Release E (4 October 1999 ) (C) Copyright Cornell Local Roads Program (C) Copyright Cornell University All Rights Reserved Data File: C:\MODCOMP5\DATA\10POOR.DAT Processed: July 4, 09:24 hrs 10 BAD Summary of Results for Each Iteration (thicknesses in meters, moduli in MPa) Thickness: Infinite Using Model: Seed Moduli: Itn RMS Err E1 E2 E3 E L 37.4 L F F L 79.5 L F F L 92.1 L F F L 94.1 L F F L -> linear model for this layer F -> modulus for this layer has a fixed value Elapsed time: 0:00:00 (.1 sec. ) Computation terminated because deflection match was within tolerance after 4 iterations. Warning: Solution is not acceptable because RMS error is too large. 73
74 Appendix D-BISAR stress and strain results 74

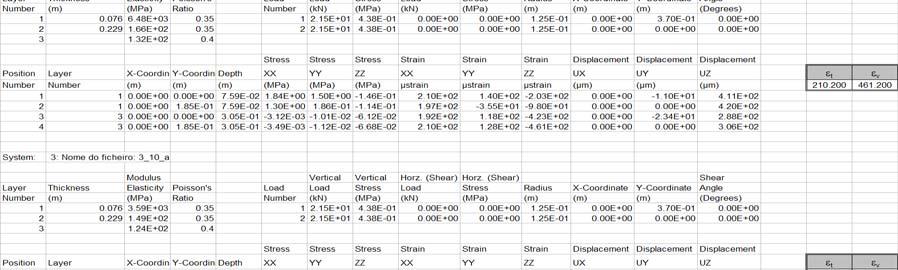

75 75

76 76


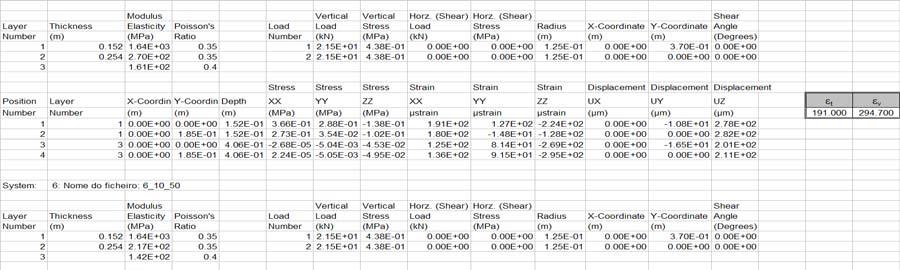
77 77

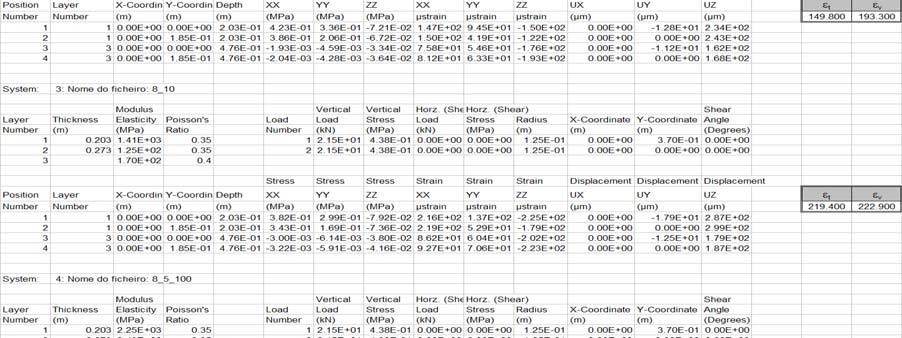


78 78


79 79


80 Appendix E-Increase in Treatment Structural Life due to Treatment in Years Calculation Inputs 80